


Bitcoin – slightly bullish but caught between 9,375 USD and 12,125 USD
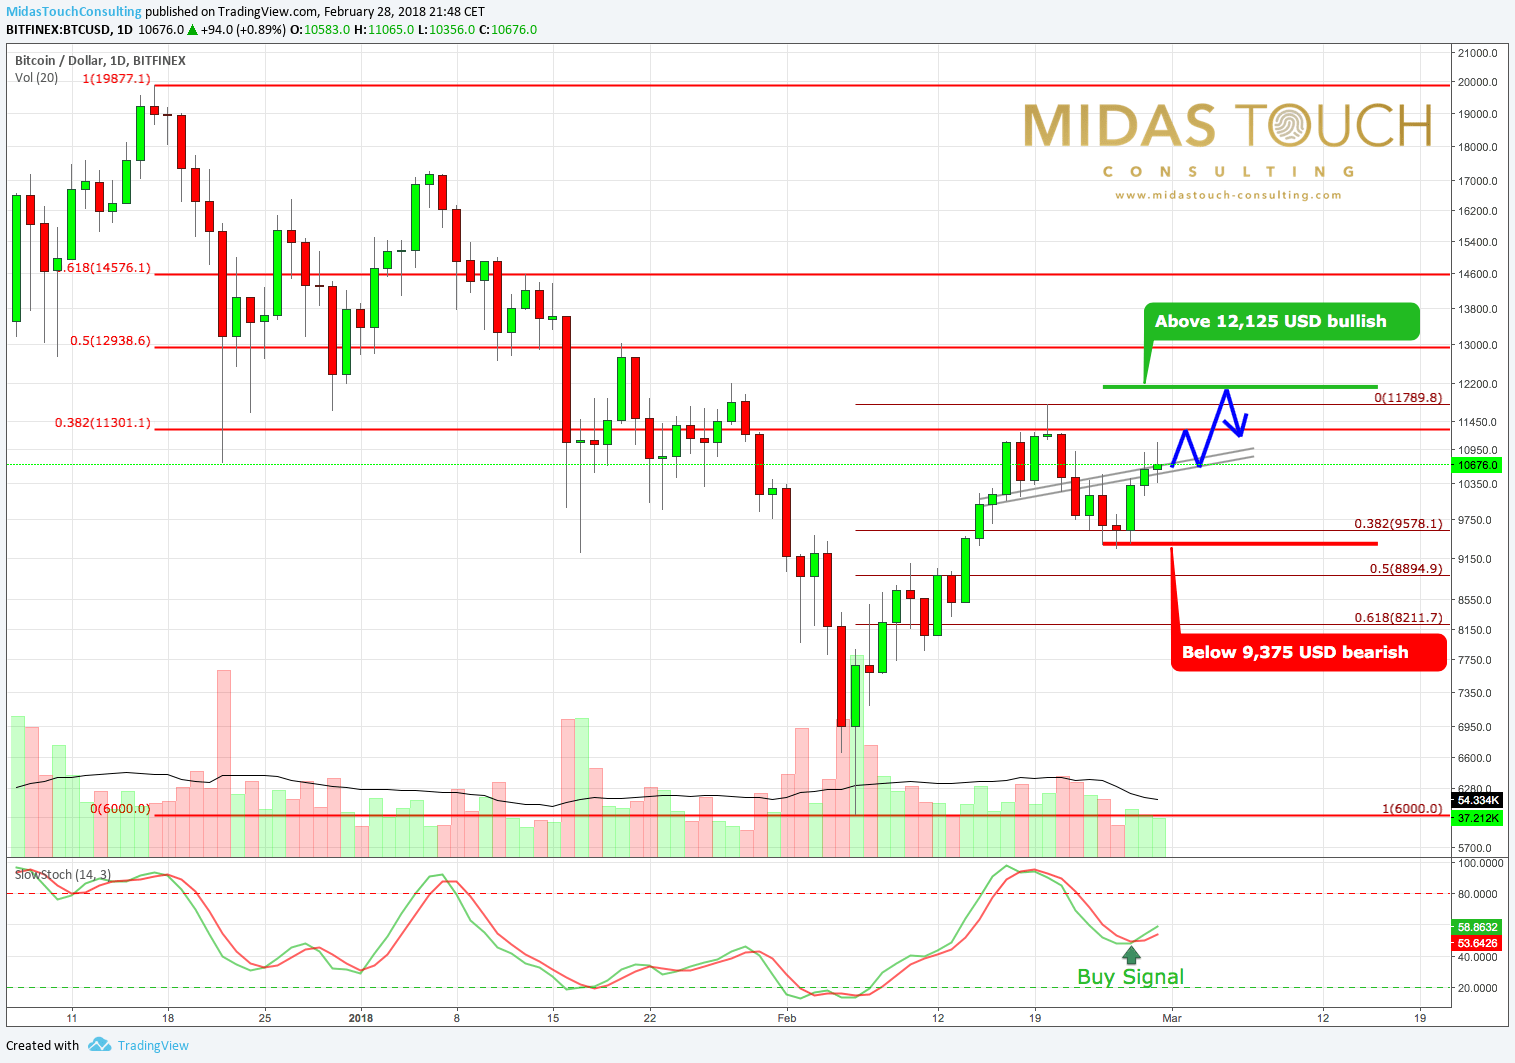
Bitcoin has been pretty much following my presumption from last week. We got a pullback towards 9,280 USD and since then a new wave up. The suspected HS-pattern is more or less off the table but the neckline is where Bitcoin currently is struggling a bit. With a new buy signal on the daily chart and an oversold 1h chart, chances are pretty good that prices will rise once again towards the 38.2%-Fibonacci retracement around 11,300 USD. Due to an active sell signal on the 4h chart I am not too bullish over the next 2 or 3 days.
Overall Bitcoin needs to move above 12,125 USD to push the chart towards a more bullish reading while prices below 9,375 USD would signal that bears are back in control. In between those two numbers the situation is more or less neutral with a slightly bullish undertone. Moving above 11,300 USD would already indicate that bulls are getting more confident and might aim to push Bitcoin up towards the 50%-Fibonacci retracement at 12,940 USD.
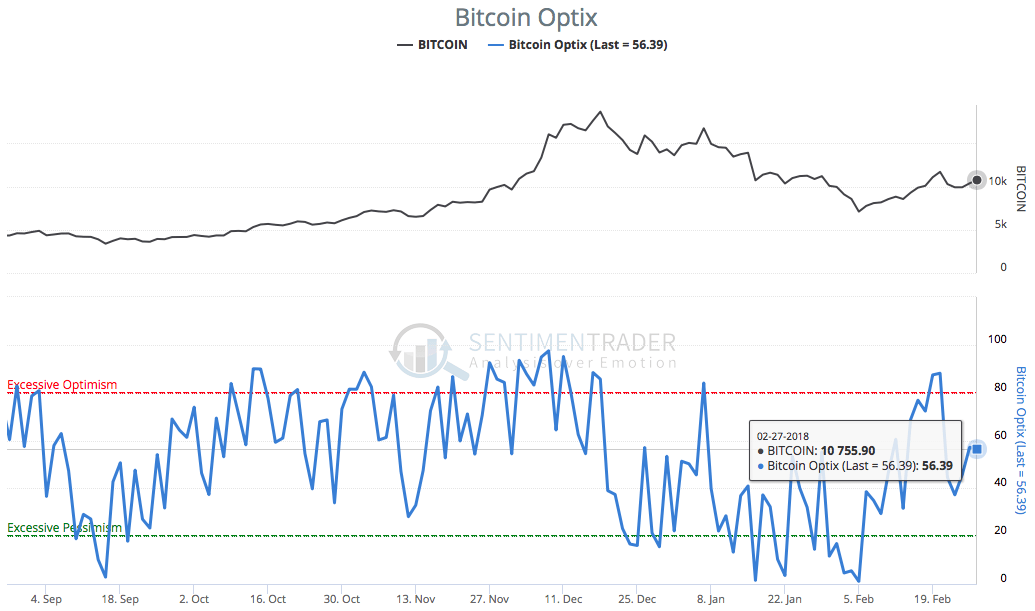
Looking at the latest sentiment data, it is obvious, that optimism has recovered yet there is still quite some room left to move higher from here…
In the bigger picture a pretty positive fact comes from the weekly chart where the stochastic oscillator clearly has turned around from oversold levels and now flashes a new buy signal!
To conclude I still continue to believe that Bitcoin and most of the altcoins need more time to consolidate and digest the epic wave of speculation that hit them during the last couple of months. That doesn’t have to mean new lows below 6,000 USD for Bitcoin but could also be achieved with a complex multi months sideways market between 7,000 USD and 15,000 USD.

