


The Midas Touch Gold Model™ Update
As in previous years, our dear friends from Incrementum gave us the opportunity to write a short update on the current status of the Midas Touch Gold Model™ as well as present a short-to midterm outlook by Florian Grummes in their new In Gold We Trust report 2021. In summary, the strengths of the Midas Touch Gold Model™ are found in its versatility and quantitative measurability, because it carefully examines many different perspectives on the gold market and brings them together in one clearly laid out table. The Midas Touch Gold Model™ Update.
The beginning of wisdom lies in the definition of conditions. – Sokrates
Gold prices reached a new all-time high around USD 2,075 on August 7th, 2020, and then entered a correction that lasted almost nine months.
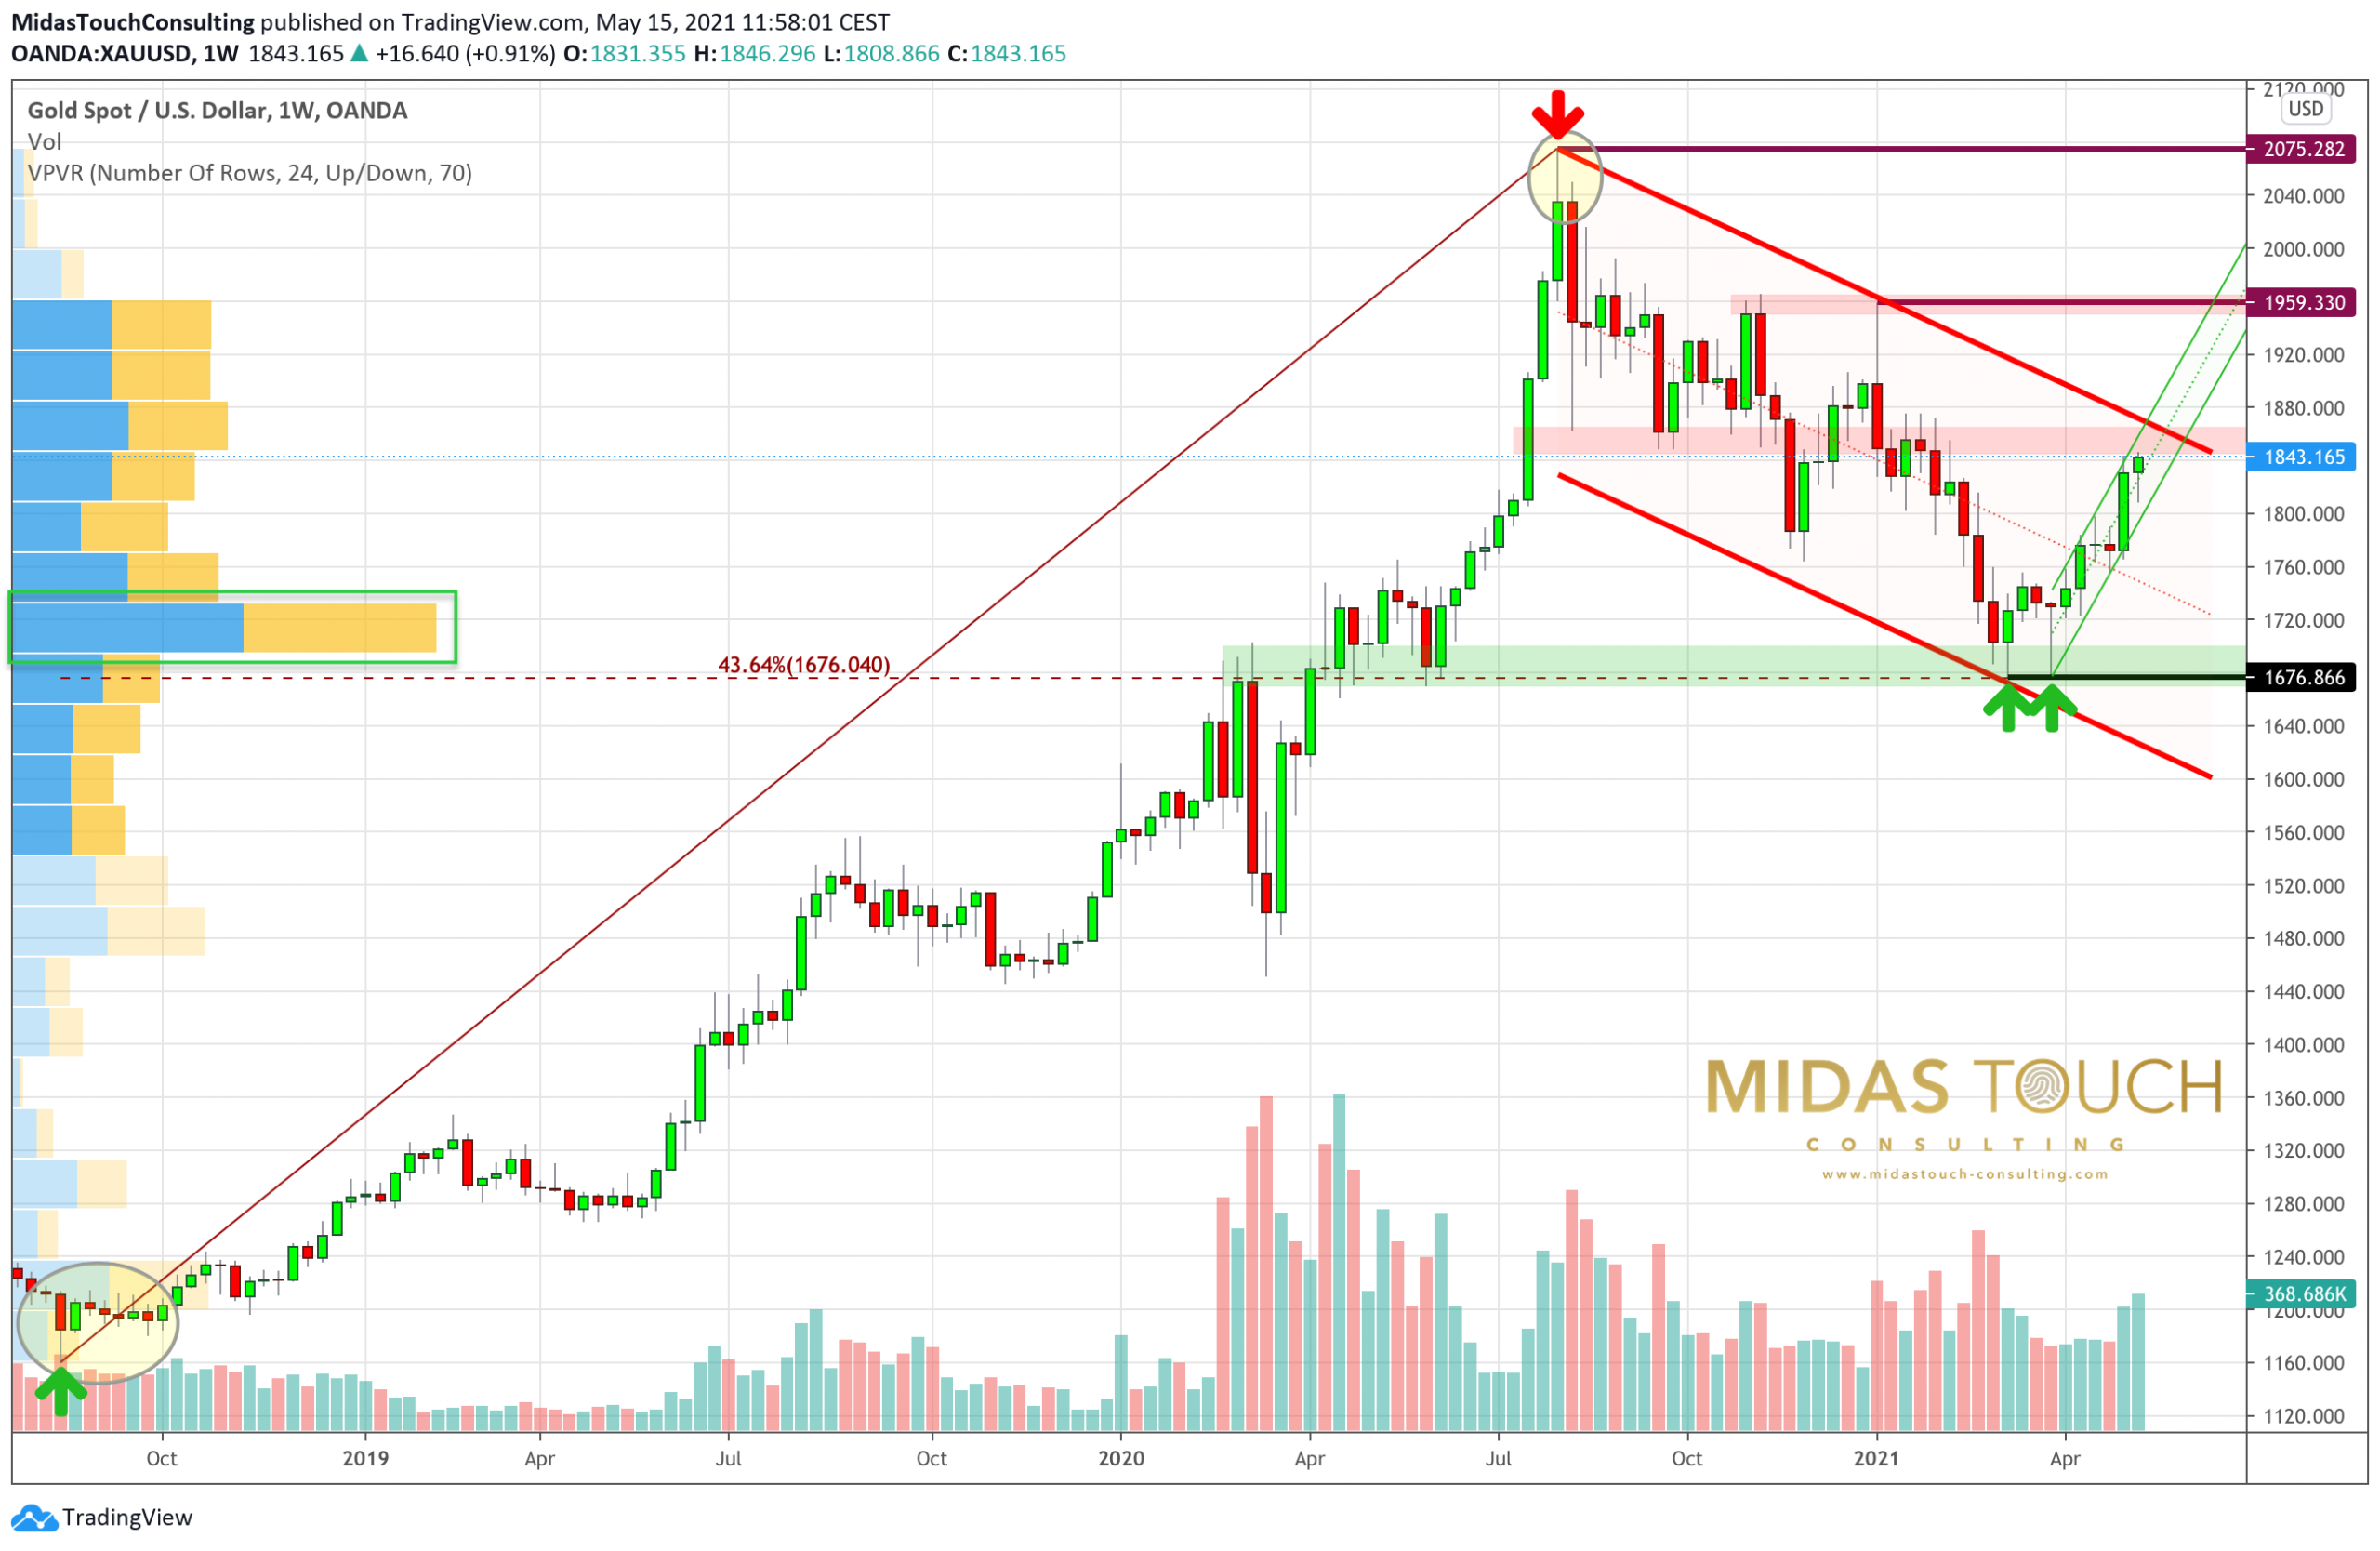
Gold in US-Dollars, weekly chart as of May 15th, 2021. Source: Tradingview
The first part of this correction was rather tough and confusing until the end of November 2020. After a quick bounce the sell-off then accelerated from the beginning of January 2021. It was only with a double low at USD 1,676 on March 8th and USD 1,678 on March 31st that the gold market finally bottomed out. Most likely, this double low marked the end of the correction and gold is now on its way back to higher prices and thus, in the medium to long term, also to new all-time highs.
The correction in the order of around USD 400 had become necessary last summer due to the exuberant euphoria. And this pullback has definitely been healthy in the big picture. With a strongly oversold situation and a pretty pessimistic sentiment, the foundation for the next big uptrend was likely laid under high trading volume around the USD 1,700 US levels. While platinum and palladium were able to largely escape this correction, the gold price pullback left clear traces on the vast majority of mining stocks. Silver, on the other hand, dipped into a month-long sideways phase and has so far been able to hold up somewhat better than gold.
The Midas Touch Gold Model™ gradually switched back into bullish mode in April 2021.
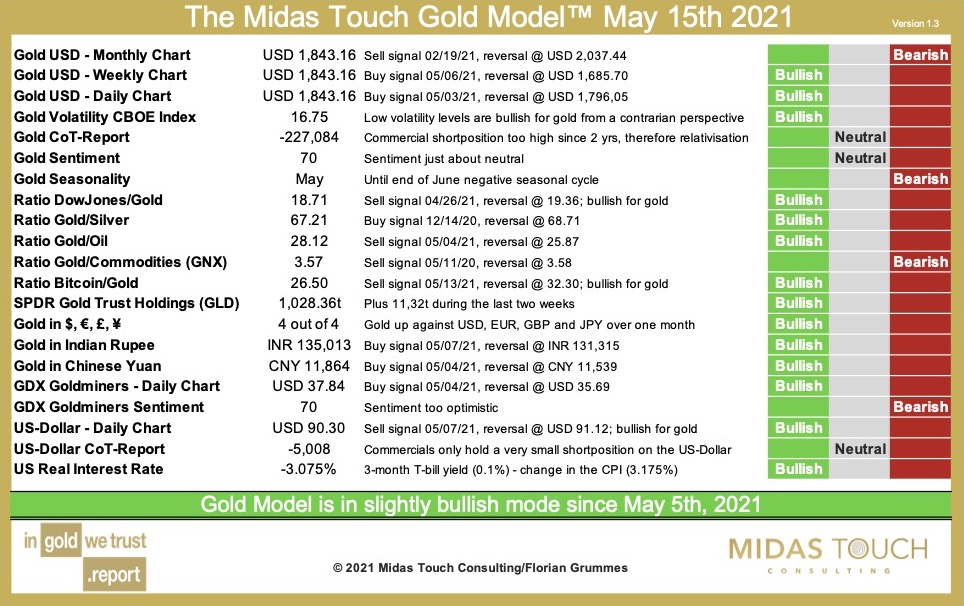
The Midas Touch Gold Model™ as of May 15th, 2021. Source: Midas Touch Consulting
With the breakout above USD 1,800 on May 5th, the signal strengthened to “strongly bullish”. The new buy signals for gold price against the Indian rupee, against the Chinese renminbi and against the US-Dollar also contributed to this. In addition, the gold mining stocks (GDX Goldminers ETF) have been delivering a bullish signal again since May 4th. On top, the clearly negative real interest rates in the U.S. have been supporting the gold price for many months. On the other hand, the overly optimistic short-term sentiment together with the seasonal component are the only unfavorable factors in the coming weeks ahead. The strongest seasonal period of the year for the gold market typically begins in June at the earliest, but usually not later than July.
The following interesting conclusions can also currently be derived from the Midas Touch Gold Model™:
- Against the US-Dollar a sell signal is still active on the monthly chart for the gold price. This would currently only be negated at prices above USD 2,037. Hence, the gold bulls still have a lot of work to do before the big picture turns clearly bullish again.
- Against commodities, the gold price is on the verge of a buy signal. While exploding base metal and energy prices have been seen for many months, there could be a change of favorites back to gold over the next few months.
- Bitcoin has mercilessly outperformed the gold price in recent months. With bitcoin’s ongoing pullback below USD 50,000, a fresh buy signal for gold against bitcoin has emerged in recent days. Here, too, there are signs of at least a temporary change of favorites and a comeback for gold.
On the daily chart, the gold price is about to reach its strong resistance zone around USD 1,850.
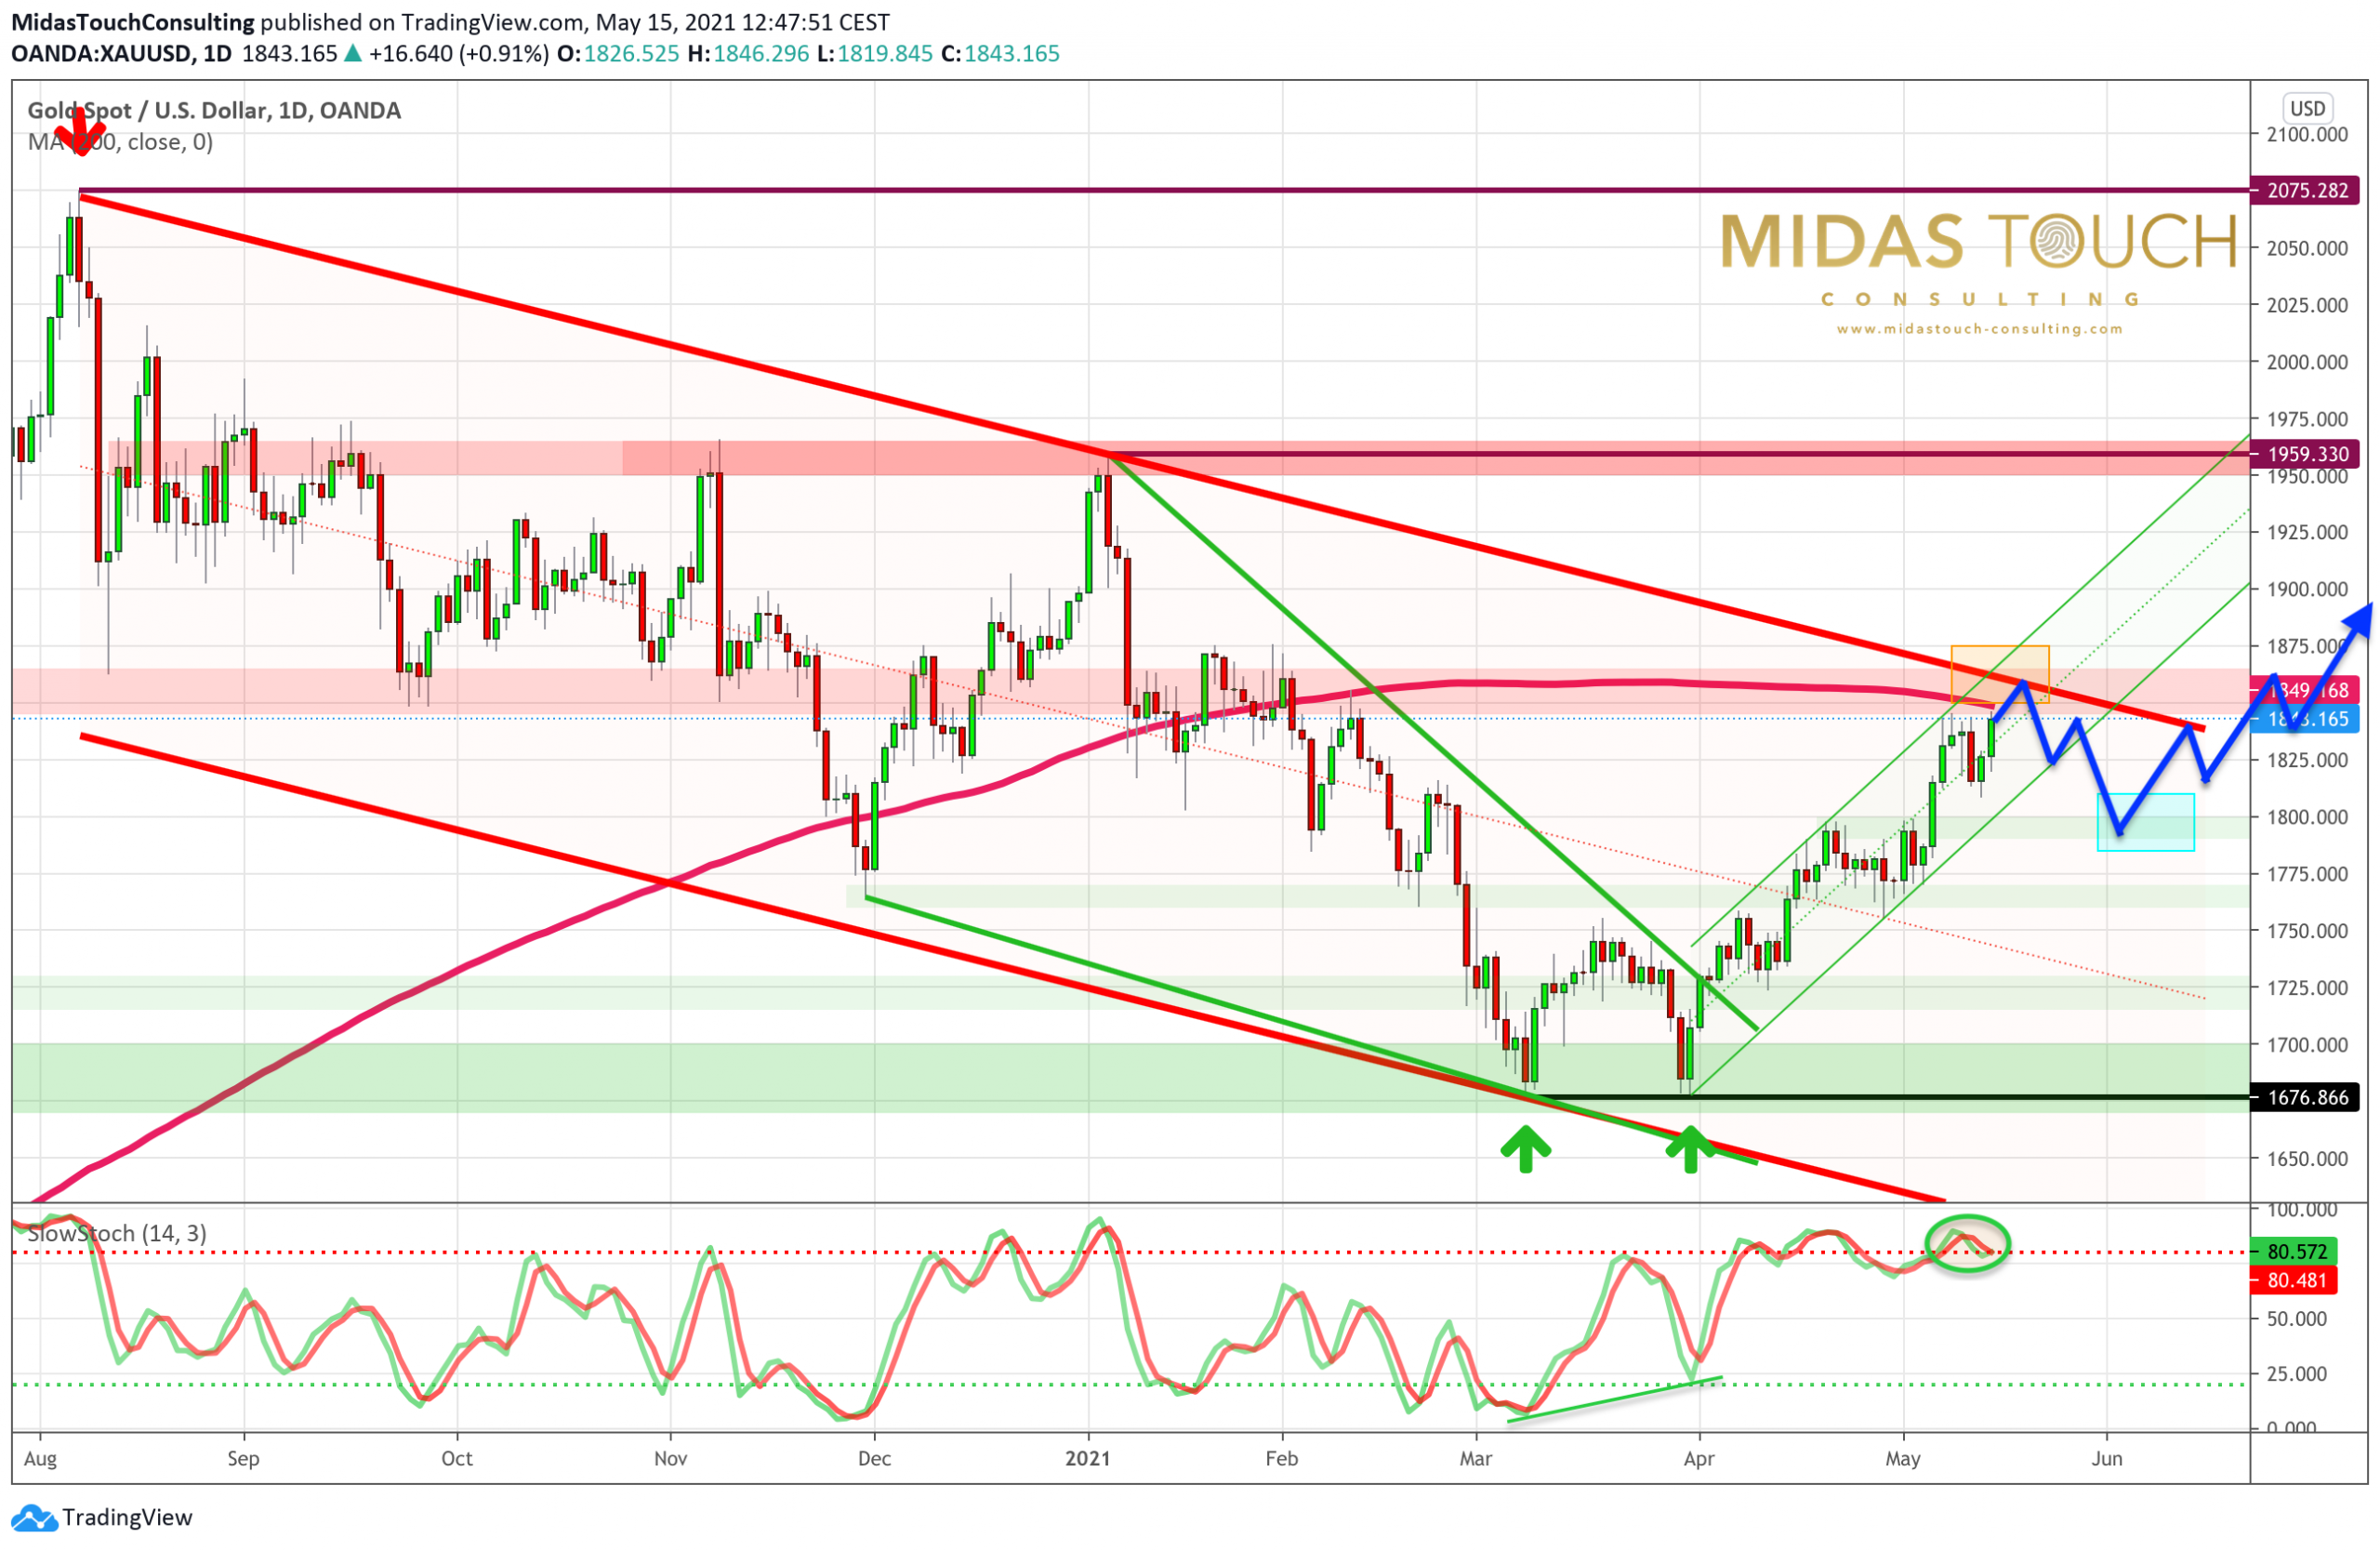
Gold in US-Dollars, daily chart as of May 15th, 2021. Source: Tradingview
The downward trend of the last nine months runs between USD 1,850 and 1,860. In addition, the slightly falling 200-day moving average (USD 1,849) is also located here. Together with the overbought stochastic, the probability of an initial failure of the recovery rally is therefore extremely high. With a diversion or pullback to the area of approx. USD 1,785 to 1,810, the gold price could gain new strength. This in order to clear the resistance around USD 1,850 in the next step. Alternatively, gold prices could simply consolidate back and forth around the 200-day moving average in the coming weeks.
In the bigger picture, gold must overcome the strong resistance at USD 1,965.
Here, all the bullish efforts failed at the beginning of November as well as at the beginning of January. And both times a very quick and sharp sell-off followed. Obviously, there is still a long way to go before this level is going to be reached.
Realistically, one should therefore assume that the gold market will still need some time before a sustainable breakout above this strong resistance zone can happen. As soon as this succeeds, however, the way would be clear towards the psychological mark of USD 2,000 and the all-time high at USD 2,075.
Feel free to join us in our free Telegram channel for daily real time data and a great community.
If you like to get regular updates on our gold model, precious metals and cryptocurrencies you can subscribe to our free newsletter.

