Bitcoin, the beauty principle
We consider only those parts of the technical analysis useful that is based on fundamental truths to support their reasoning that serves as the foundation for a system. Human beings and their innate need “to be right” often distort these truths to please the ego. Small mistakes can differentiate between being a winner or a loser when it comes to systems and market participation. Like a tiny error in a line of code can bring a whole program to a halt. Bitcoin, the beauty principle.
Bitcoin is for 14 months in a bull run, and we see future price levels take out all-time highs within this year. That is not all. When you look back through all time frames over the last twenty years, you will find Bitcoins’ trading behavior to be unusually directional. While most heavily traded market instruments trade most of the time in a sideways zone, any directional tools used in charting for Bitcoin come in handy. Bitcoin is also volatile and accelerates fast in its directional legs, not ideal for low-risk reentries with the conventional use of fixed indicator settings. Consequently, we will illustrate our termed “beauty principle” on moving averages in the following chart.
BTC-USD, Daily Chart, Thinking from the market’s perspective:

Bitcoin in US-Dollar, daily chart as of May 17th, 2021.
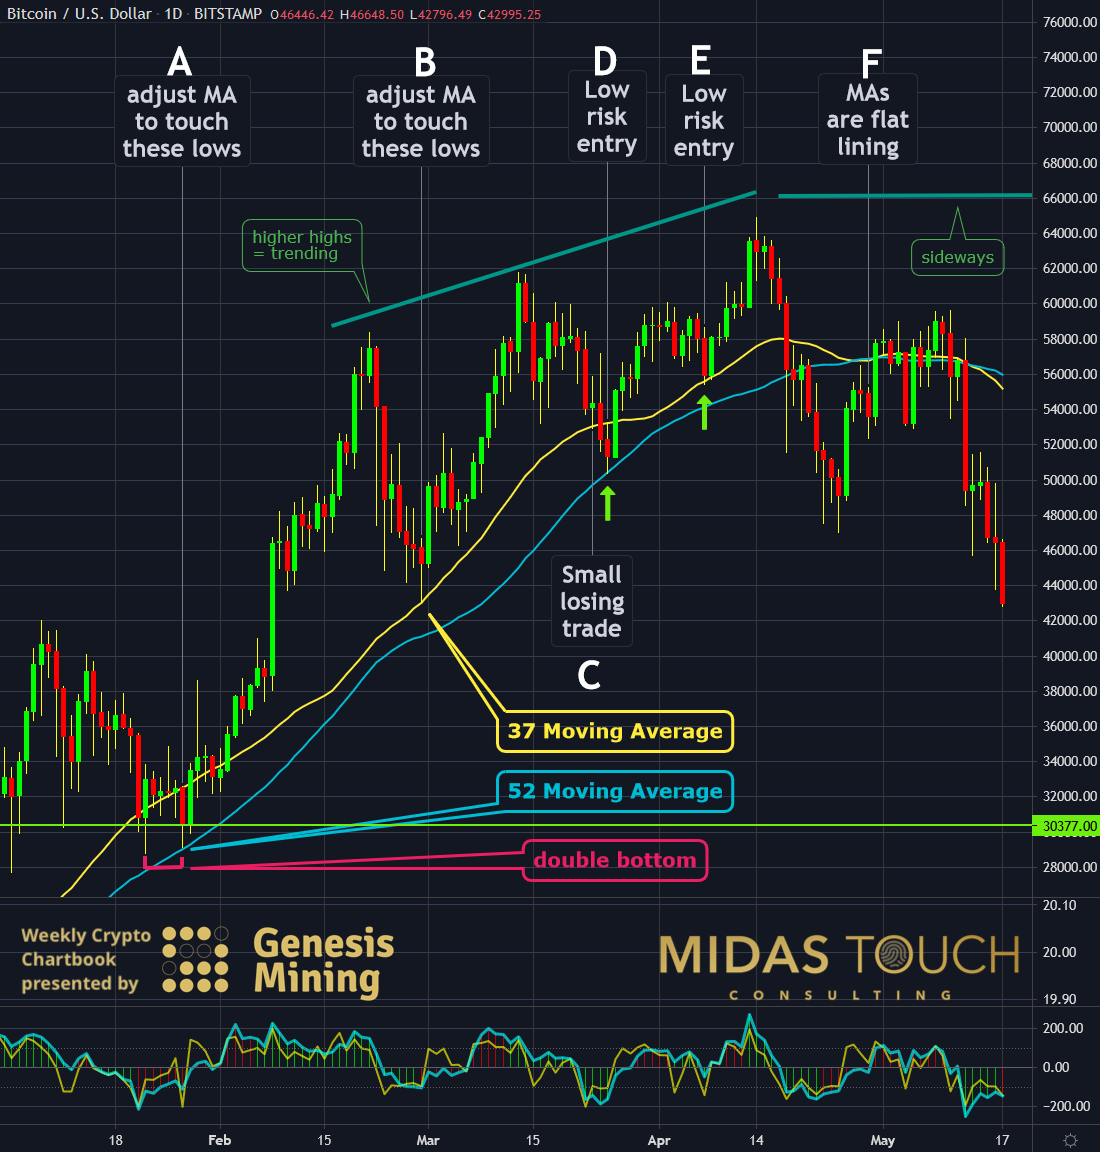
Looking at this year’s price action from a daily time frame perspective, we find support near US$30,000 at the beginning of the year and a low-risk long entry at a double bottom near the end of January. From there, the price explodes to the upside.
- A. Once prices trend higher and point A is identified as a significant low, we import a moving average indicator. We set it that the price precisely touches the indicator line. The settings turn out to be 52.
- B. Like A, another major low got identified, and again we import a moving average and set its settings for a precise price touch to the indicator line. The settings turn out to be 37.
- C. We enter the market once the price touches the 37 MA and the price bounces for an 8% move. Enough for generous financing if you use our quad exit strategy and walk away with profits with the rest position stopped out at break-even entry levels. In this case, we generously allowed this trade to be a small losing trade should you use a different exit strategy that doesn’t mitigate risk.
- D. Another extremely low-risk entry point provides a profitable trade of more than 28% if measured to the ATH, equaling a risk-reward ratio of over 1:55 with our 0.5% stop size.
- E. Like D, prices turn precisely at the moving average touch, and advances exceeding 17% could have been made (r:r 1:34).
- F. Shows that once both moving averages touch and flat line, the temporary trend is invalidated.
We are trying to illustrate that thinking from the market’s perspective, being principle-based, provides better results. Better than insisting on the market price to bounce from random assumed settings as fixed parameters.
BTC-USD, Daily Chart, Visual harmony:

Bitcoin in US-Dollar, daily chart as of May 17th, 2021.
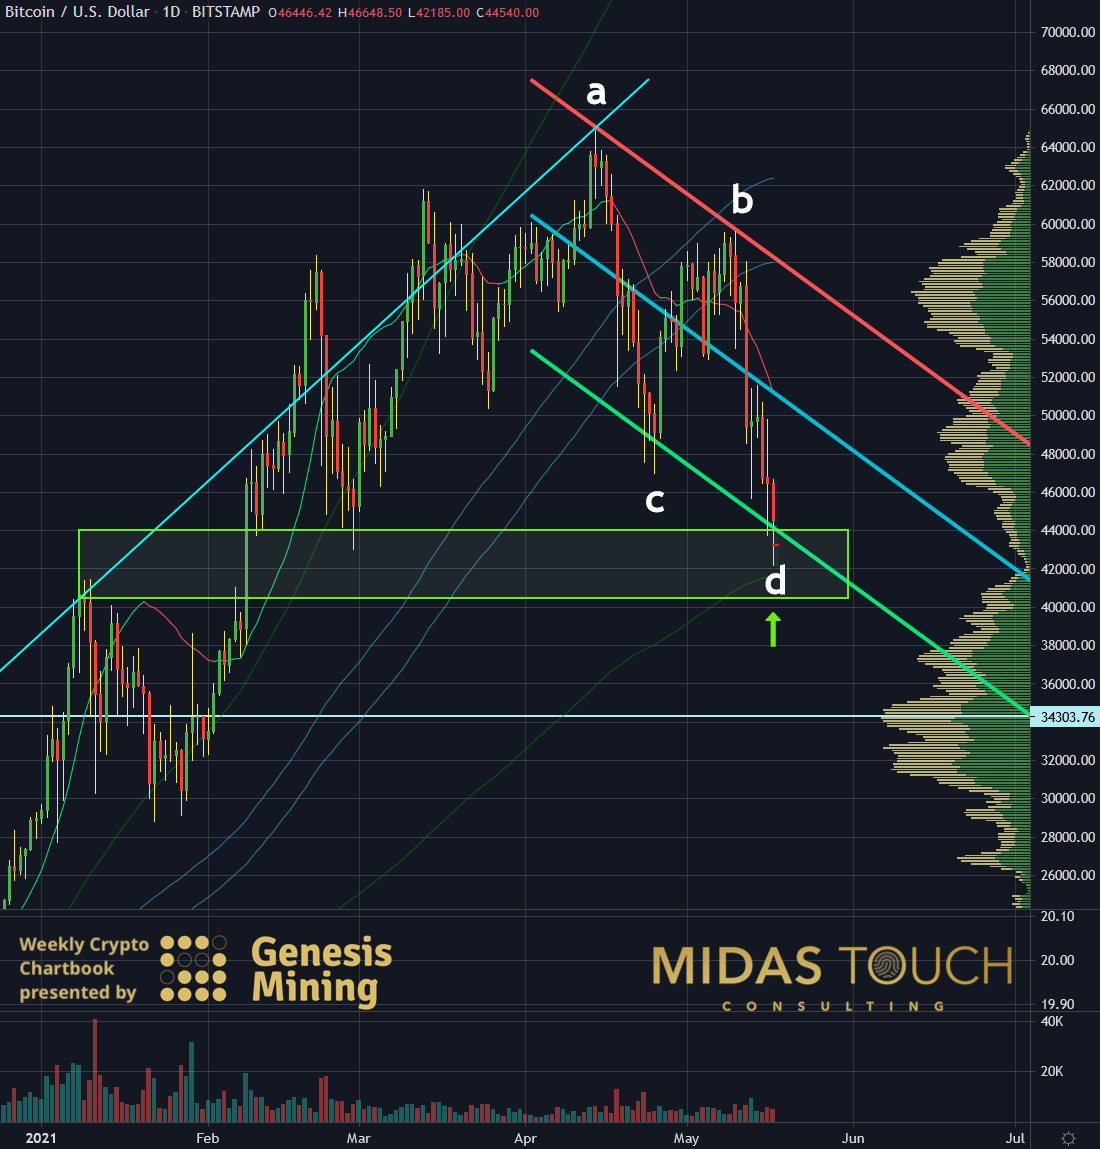
The beauty principle is wide span. Since the all-time high in April this year, the price has tapered off. Over the last week, the price decline has accelerated. While the most typical technical analysis was at a loss to identify the low-risk entry point near US$42,280 (we post all our entries and exits in real-time in our free telegram channel), a linear regression channel only based on user settings that made the point a and point b touch precisely these two market highs, allowed us to pinpoint this precision low-risk entry.
At a closer look, you will find no help from TA tools like support resistance lines or transactional volume support, which was at a void Chanel at US$42k.
Instead, you will find at point d exactly the same candlestick overshoot length through the bottom line of the linear regression line as on point c.
Please don’t take our word for it. Experiment with this way of accommodating the market versus rigid methods in a fluid environment. You will find the beauty principle to be principle-based and very useful.

BTC-USD, Weekly Chart, Bitcoin, the beauty principle, Room to go:

Bitcoin in US-Dollar, weekly chart as of May 17th, 2021.
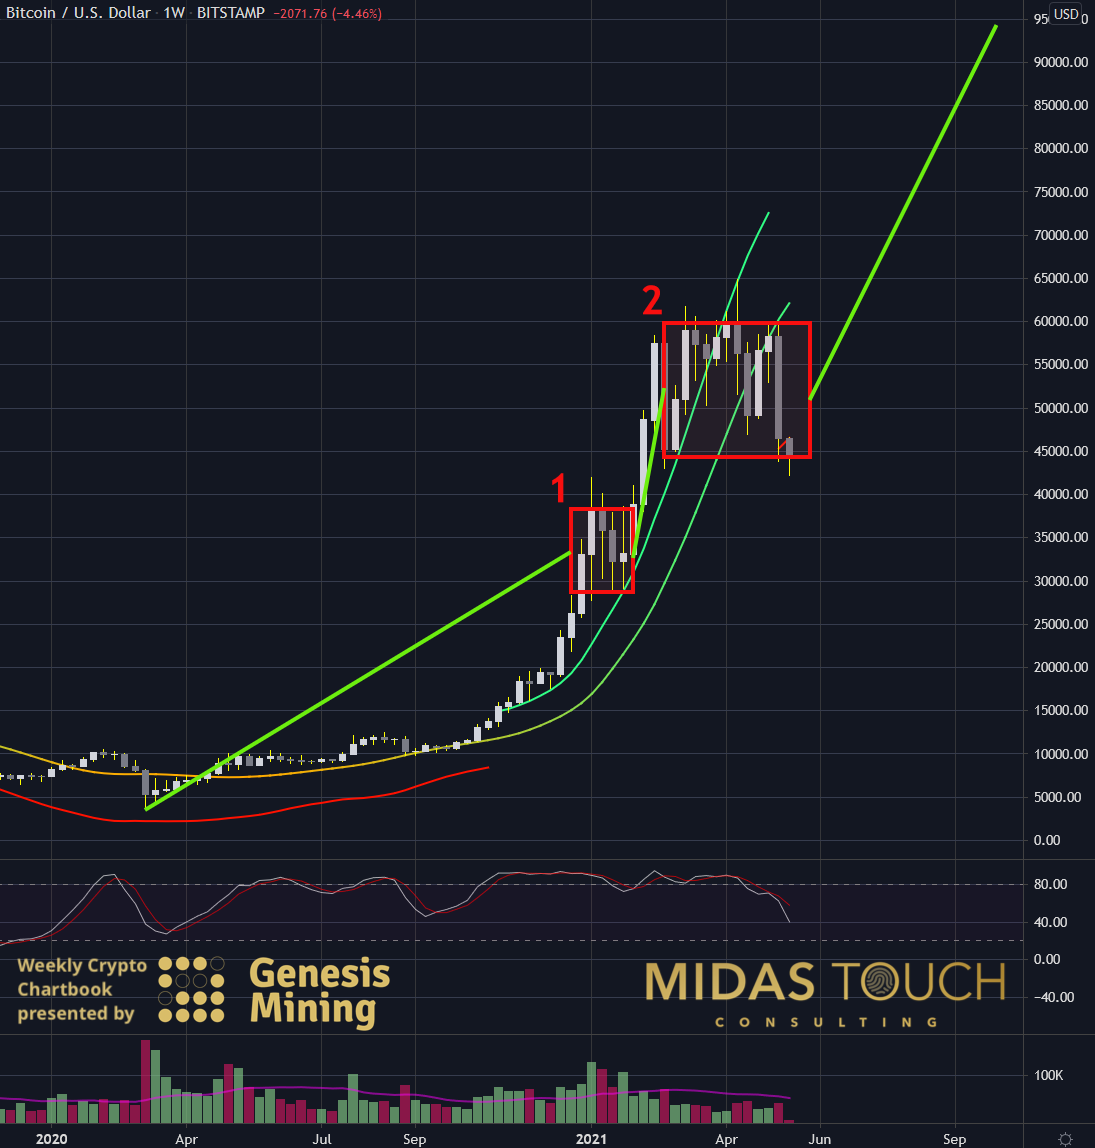
Let us zoom out to the bigger picture using a weekly chart. We can see that Bitcoin only had two major legs yet in this uptrend. Consequently, if the price closes within the sideways zone Nr.2 (red box) above US$44,500 by the end of this week, we have excellent chances for further price advances.
Bitcoin, the beauty principle:
What we termed the beauty principle isn’t only applicable to directional indicators but most technical interpretations. Inventors and, more importantly, interpreters of technical tools that manipulate the values a chart is made of (like price, volume, transactions, time, range) insist on strictly defined rules. They create, in a world of uncertainties, a tool to try to gain certainty. They support the ego’s need of being right. While this can help partially for confidence and the psychology of trading, it is, in our humble opinion, a limited way of trying to restrict a field that in principle has a vast number of variables and, as such, needs more room for interpretation.
Instead of insisting on a rigid number setting of an indicator being matched by the market, it is much more useful to look back at the most recent event and instead adjust ones’ setting to the way it fits what the market did at that time. Ride the wave and let the market dictate your behavior versus trying to please the ego. This is much more principle-based versus hoping for the market to behave as you want it to. Especially knowing that the market does not care what you want in the first place.
Feel free to join us in our free Telegram channel for daily real time data and a great community.
If you like to get regular updates on our gold model, precious metals and cryptocurrencies you can subscribe to our free newsletter.


