


The Midas Touch Gold Model™ Update
As in previous years, our dear friends from Incrementum gave us the opportunity to contribute an update on the current status of the Midas Touch Gold Model™ as well as present a short-to midterm outlook by Florian Grummes in their upcoming In Gold We Trust report 2022. Our Midas Touch Gold Model illuminates the gold market from many different perspectives with a rational and holistic approach. It convinces with its versatility and its quantitative measurability. Although the model is based on a lot of data, it succeeds in summarizing an extensive analysis compactly and clearly in a table and in coming to a clear conclusion. The Midas Touch Gold Model™ Update as of May 14th, 2022.
Nothing has such power to broaden the mind as the ability to investigate systematically and truly all that comes under thy observation in life. – Marcus Aurelius
Gold – The big picture
Gold prices reached a new all-time high on August 7th, 2020, with prices at USD 2,075, which is still valid today.
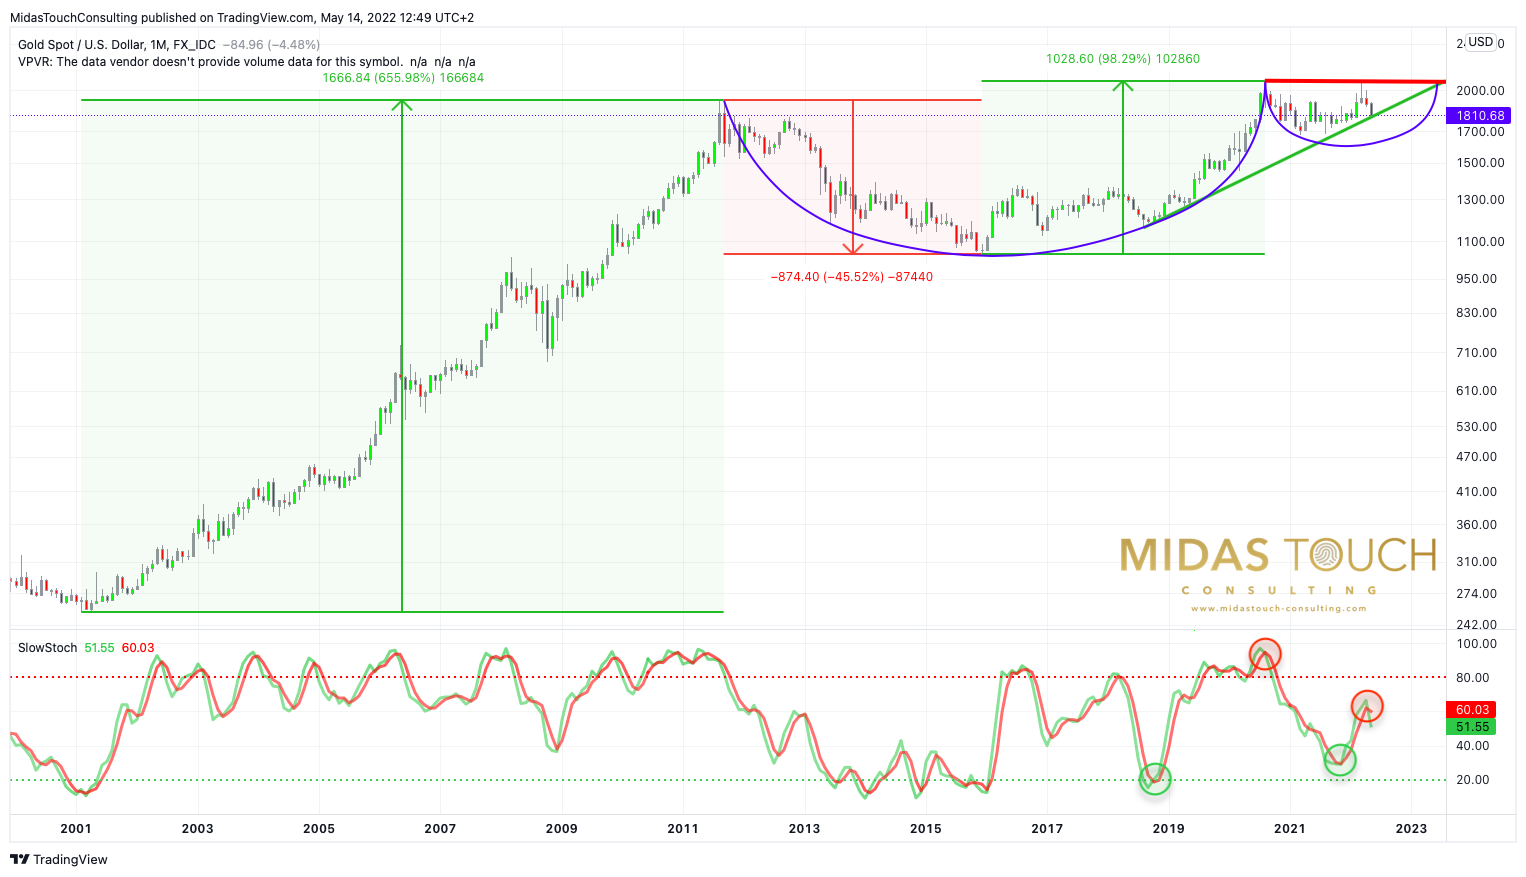
Gold in US-Dollars, monthly chart as of May 14th, 2022. Source: Tradingview
The correction that has been going on for almost two years is therefore not yet finally over and compared to the last In Gold We Trust Report, gold is currently only trading USD 32 higher. After the support around USD 1,680 had withstood the attacks of the bears three times in the past year, gold was able to gain a good USD 390 or 23.2% within eight months from the low on August 9th, 2021, to the recent top on March 8th, 2022. However, this remarkable rally could only develop real momentum from the end of January 2022. Prior to that, gold mostly traded trickily sideways and thus created a “giving up”-mood amongst market participants shortly before the turn of the year.
In the meantime, however, gold prices have come back down significantly from the spring high at USD 2,070. Actually, gold is down by USD 270 or 13%. Particularly since April 18th, when the first recovery in the gold market failed just below the mark of USD 2,000, gold went to its knees and was most recently mercilessly passed through to the downside during the brutal liquidation wave within the whole financial markets.
Neither the 200-day moving average (currently USD 1,836) nor the broad support zone around USD 1,830 could stop the sell-off so far. At the current weekly closing price, however, the gold price was able to save itself into the weekend above the uptrend line that started back in August 2018. This tiny positive detail increases the chances for an imminent counter trend bounce or recovery in the short-term.
In the big picture, therefore, gold is still in a consolidation or correction phase. Since the consensus of precious metals fans until recently was clearly on the immediate breakout from the large “cup with handle” formation, which was believed to be certain, the exact opposite was bound to happen, as is often the case in the markets. Nevertheless, the breakout to new all-time highs has most likely not been canceled, but only postponed. However, this would require sustained prices above USD 2,000. Then it could happen quickly. In view of the imminent price weakness, however, it is better to plan with a time frame of one to three years until the breakout above the bulwark between USD 2,000 and USD 2,070 will actually succeed.
The Midas Touch Gold Model™ Update
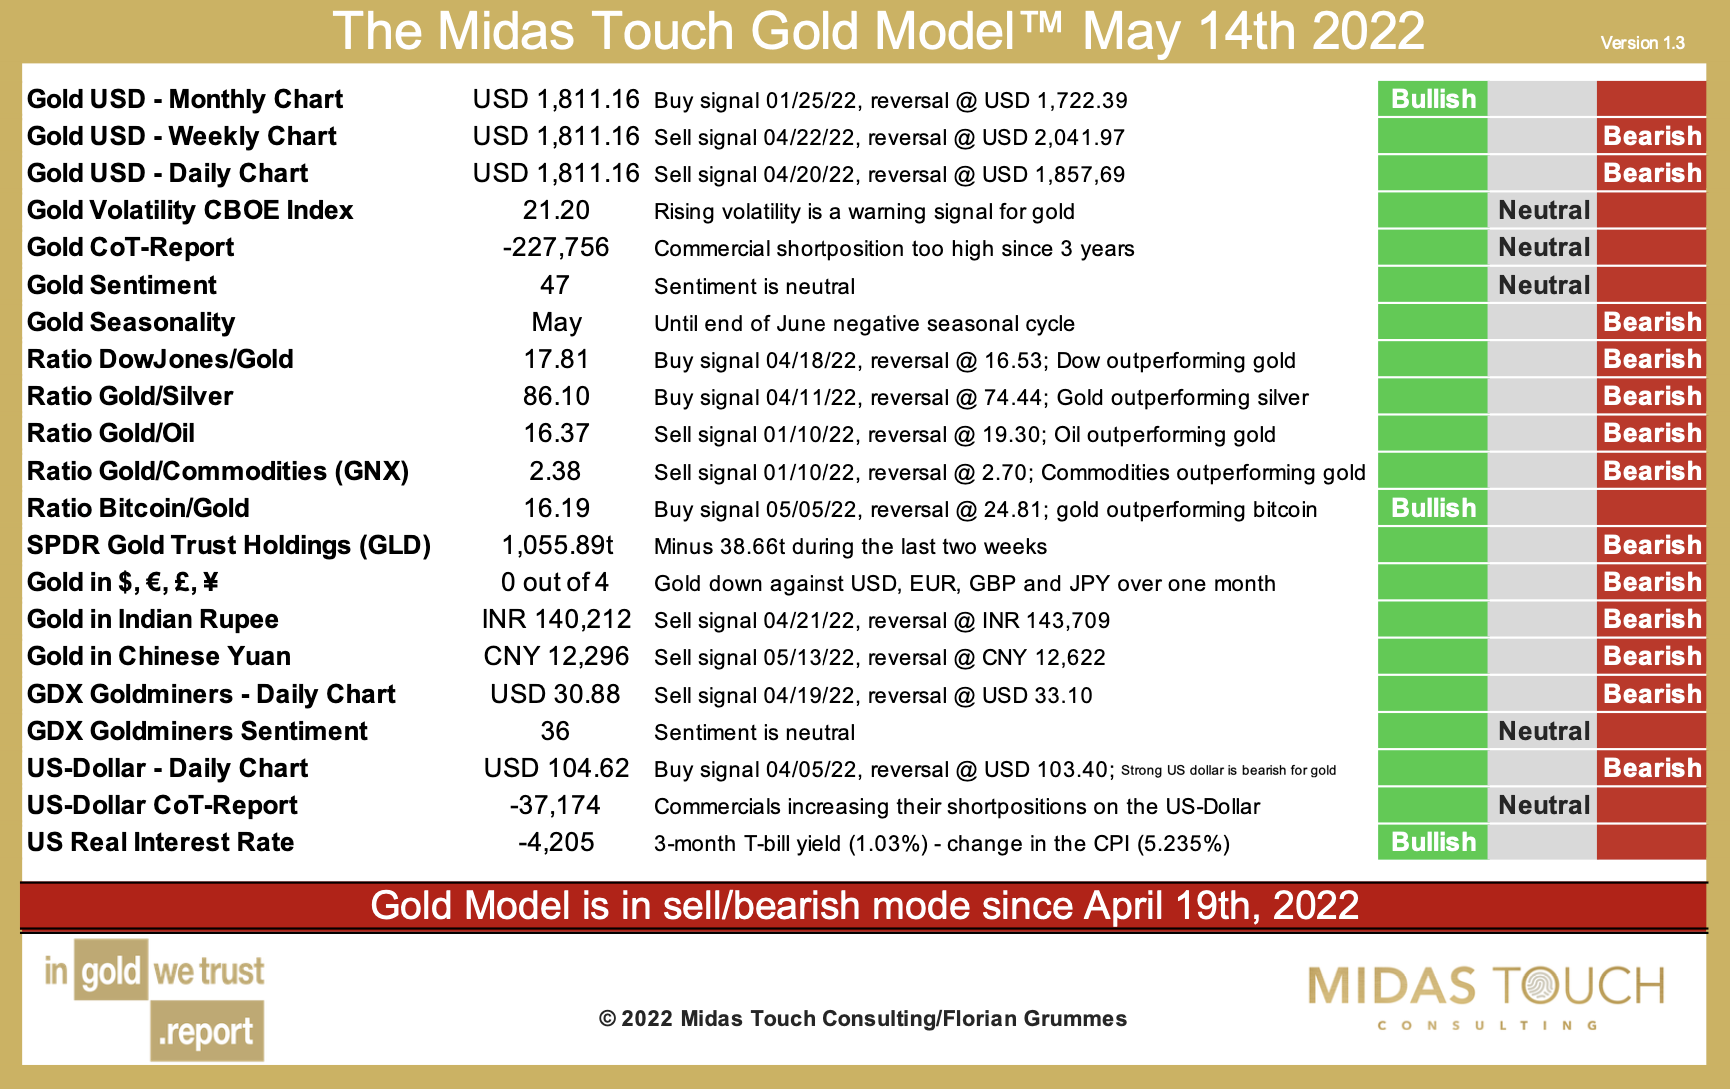
The Midas Touch Gold Model™ as of May 14th, 2022. Source: Midas Touch Consulting
The Midas Touch Gold Model™ switched into bearish mode on April 19th, 2022. The initial setup has deteriorated further since then, and a sustainable bullish signal is currently a long way off. In retrospect, the slide below USD 1,940 between April 18th and April 22nd saw numerous individual signals switch into bearish mode. These were new sell signals on the daily and weekly charts for the gold price in U.S. dollars as well as in Indian rupees, and on the daily chart for the GDX Gold Mines ETF. In addition, there was a sell signal from the Dow Jones/gold-ratio. Due to the weak development of the silver price, the gold/silver-ratio turned already on April 11th and thus announced the drama of recent weeks early.
Only the monthly chart for the gold price in U.S. dollars as well as the bitcoin/gold-ratio and the negative real interest rates in the U.S. currently contribute bullish signals.
Overall, the following conclusions can currently be derived from the Midas Touch Gold Model™:
- On the monthly chart for gold in USD, a buy signal is still active. This would currently only be negated at prices below USD 1,722. On the upside, however, prices above USD 2,041 are currently needed to classify the weekly chart as bullish again. Until then, USD 230 are currently missing. Hence, we have to assume that gold will probably need a lot of time again until a new sustainable bullish setup will be established on all three decisive time frames (monthly, weekly and daily chart).
- As well, the strongly increased gold/silver-ratio makes clear that one will have to exercise patience.It may still take a long time before silver heralds the next exaggeration phase on the upside with a clear outperformance against gold.
- The weakness of gold against other commodities is also striking. Since a significantly weaker oil price is not foreseeable for the time being in view of the difficult geopolitical situation and many other commodities will increasingly suffer from supply difficulties, a new buy signal for gold against commodities will probably drag on for a longer time.
- Although bitcoin has mercilessly outperformed gold in recent years, the bitcoin/gold-ratio currently favors gold. Actually, it now takes just under 16 ounces of gold to buy one Bitcoin. It would be no surprise if within the next 12 months, bitcoin could temporarily be purchased for only 10 ounces or even less.
- The US Dollar index gained a good 17.3% over the past 12 months and hence has been putting quite some pressure on gold, especially in recent weeks. Thanks to the steep rally, the US Dollar Index is currently trading at its highest level in 21.5 years. However, the strongly overbought and overheated situation could soon force a significant pullback, which would allow at least a temporary recovery in the gold price. Should the US Dollar index fall below 103.40, this component within the Midas Touch Gold Model™ changes to bullish for gold.
Gold – Outlook until the summer
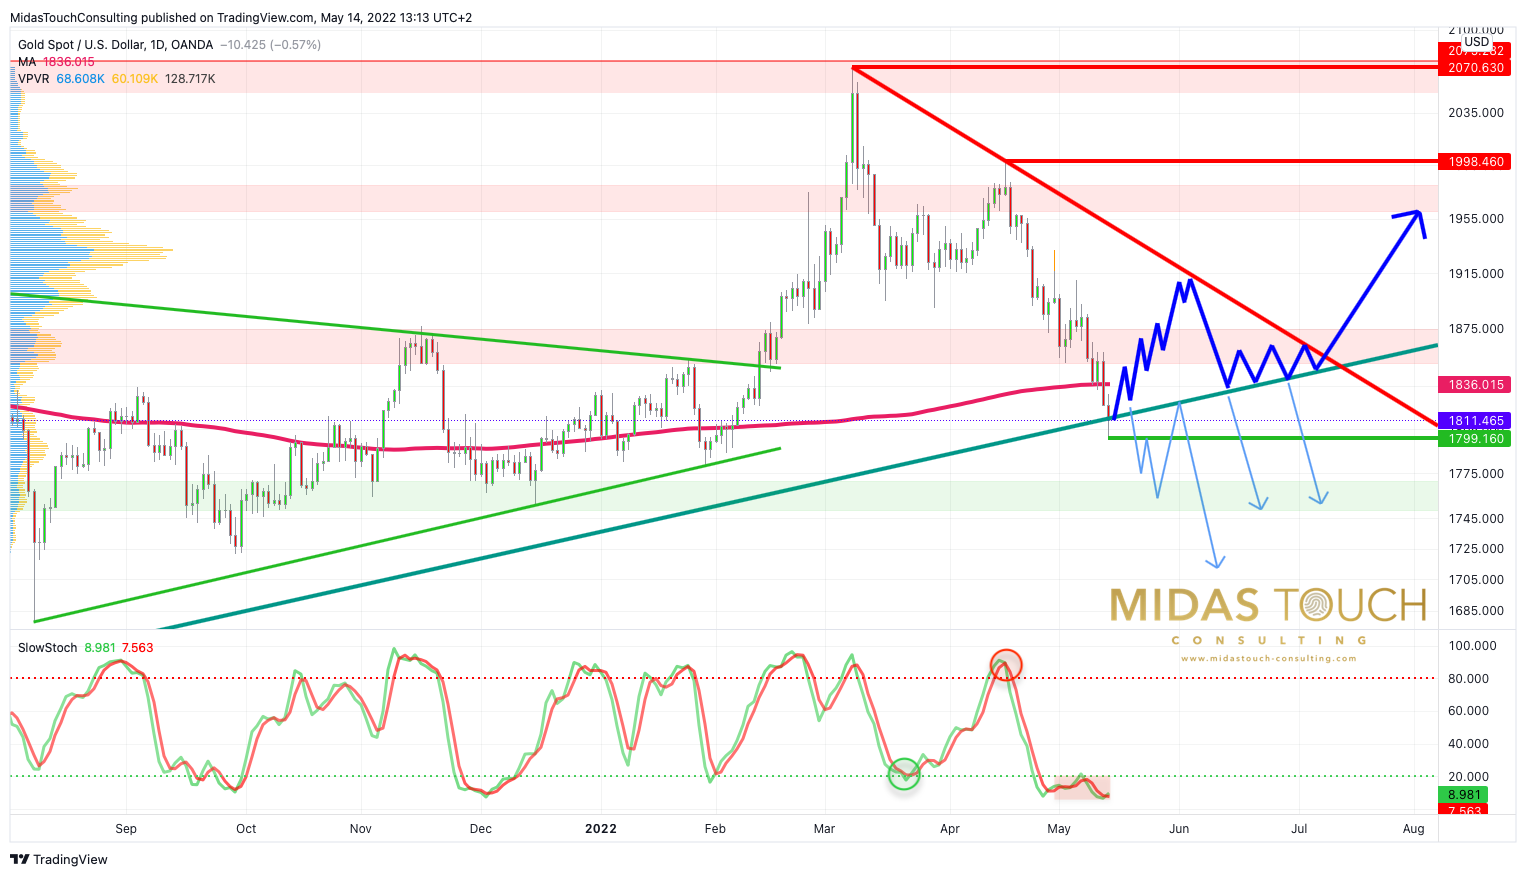
Gold in US-Dollars, daily chart as of May 14th, 2022. Source: Tradingview
On the daily chart, gold fell from USD 1,998 to USD 1,799 without much resistance in the last 20 trading days. Thus, the large dark green uptrend line was reached on Friday but did hold at least per daily and weekly closing price. Despite this sharp price slide and a clearly oversold situation, however, hardly any signals for a bottom and a possible recovery are discernible so far. Rather, the support zone around USD 1,850 was cracked within five trading days. The 200-day moving average (currently USD 1,836) withstood the pressure of the bears for only two trading days. And the stochastic oscillator would be strongly oversold but has been embedded below 20 for 10 trading days, thus locking in the downtrend for the time being.
Since the consequences of the bursting of the tech bubble are not yet fully foreseeable and a merciless liquidation wave has been pulling the rug out from under all markets on a large scale for weeks, significantly lower prices are also conceivable for the gold market. In the short term, the “actio and reactio principle” should ensure a steep interim recovery around the December low at USD 1,750 at the very latest. This bounce could also start now and lift the gold price at least back above its 200-day line in the direction of the USD 1,850 level. In a second recovery step, a presumably unsuccessful attack towards the new downtrend line around USD 1,900 would then be possible. But subsequently, the gold price would have to undergo a second test of its slightly rising 200-day moving average until midsummer, since after all, it stands better on two legs.
Alternatively, the crash in the financial markets continues more or less directly. The bombed-out sentiment speaks against it, however. Similar to 2008, gold would certainly not be able to escape such a crash scenario and would probably pull back to at least USD 1,680. Therefore, in the current environment, one must continue to act very cautiously. Only those who still have sufficient liquidity at the final low will be able to successfully take advantage of the spectacular opportunities that will present themselves.
All in all, the gold price is in very difficult waters, not only in technical terms, but also seasonality wise. A bullish expectation has rarely paid off in the past between March and July. The best thing to do as a gold bug in this phase is simply to patiently keep your feet still, because the start of a new uptrend or rally within the precious metals sector lasting several months is likely not starting before August.
Feel free to join us in our free Telegram channel for daily real time data and a great community. If you like to get regular updates on our gold model, precious metals and cryptocurrencies you can also subscribe to our free newsletter.
Disclosure: This article and the content are for informational purposes only and do not contain investment advice or recommendations. Every investment and trading move involves risk, and readers should conduct their own research when making a decision. The views, thoughts and opinions expressed here are the author’s alone. They do not necessarily reflect or represent the views and opinions of Midas Touch Consulting.

