


Gold – First signs of stabilization
The last five months have been quite a rollercoaster in the gold market. First gold managed to stage an impressive rally from US$1,750 up to US$2,070. Then it came all the way back down to a low of US$1,787 a week ago. Since then, a first bounce has brought it back to slightly below US$1,850. Gold – First signs of stabilization.
Review
With its most recent high at US$1,998, gold prices failed just below the round mark of US$2,000 on Easter Monday. Since then, along with an implosion in the entire financial market, a brutal wave down made its way in the gold market. Without much resistance and within just four weeks, gold prices fell by 10.5% from US$1,998 to US$1,787. However, since the beginning of this week, gold is now showing first signs of stabilization. The 200-day moving average (US$ 1,838) as well as the important multi-year uptrend line around US$1,820 have been reconquered in the short-term at least.
In particular, the strength of the U.S. dollar affected the gold price in recent weeks. In a deep red market environment, the U.S. dollar played out its function as a “safe haven” to the fullest. But here, too, there have been signs of at least a small countermovement, which provided support for precious metals.
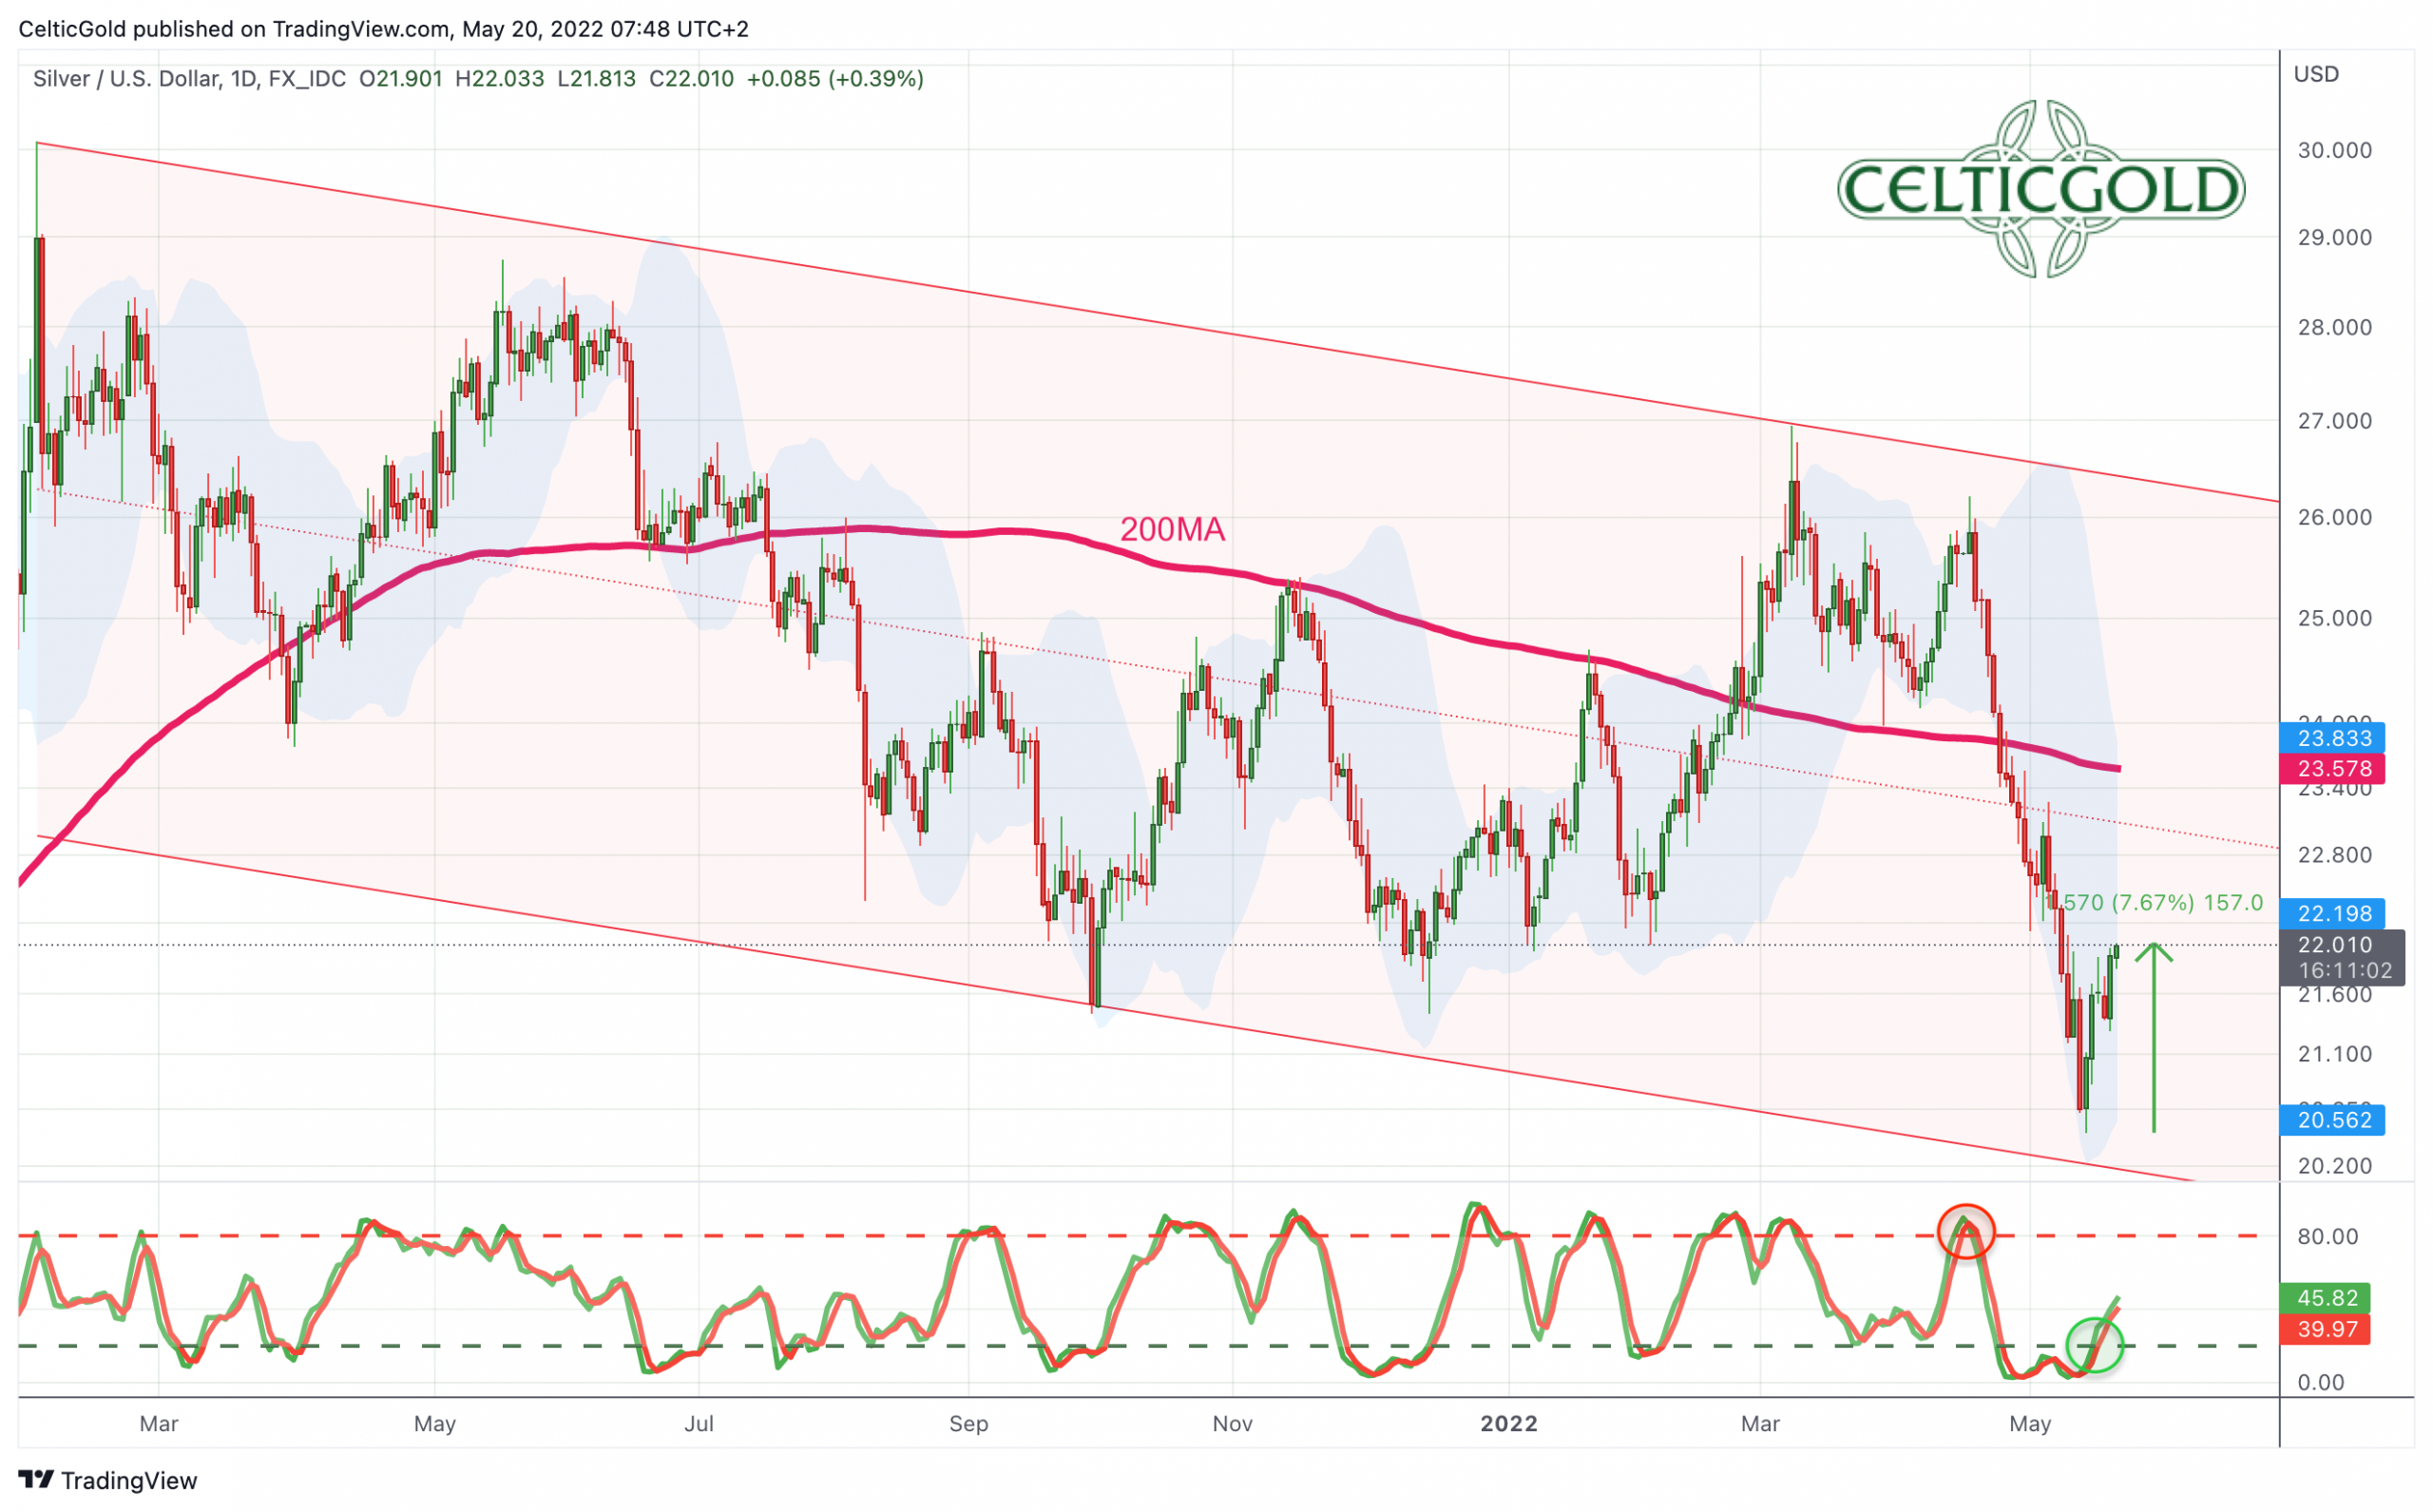
Silver in US-Dollars, daily chart as of May 20th, 2022. Source: Tradingview
Since May 12th, the somewhat surprising relative strength of silver is also worth noting. The little brother of gold had no easy stand since February 2021 and could never keep up with the development of gold. The gradual easing of COVID restrictions in China, which is now in prospect, seems to have boosted demand for industrial metals somewhat, hence prices for silver, copper, and platinum were initially able to recover better than gold in recent days.
Overall, the current situation in the financial markets is extremely shaky and difficult. Despite the increasingly emerging bargains, one is still well advised for the time being to drive on sight and primarily hold liquidity on the sidelines.
Technical Analysis: Gold in US-Dollar
Weekly Chart – Recovery towards US$1,855
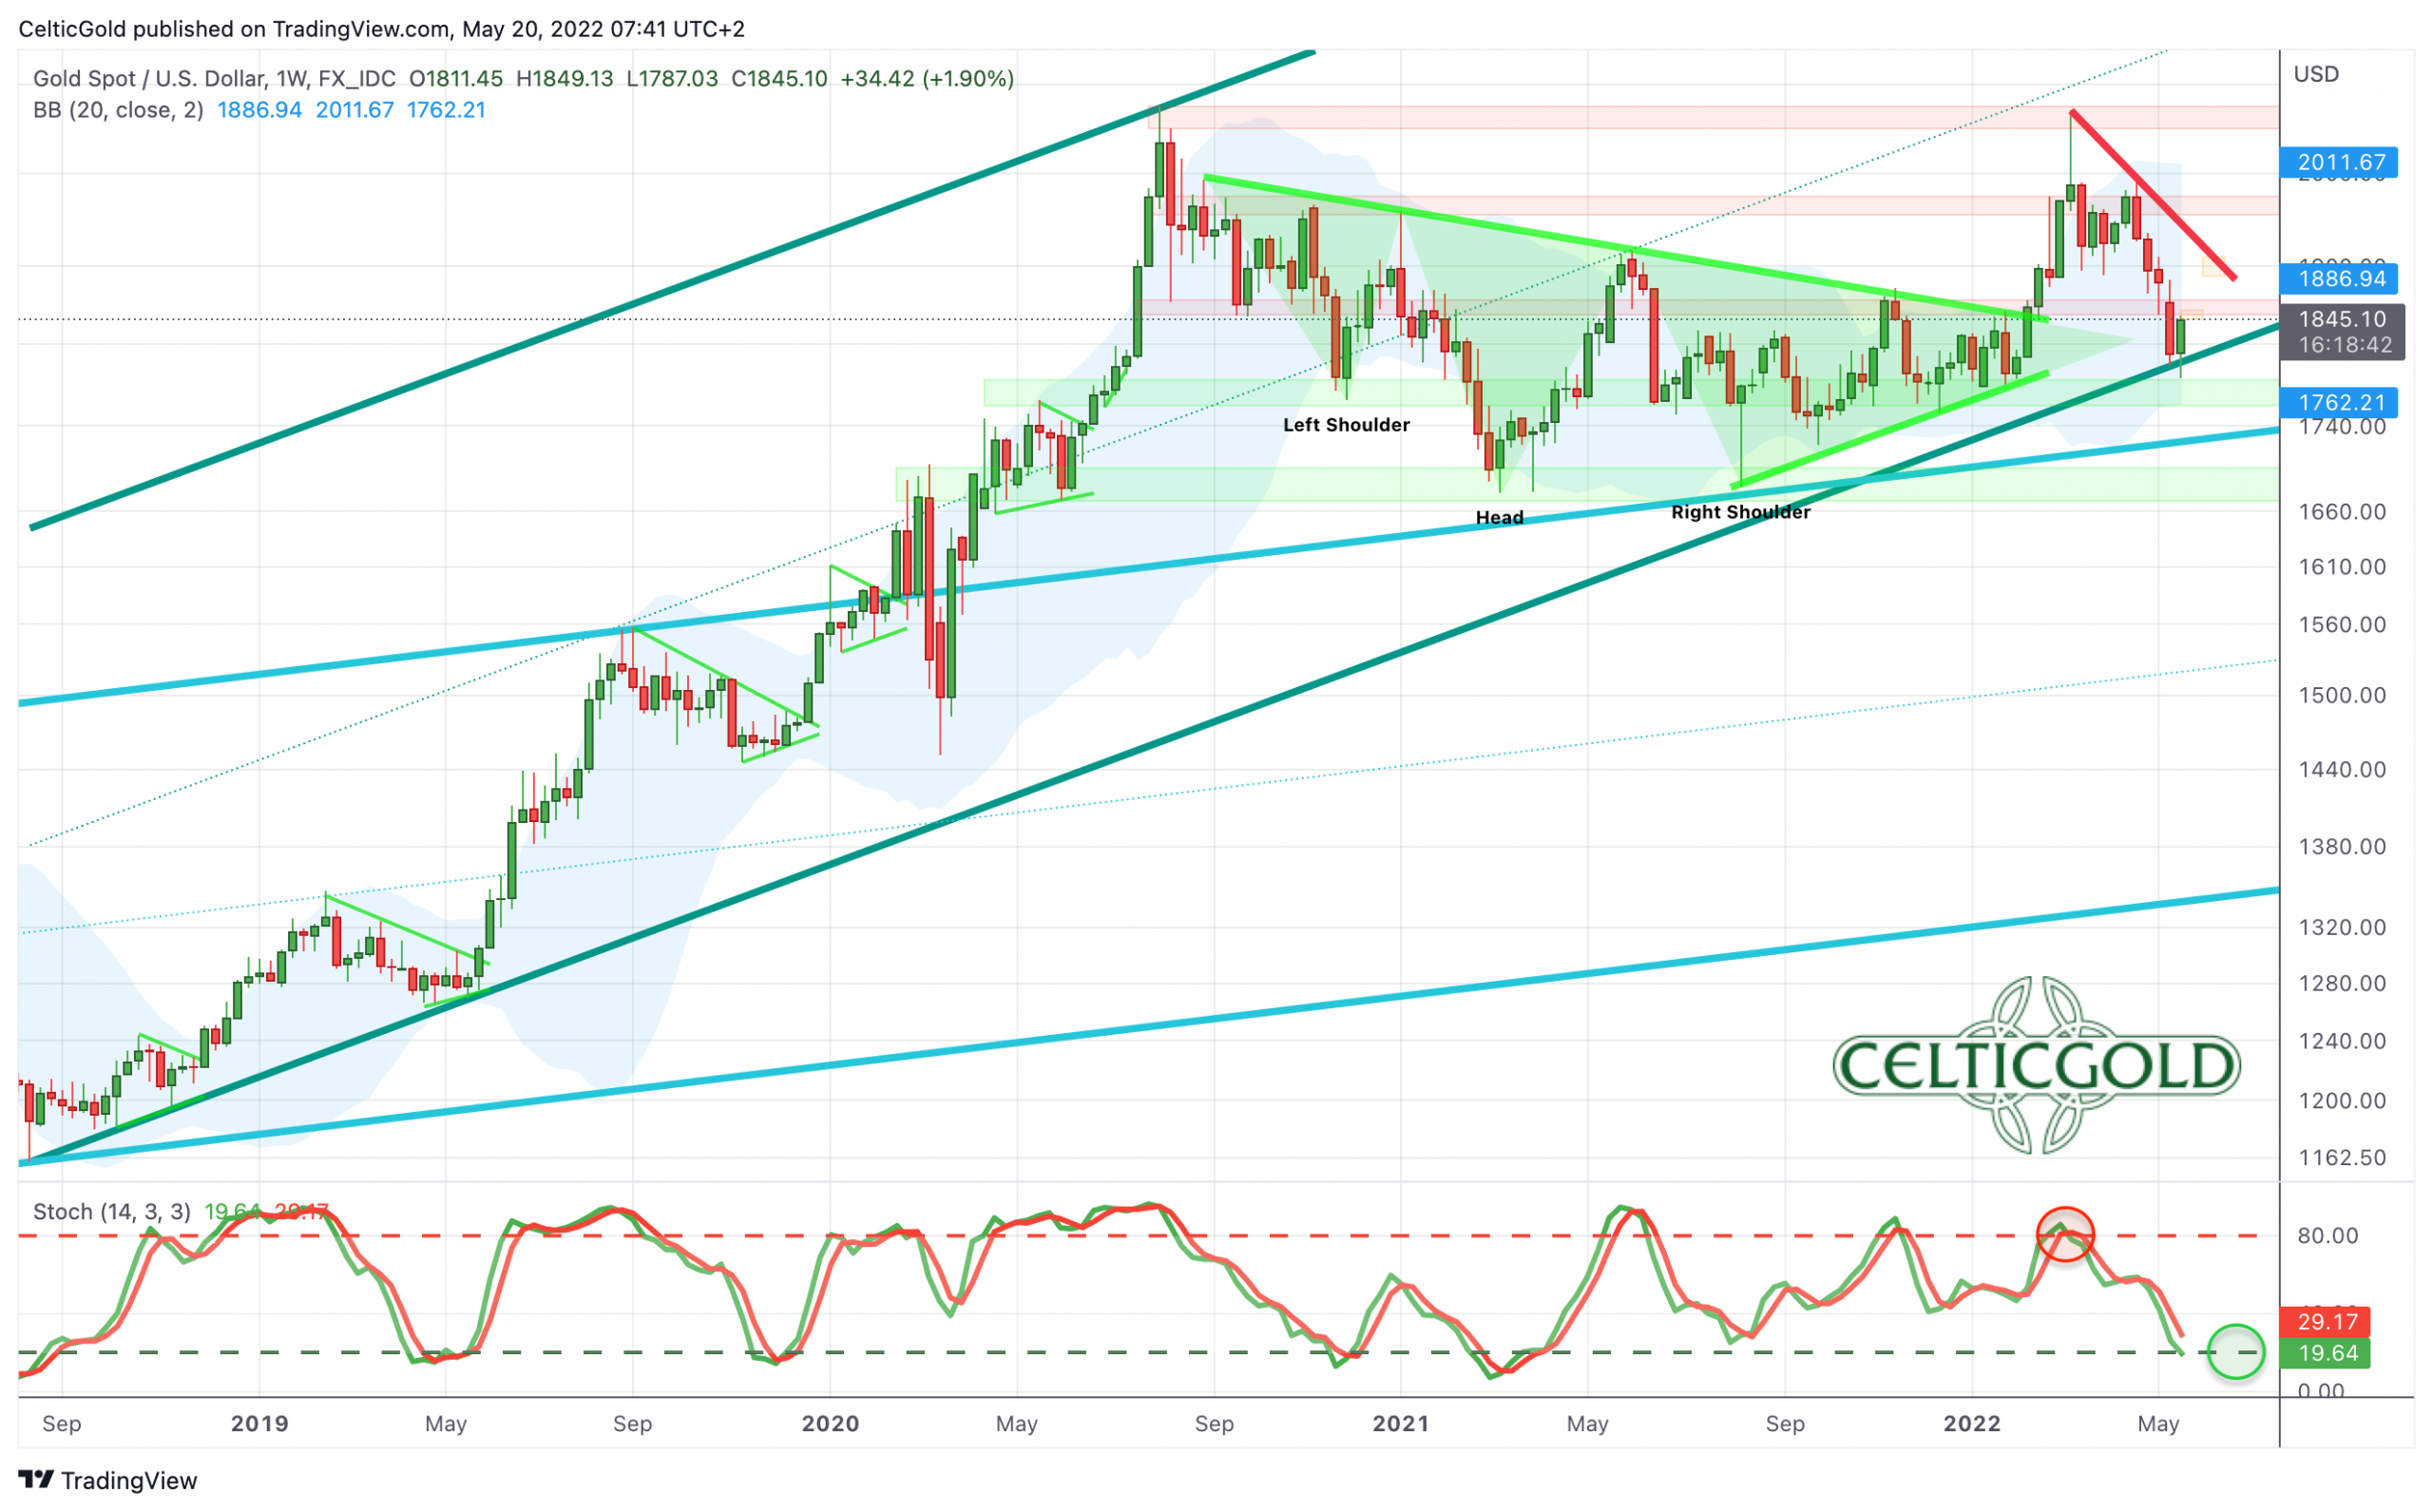
Gold in US-Dollars, weekly chart as of May 20th, 2022. Source: Tradingview
On the weekly chart, the sharp pullback over the last weeks has led to a reunion with the long-term uptrend line. This supporting uptrend line originated in August 2018 and has now been approached again for the first time since May 2019. Moreover, since gold has mostly oscillated around the US$1,800 mark over the past thirteen months, the bears are encountering very solid support here. On top, the weekly stochastic has also reached its oversold zone. The probabilities that gold continues to correct directly further to the south in terms of price are therefore rather low. A bottom formation including a first bounce seems to have higher probabilities.
Nevertheless, the technical picture has been damaged. The double top around US$2,075 and US$2,070 could well have initiated an even deeper correction. However, and if at all, this should unfold only in the medium term and could lead to gold prices correcting further to around US$1,740.
On the other hand, as the bulls seem to use the support around US$1,800 for a sizable bounce, a first resistance zone on the weekly chart is waiting around approx. US$1,850. Above that, the downtrend line of the last two and a half months is waiting in the area around US$1,900.
All in all, the weekly chart is still bearish. However, initial stabilization tendencies indicate that the US$1,800 mark will hold for the time being on a weekly closing price basis and that gold has started a bounce. However, the medium-term picture for gold only brightens up significantly with prices above US$1,920.
Daily Chart – Stochastic with a new buying signal
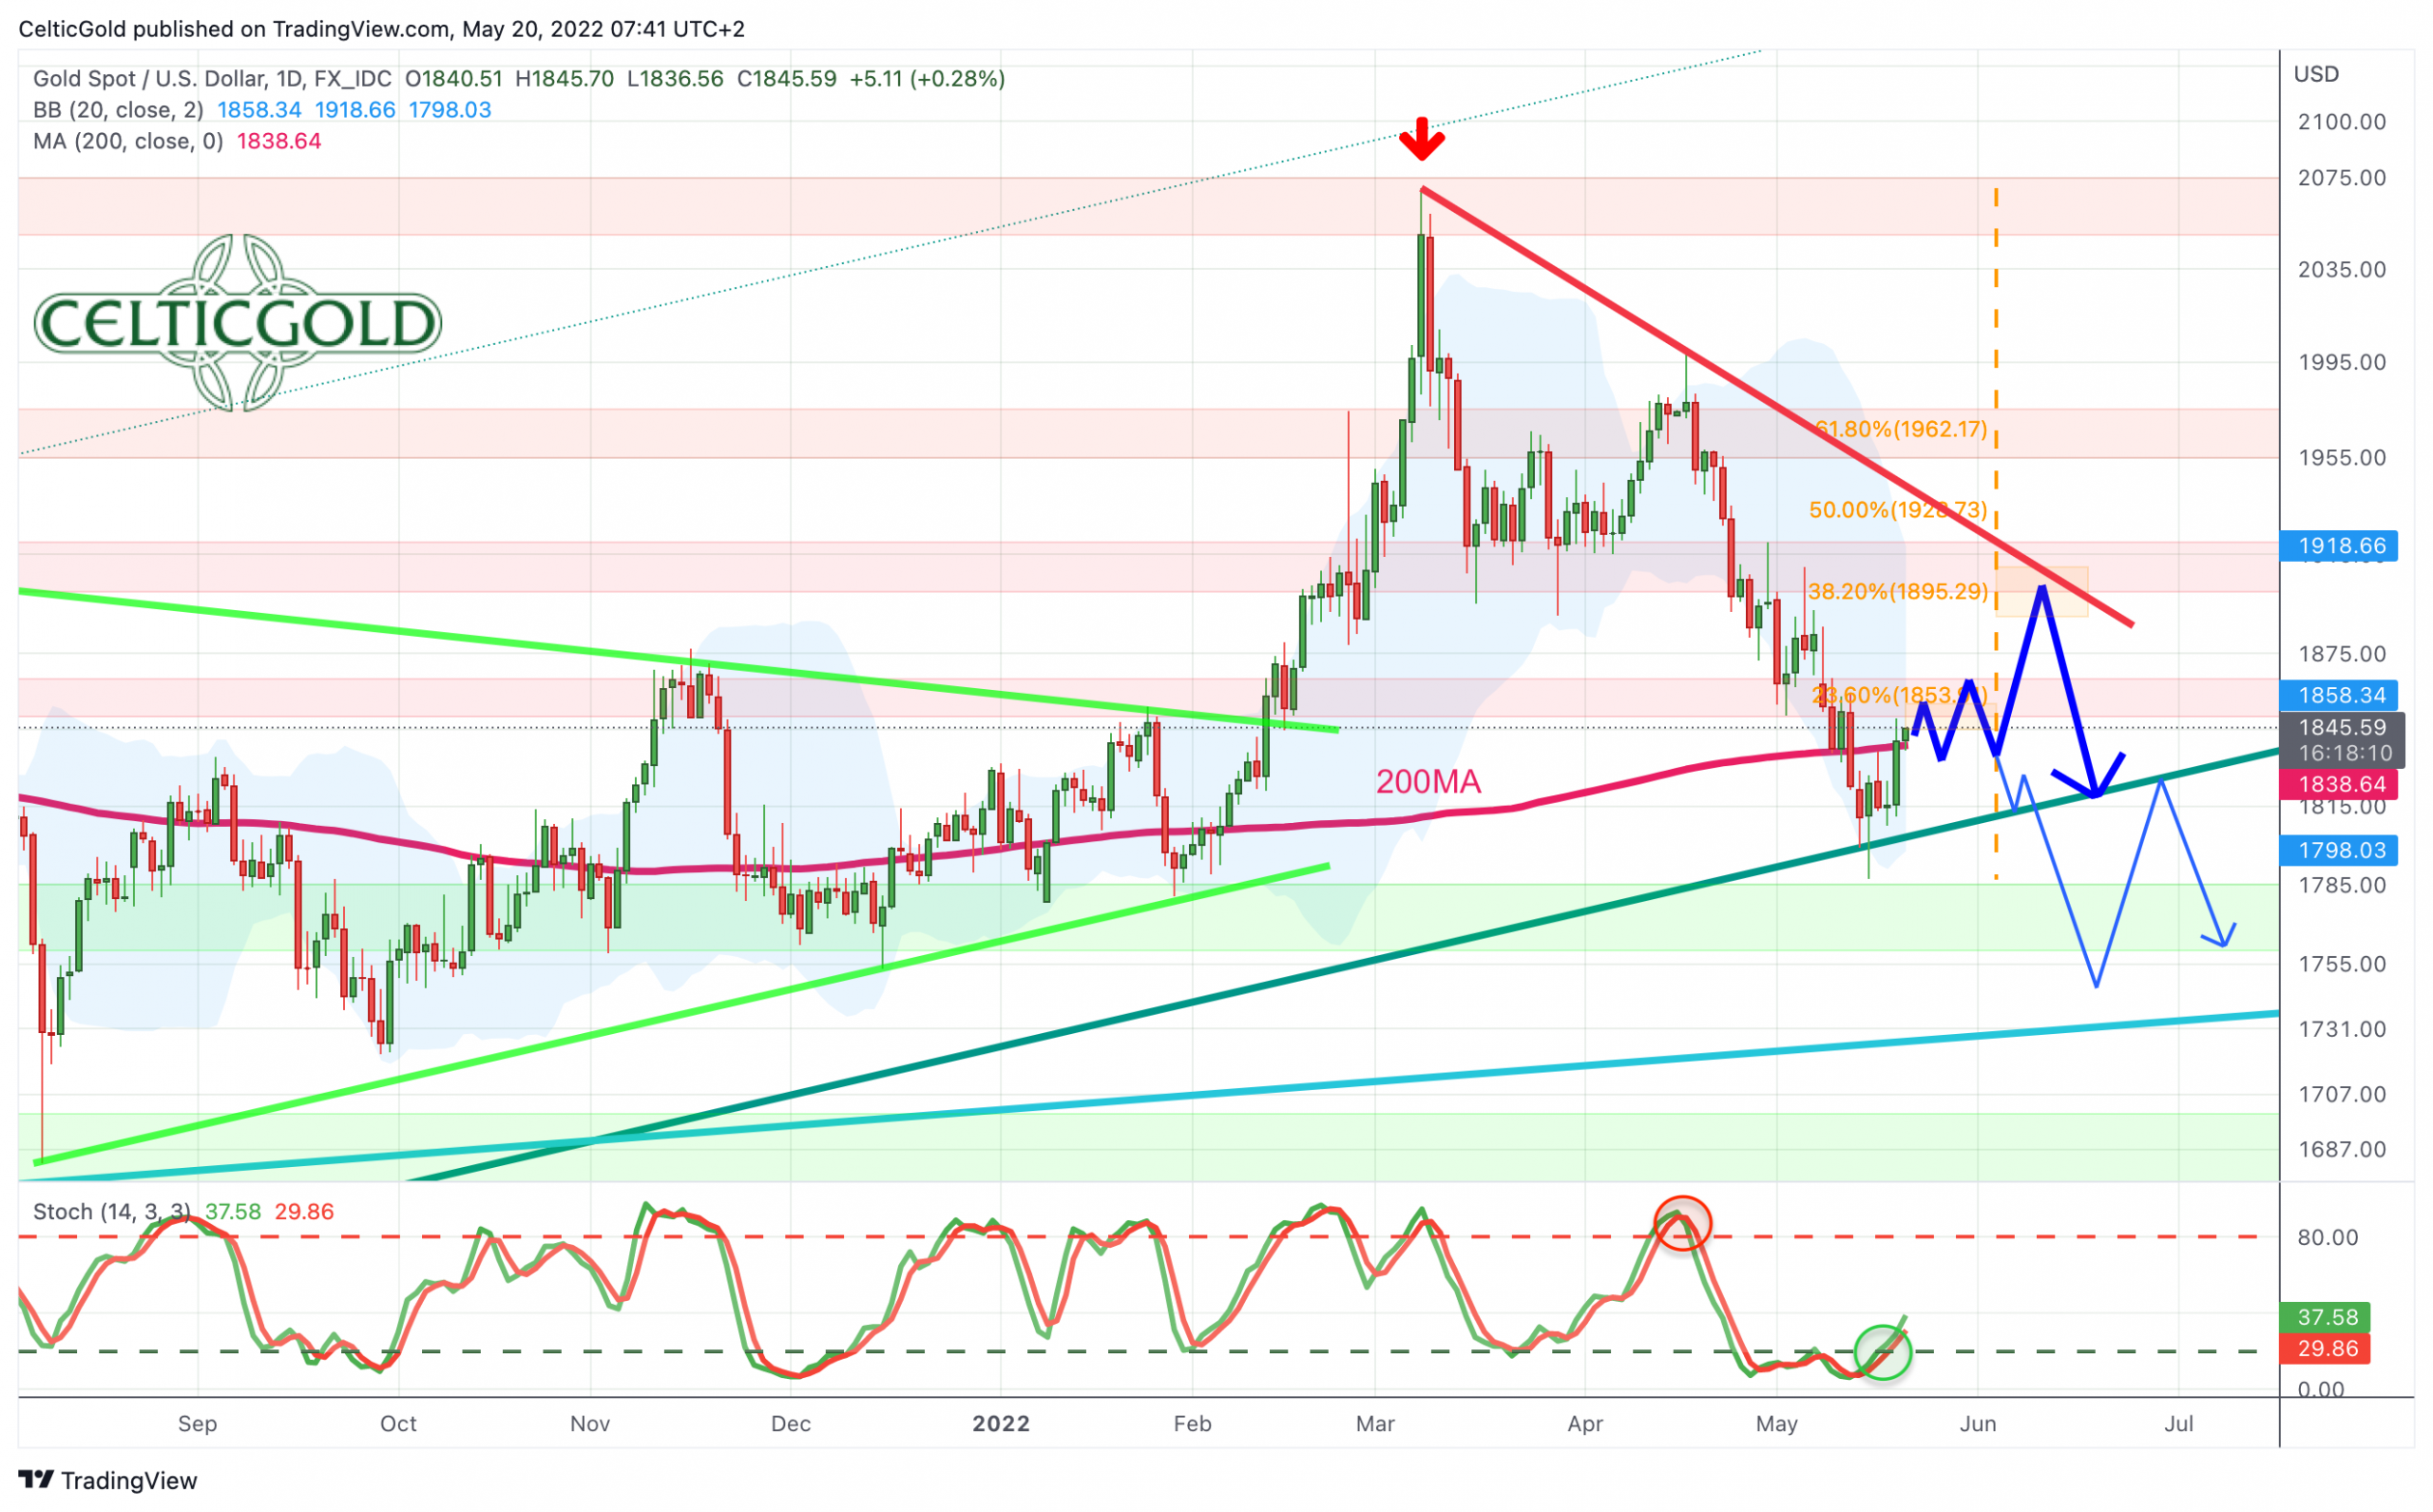
Gold in US-Dollars, daily chart as of May 20th, 2022. Source: Tradingview
On the daily chart, a first reversal occurred last Friday, which, however, was immediately negated with a new low (US$1,787) the following Monday. Since this new low, however, gold so far has rallied more than US$50 and generated a first small series of higher lows and higher highs. In particular, the stochastic oscillator has freed itself from the bearish embeddedness and now convinces with a new buying signal. Above the 200-day moving average (US$1,838), there would be room to approx. US$1,850 to US$1,855 in the short term.
However, the current market environment can end the ambitions of the bulls at any time. In addition, gold usually stands better on two legs better. Hence, even if a major bounce to around US$1,900 would unfold now, we have to expect at least another pullback towards around US$1,835 and somewhat lower by midsummer.
Overall, the daily chart has switched to bullish and thus opens up the chance for a recovery to at least US$1,855. In the best case, a run to around US$1,900 is also conceivable. However, not much more can be forecasted in the current market environment until midsummer. A daily closing price below US$1,800, on the other hand, would already mark the end of the recovery and activate further downside potential in the direction of around US$1,740.
Commitments of Traders for Gold – First signs of stabilization
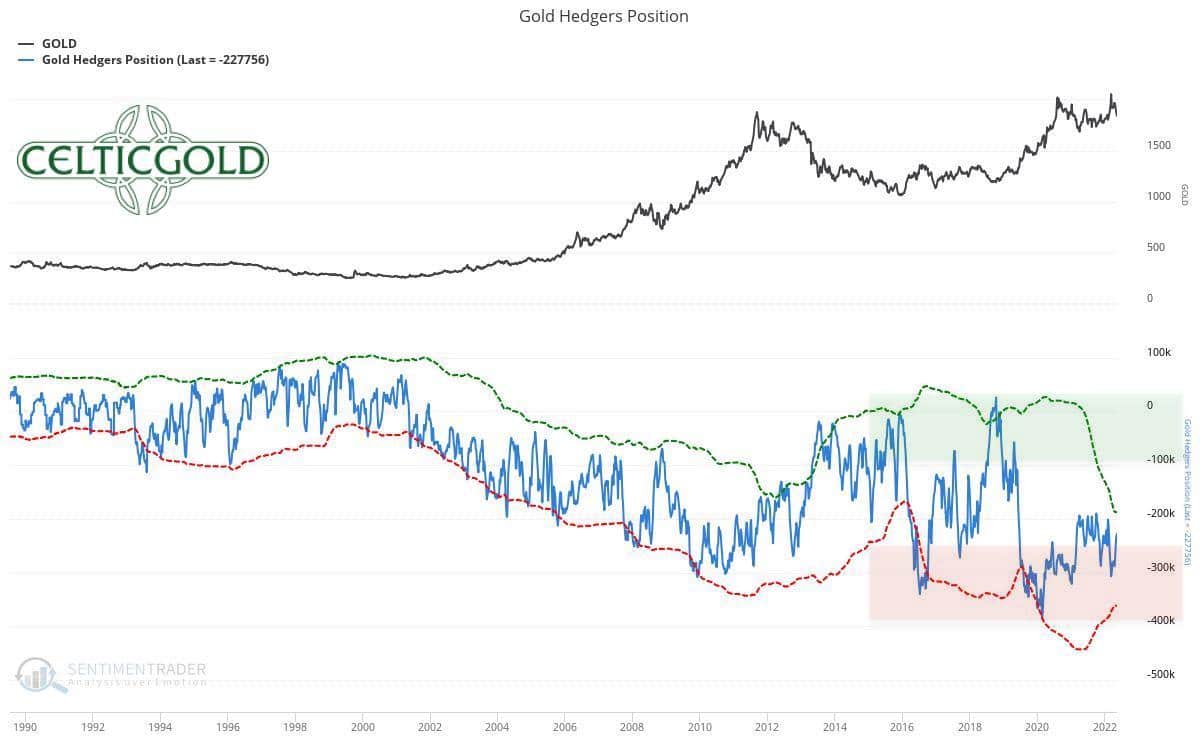
Commitments of Traders for Gold as of May 18th, 2022. Source: Sentimentrader
The commercial net short position in the gold futures market has improved significantly to “only” 227,756 contracts sold short due to the significant correction in the gold market. In a long-term comparison, however, this constellation still does not provide a contrarian buy signal. Up to an ideal contrarian bottleneck, this short position would have to be at least halved again. Obviously, this will only be possible via lower gold prices.
In summary, the CoT report therefore still provides a sell signal, albeit an increasingly weaker one. Only below a commercial short position of cumulated 100,000 contracts or fewer, the futures market would be more or less cleared. In August 2018, for example, commercial market participants were actually “long” in aggregate for the first time in 25 years. As a result, the gold price was able to rally from US$1,160 to US$2,070 within just two years.
Sentiment for Gold – First signs of stabilization
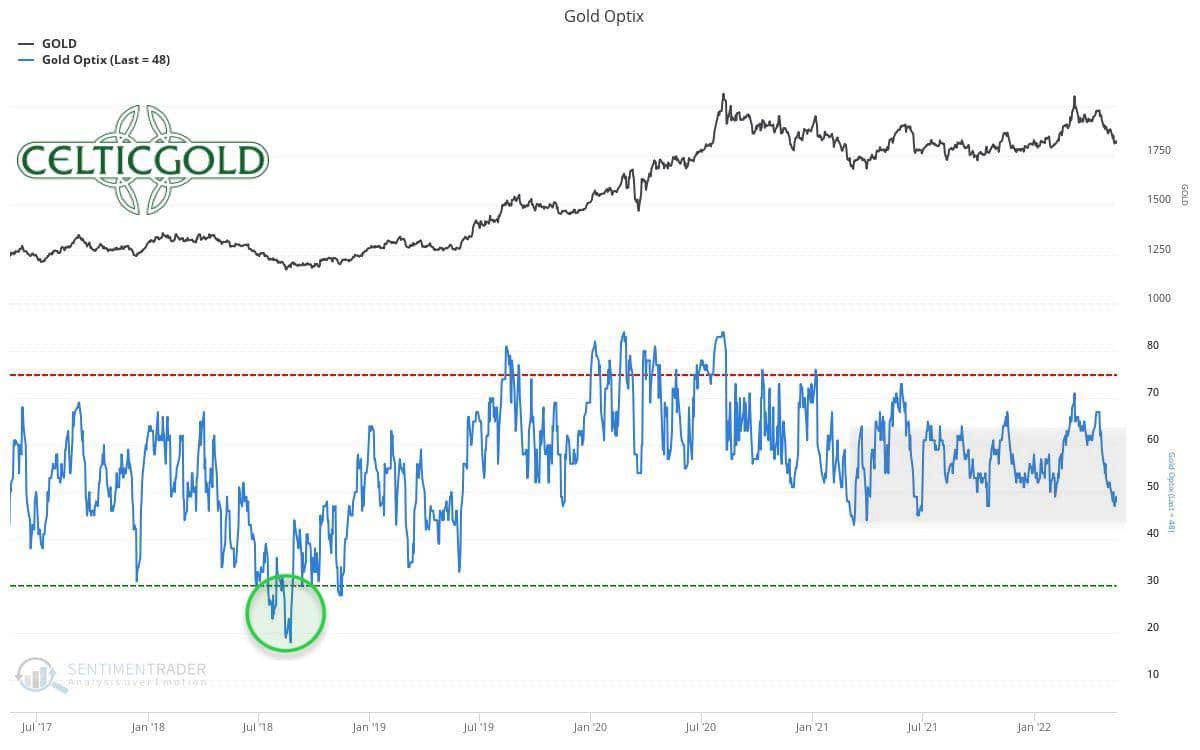
Sentiment Optix for Gold as of May 18th, 2022. Source: Sentimentrader
There is no doubt that the mood in the financial markets is currently very depressed. Panic and a “giving up” sentiment are going hand in hand. In the gold market, sentiment has fallen to its lowest level since August 2021. However, one cannot (yet) speak of a real panic. Here, too, it is worth recalling August 2018, when the Sentiment Optix for gold fell to its lowest level since 2001, with values well below 20. Currently, this Sentiment Optix is quoted at 48 sitting rather in a neutral position.
Therefore, sentiment for gold remains at neutral.
Seasonality for Gold – First signs of stabilization
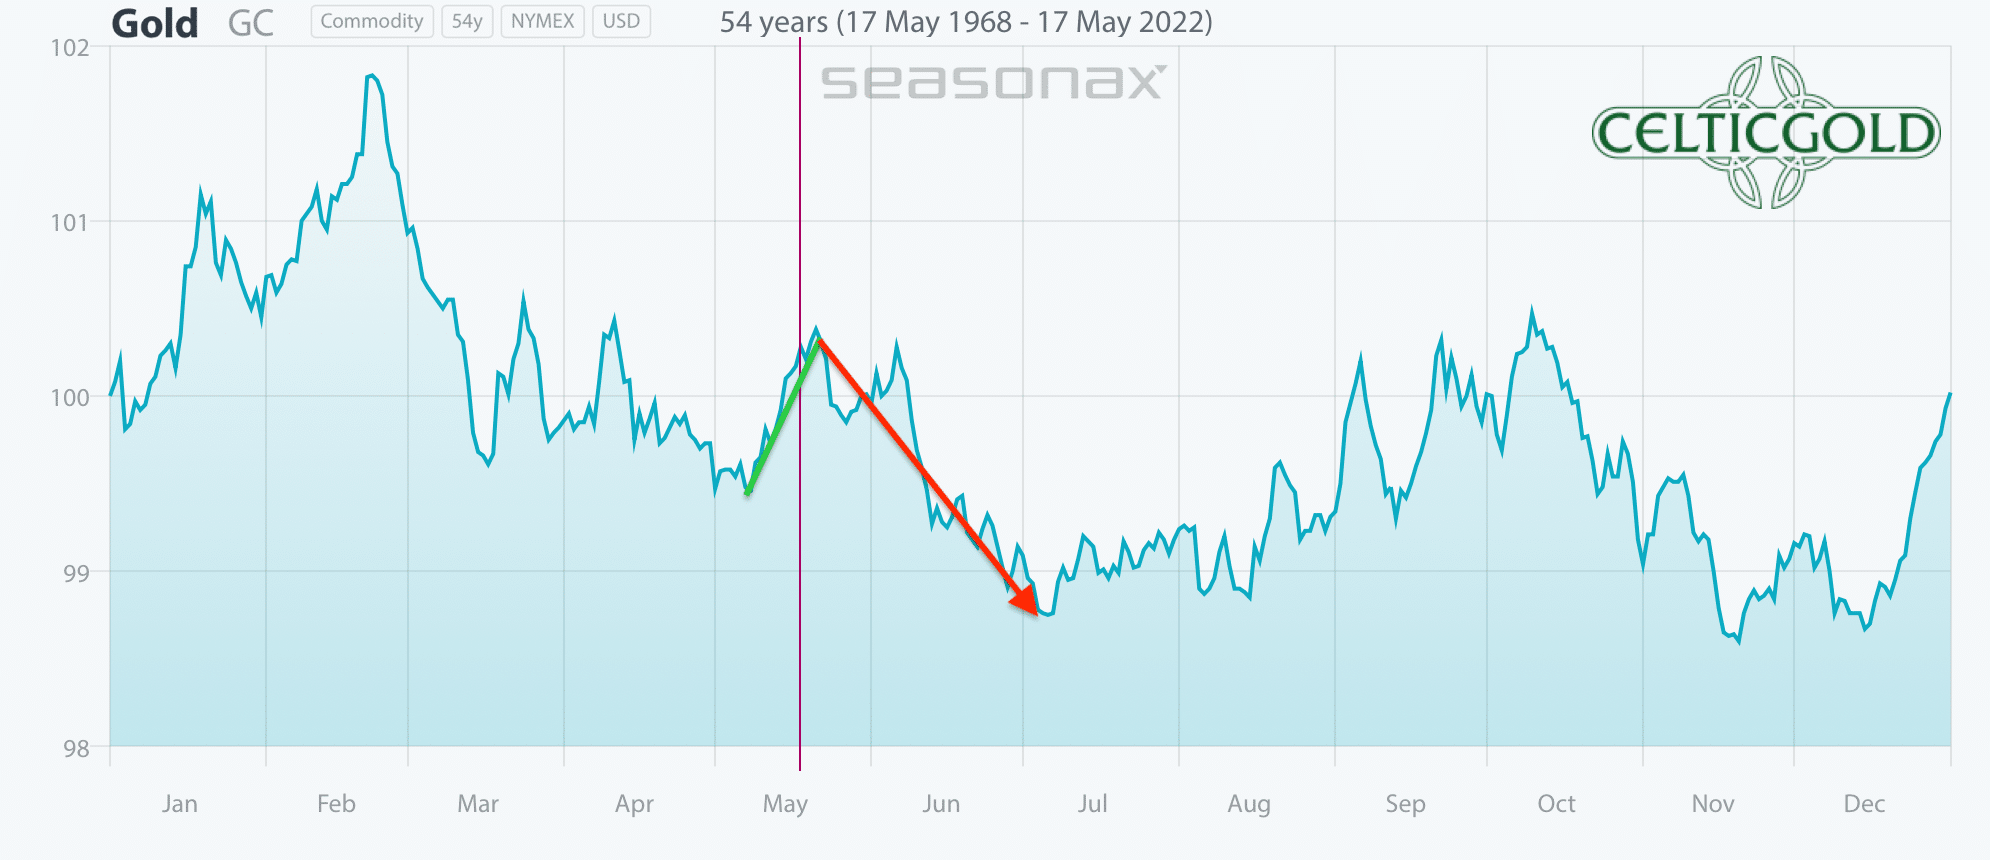
Seasonality for Gold over the last 53-years as of May 18th, 2022. Source: Sentimentrader
The seasonal component continues to be unfavorable for gold at this point. Although statistically there is often a temporary recovery or small bounce in May, sustainable rallies were extremely rare in the past. Only from July or August onwards, seasonality changes back to green. Until then, patience, caution and restraint are the best recommendations for gold bugs.
In summary, from a seasonal perspective, the gold market probably still has two to three rather difficult months ahead of it. From mid-August, however, one should be fully positioned again.
Macro update:
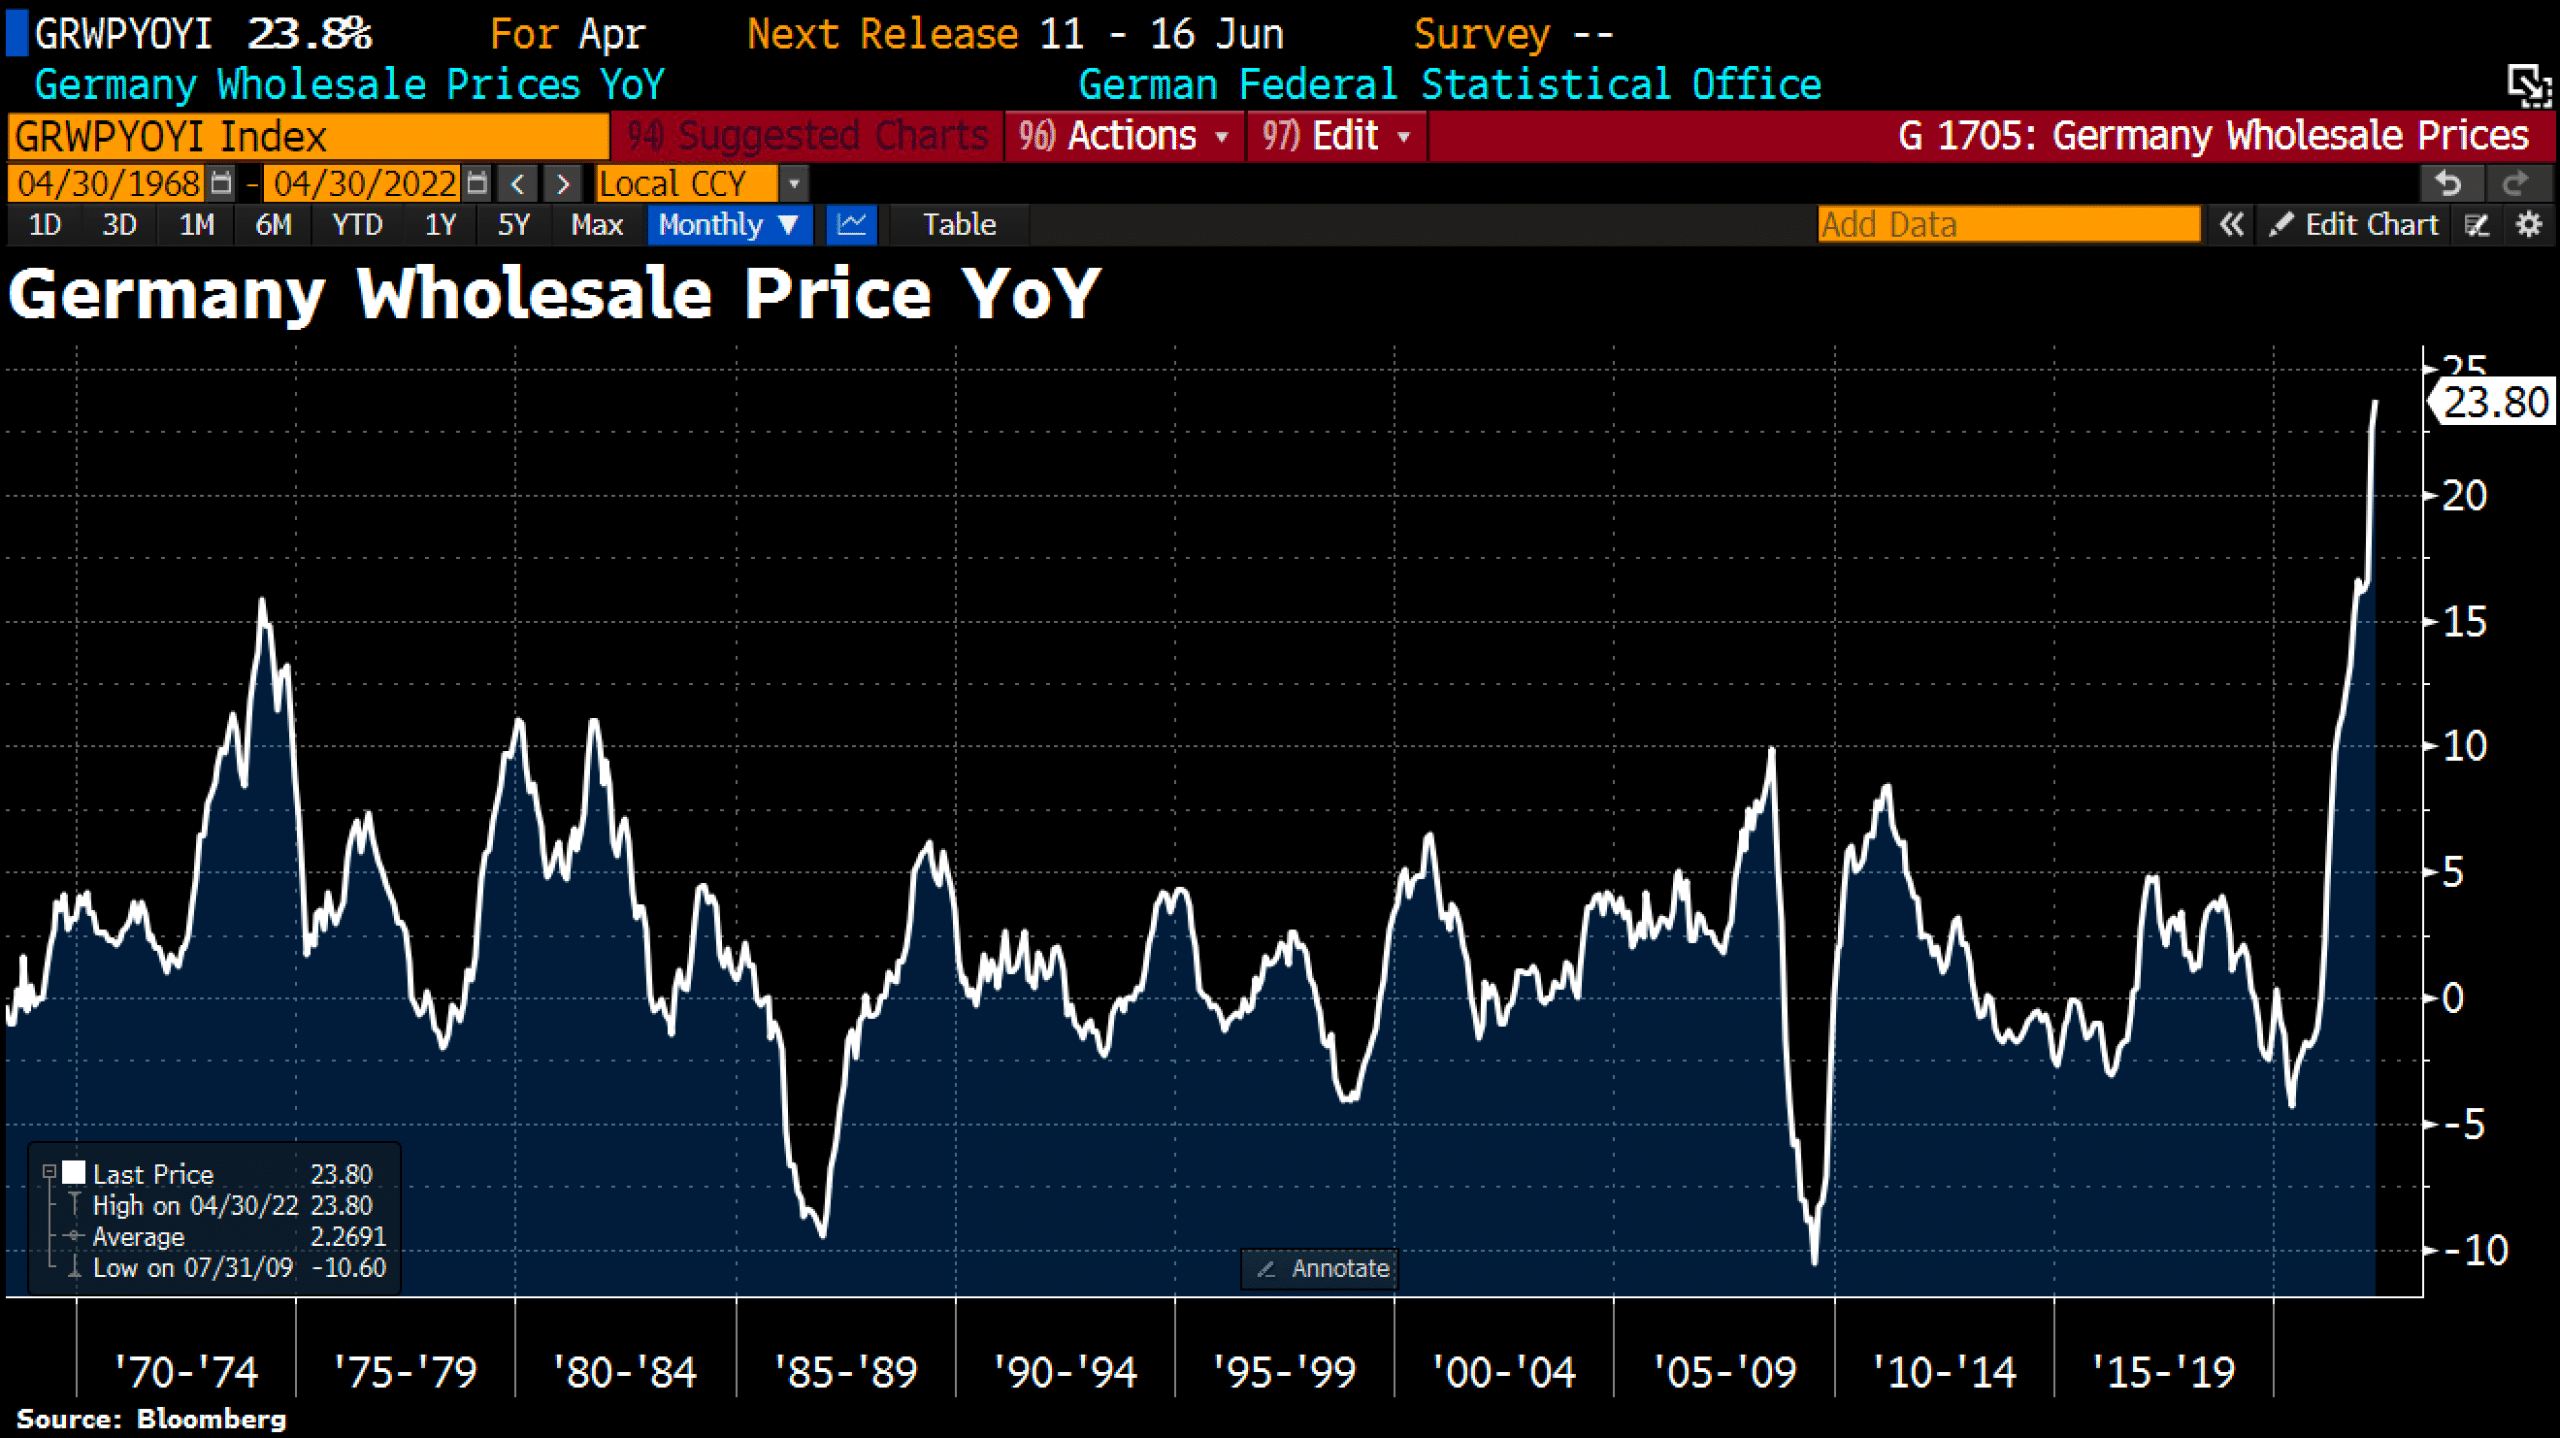
German wholesale prices as of May 16th, 2022 ©Holger Zschaepitz
In Germany, wholesale prices jumped by 23.8% year-on-year in April. This is the highest annual rate of change since wholesale price indexes began being calculated in 1962. These wholesale prices are driven mainly by raw materials and commodity prices, as well as intermediate goods.
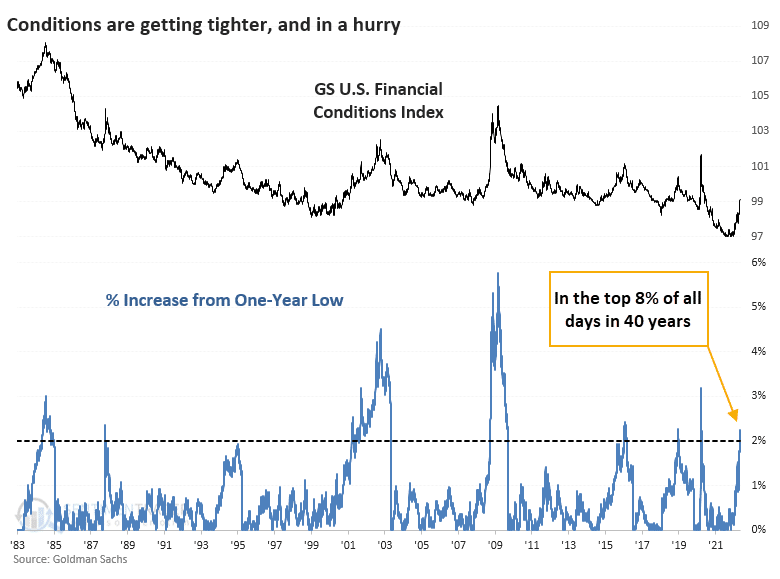
Financial conditions tighten, from May 9, 2022. ©Sentimentrader
In the fight against high inflation, the FED therefore wants to continue its extreme and never-before-seen tightening of monetary policy. As a result, financial markets worldwide have already been under tremendous pressure for months, while the U.S. dollar index recently rose to its highest level since January 2003. However, the collapsing stock markets due to the sharp rise in interest rates are slowly but surely destroying demand. At the same time, de-globalization as well as the geopolitical drama in Ukraine and the still constrained supply chains continue to provide inflationary pressure. The hopefully soon ending lockdown in China, on the other hand, is strongly deflationary. Presumably, the FED will have to at least pause its so-called “quantitative tightening” after June in order to not completely destroy the economy.
In the further course of the year, we can therefore assume that the Fed will again change course in the direction of quantitative easing. As a result, the battered stock markets are likely to recover significantly from early summer or, at the latest, in fall. For the precious metals sector, the end of monetary tightening would be even more bullish. Until that happens, however, things are likely to remain dangerous and uncomfortable in the financial markets. Nevertheless, gold should be one of the first to start pricing in the monetary policy change in the coming months.
Conclusion: Gold – First signs of stabilization
First signs of stabilization can currently be seen in the gold market. This could certainly lead to a somewhat larger recovery. However, as seasonality remains unfavorable until July/August, we currently do not expect a sustainable recovery rally. Prices around US$1,855 seem realistic, while a rally to around US$1,900 would be very optimistic already. The probability of a merely intermediary recovery within the larger correction is also high in view of the difficult situation in financial markets. This bearish scenario is activated with a daily close below US$1,800.
To conclude, an overly bullish expectation is unlikely to pay off, at least until midsummer. However, from August onwards, the start of a new multi-month uptrend in the precious metals sector would be conceivable.
Analysis initially published on May 19th, 2022, by www.celticgold.de. Translated into English and partially updated on May 20th, 2022.
Feel free to join us in our free Telegram channel for daily real time data and a great community. If you like to get regular updates on our gold model, precious metals and cryptocurrencies you can also subscribe to our free newsletter.
Disclosure: This article and the content are for informational purposes only and do not contain investment advice or recommendations. Every investment and trading move involves risk, and readers should conduct their own research when making a decision. The views, thoughts and opinions expressed here are the author’s alone. They do not necessarily reflect or represent the views and opinions of Midas Touch Consulting.

