


Bitcoin – Risk-Off dominates all markets
While we extended our holidays until end of April, markets have becoming severely under pressure in recent weeks. Not only the stock-market, which is in a correction and probably in a bear market since mid of last November already, but also and especially the bond markets are making negative headlines these days. A liquidity crunch is in the air. Accordingly, Bitcoin has been weak and also paints a picture of a bear market. Bitcoin – Risk-Off dominates all markets.
Review
Since the crash low on January 24th, 2022, at US$32,950, bitcoin, and thus the entire crypto sector in general, have been striving to recover. However, this recovery has been rather slow over the past three months and was mainly characterized by a confusing back-and-forth. It was not until mid-March that the bulls were able to spark a bit more momentum on the upside. In the process, bitcoin reached pretty much exactly its 200-day moving average (currently $47,623) at $48,234. From the January low, this represented a recovery of a around 46% within two months.
However, the reunion with its 200-day moving average ended in a bitter disappointment for bitcoin, as it was followed by a sharp sell-off to a low of US$37,700 on April 26th. With this, bitcoin has fallen deep back into its bottoming zone from January and February and is currently trading far away from its all-time high at US$69,000.
The bond markets are imploding
In addition to the corrective structure that has been intact since the all-time high on November 10th,2021 (crypto winter), the sharp rise in interest rates caused massive stress and distortions in all market sectors in recent weeks.
Accordingly, the resulting increasing “risk-off attitude” among market participants is having a particularly strong impact on the crypto sector. An end to this stress is not in sight, but could instead gain further momentum in the coming months regardless of any interim countertrend movements.
Technical Analysis For Bitcoin in US-Dollar
Bitcoin Weekly Chart – Questionable recovery
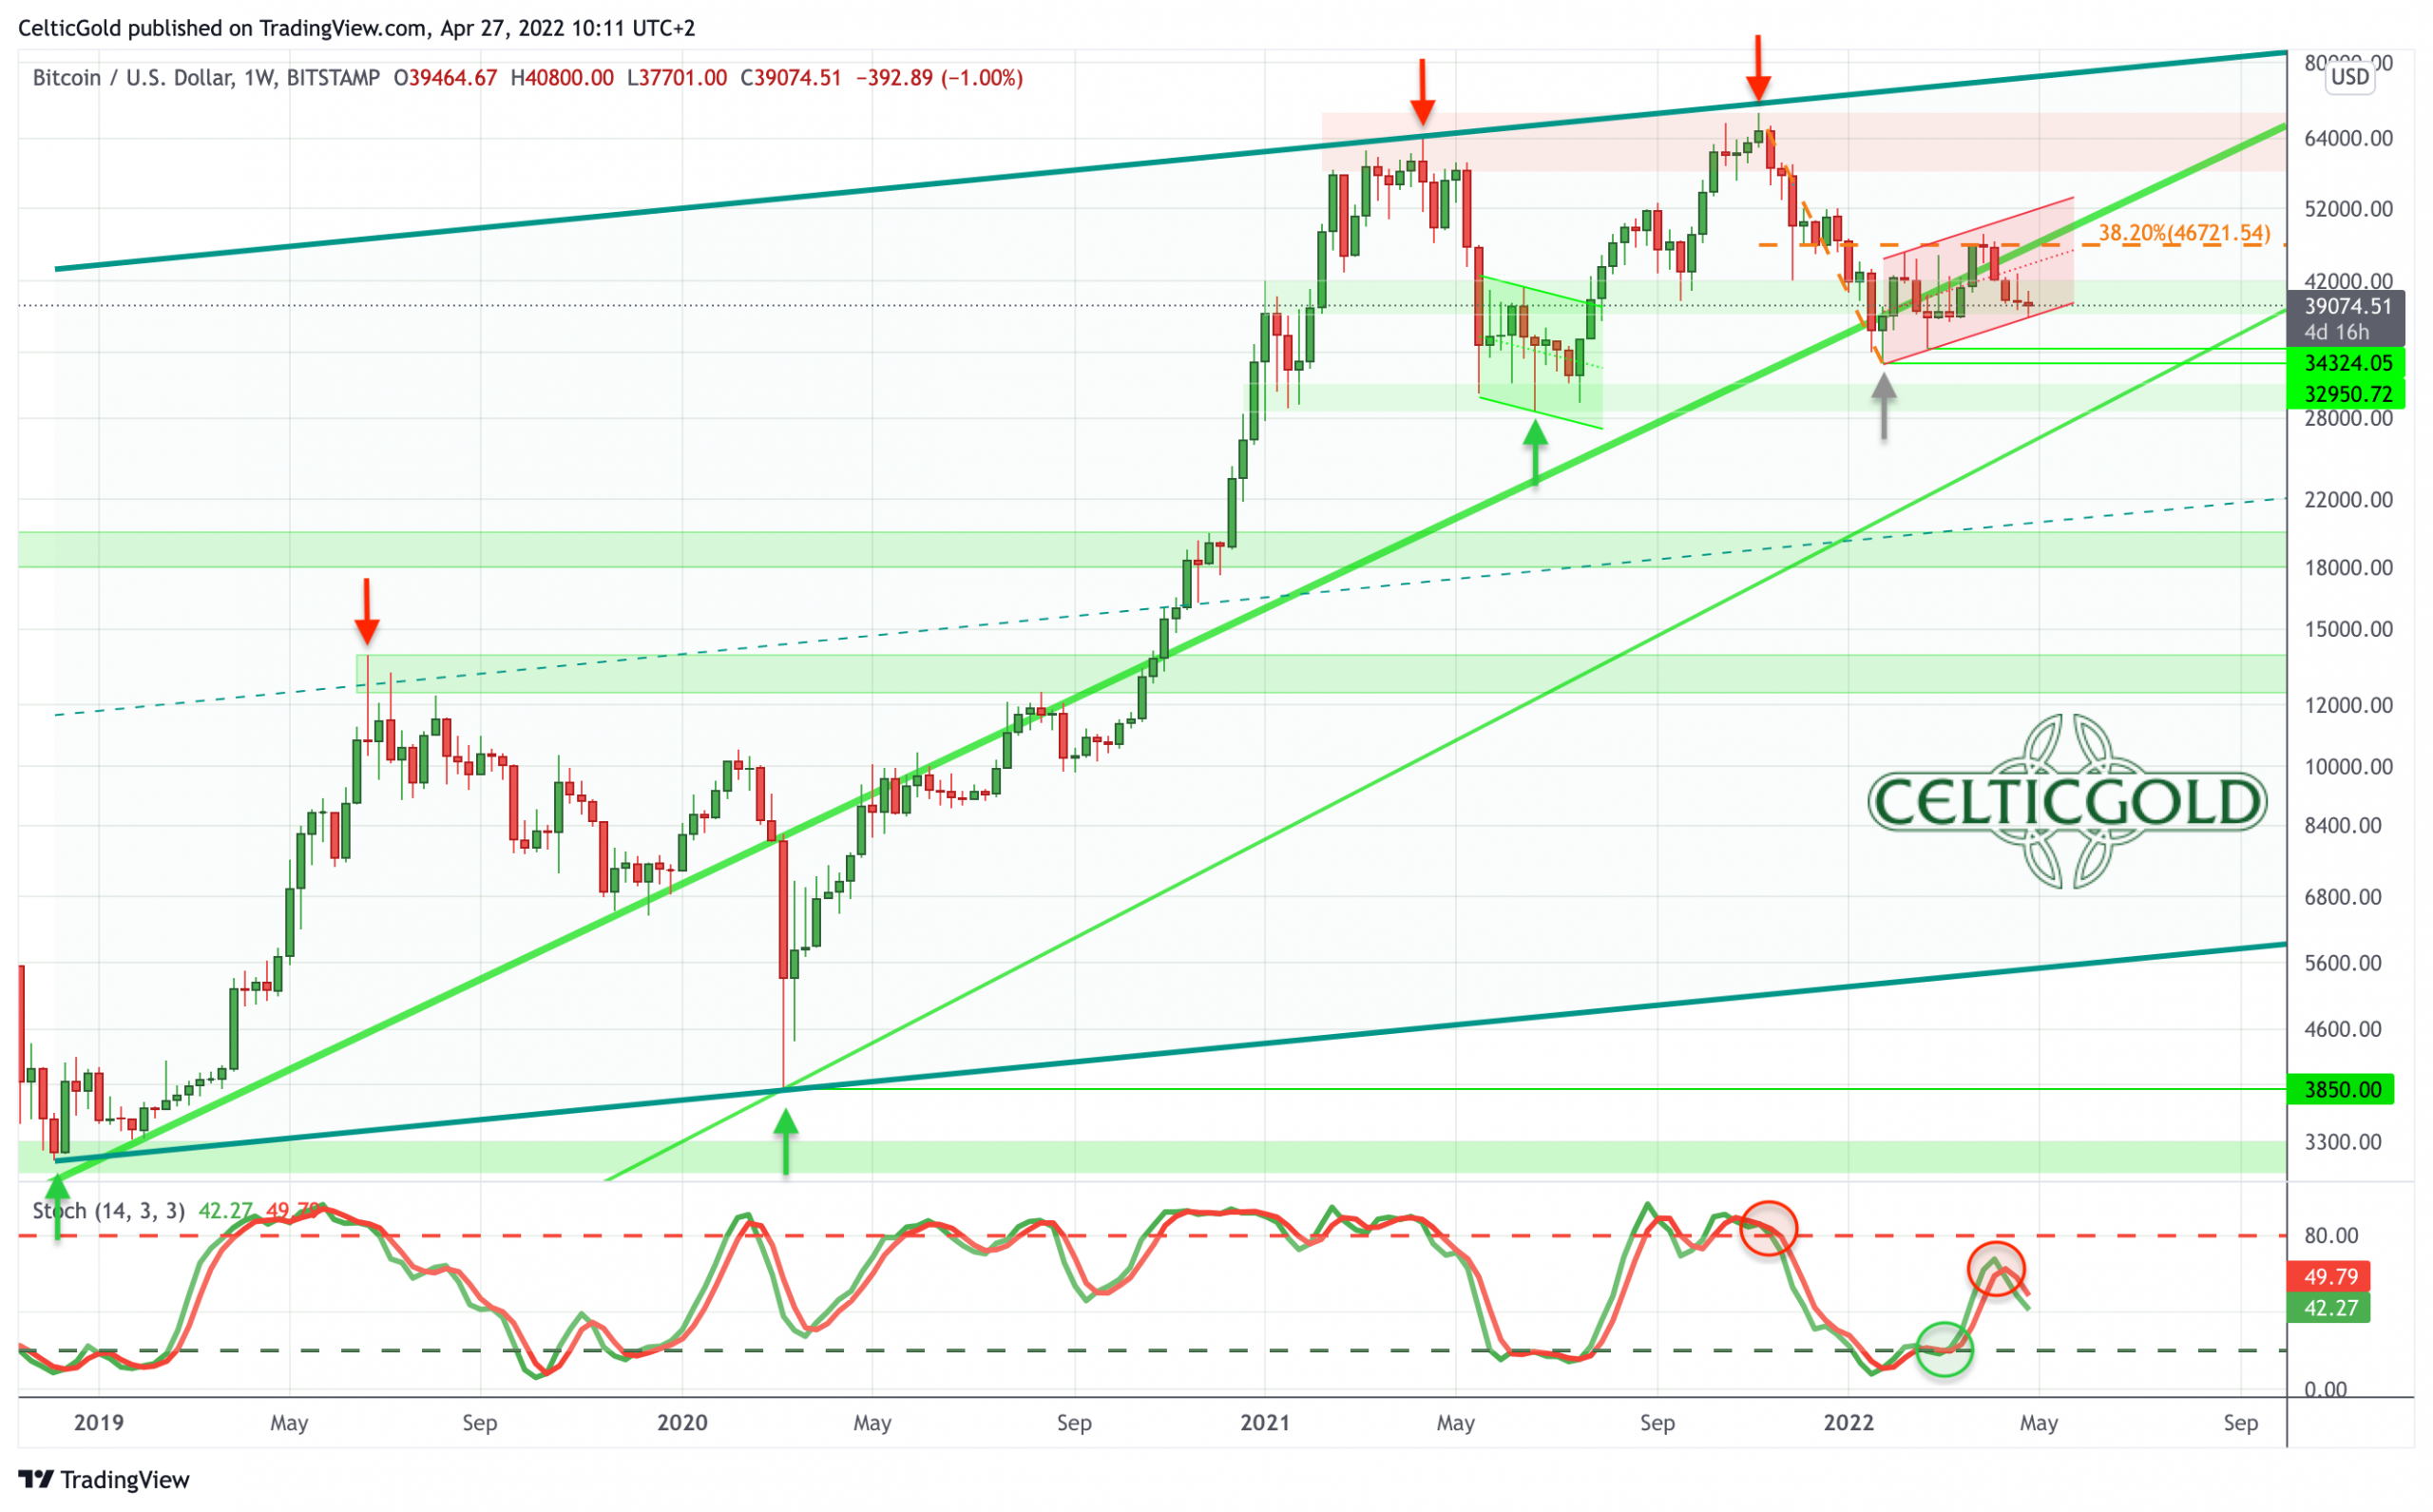
Bitcoin in USD, weekly chart as of April 27th, 2022. Source: Tradingview
Since the double top at US$65,000 and US$69,000 and the subsequent crash down to US$32,950, bitcoin has been slow to get back on its feet. The recovery since the end of January has been in a flat uptrend channel, which can be classified as a kind of bearish flag. The recovery to just above US$48,000 failed exactly at the 38.2% Fibonacci retracement and clearly signals weakness. The recent sell signal on the weekly stochastics confirms this.
If bitcoin breaks out of the flat uptrend channel to the downside, there would quickly be room to around US$30,000 USD and lower. Positive signals on the weekly chart, however, are scarce. At most, the broad support zone between approx. US$38,000 and US$42,000 should be mentioned, from which another recovery could take place at any time.
Overall, the weekly chart is bearish and clearly confirms a negative cycle. If the uptrend channel breaks, the sell-off in bitcoin and the altcoins is likely to accelerate.
Bitcoin Daily Chart – How long will the flat uptrend channel hold?
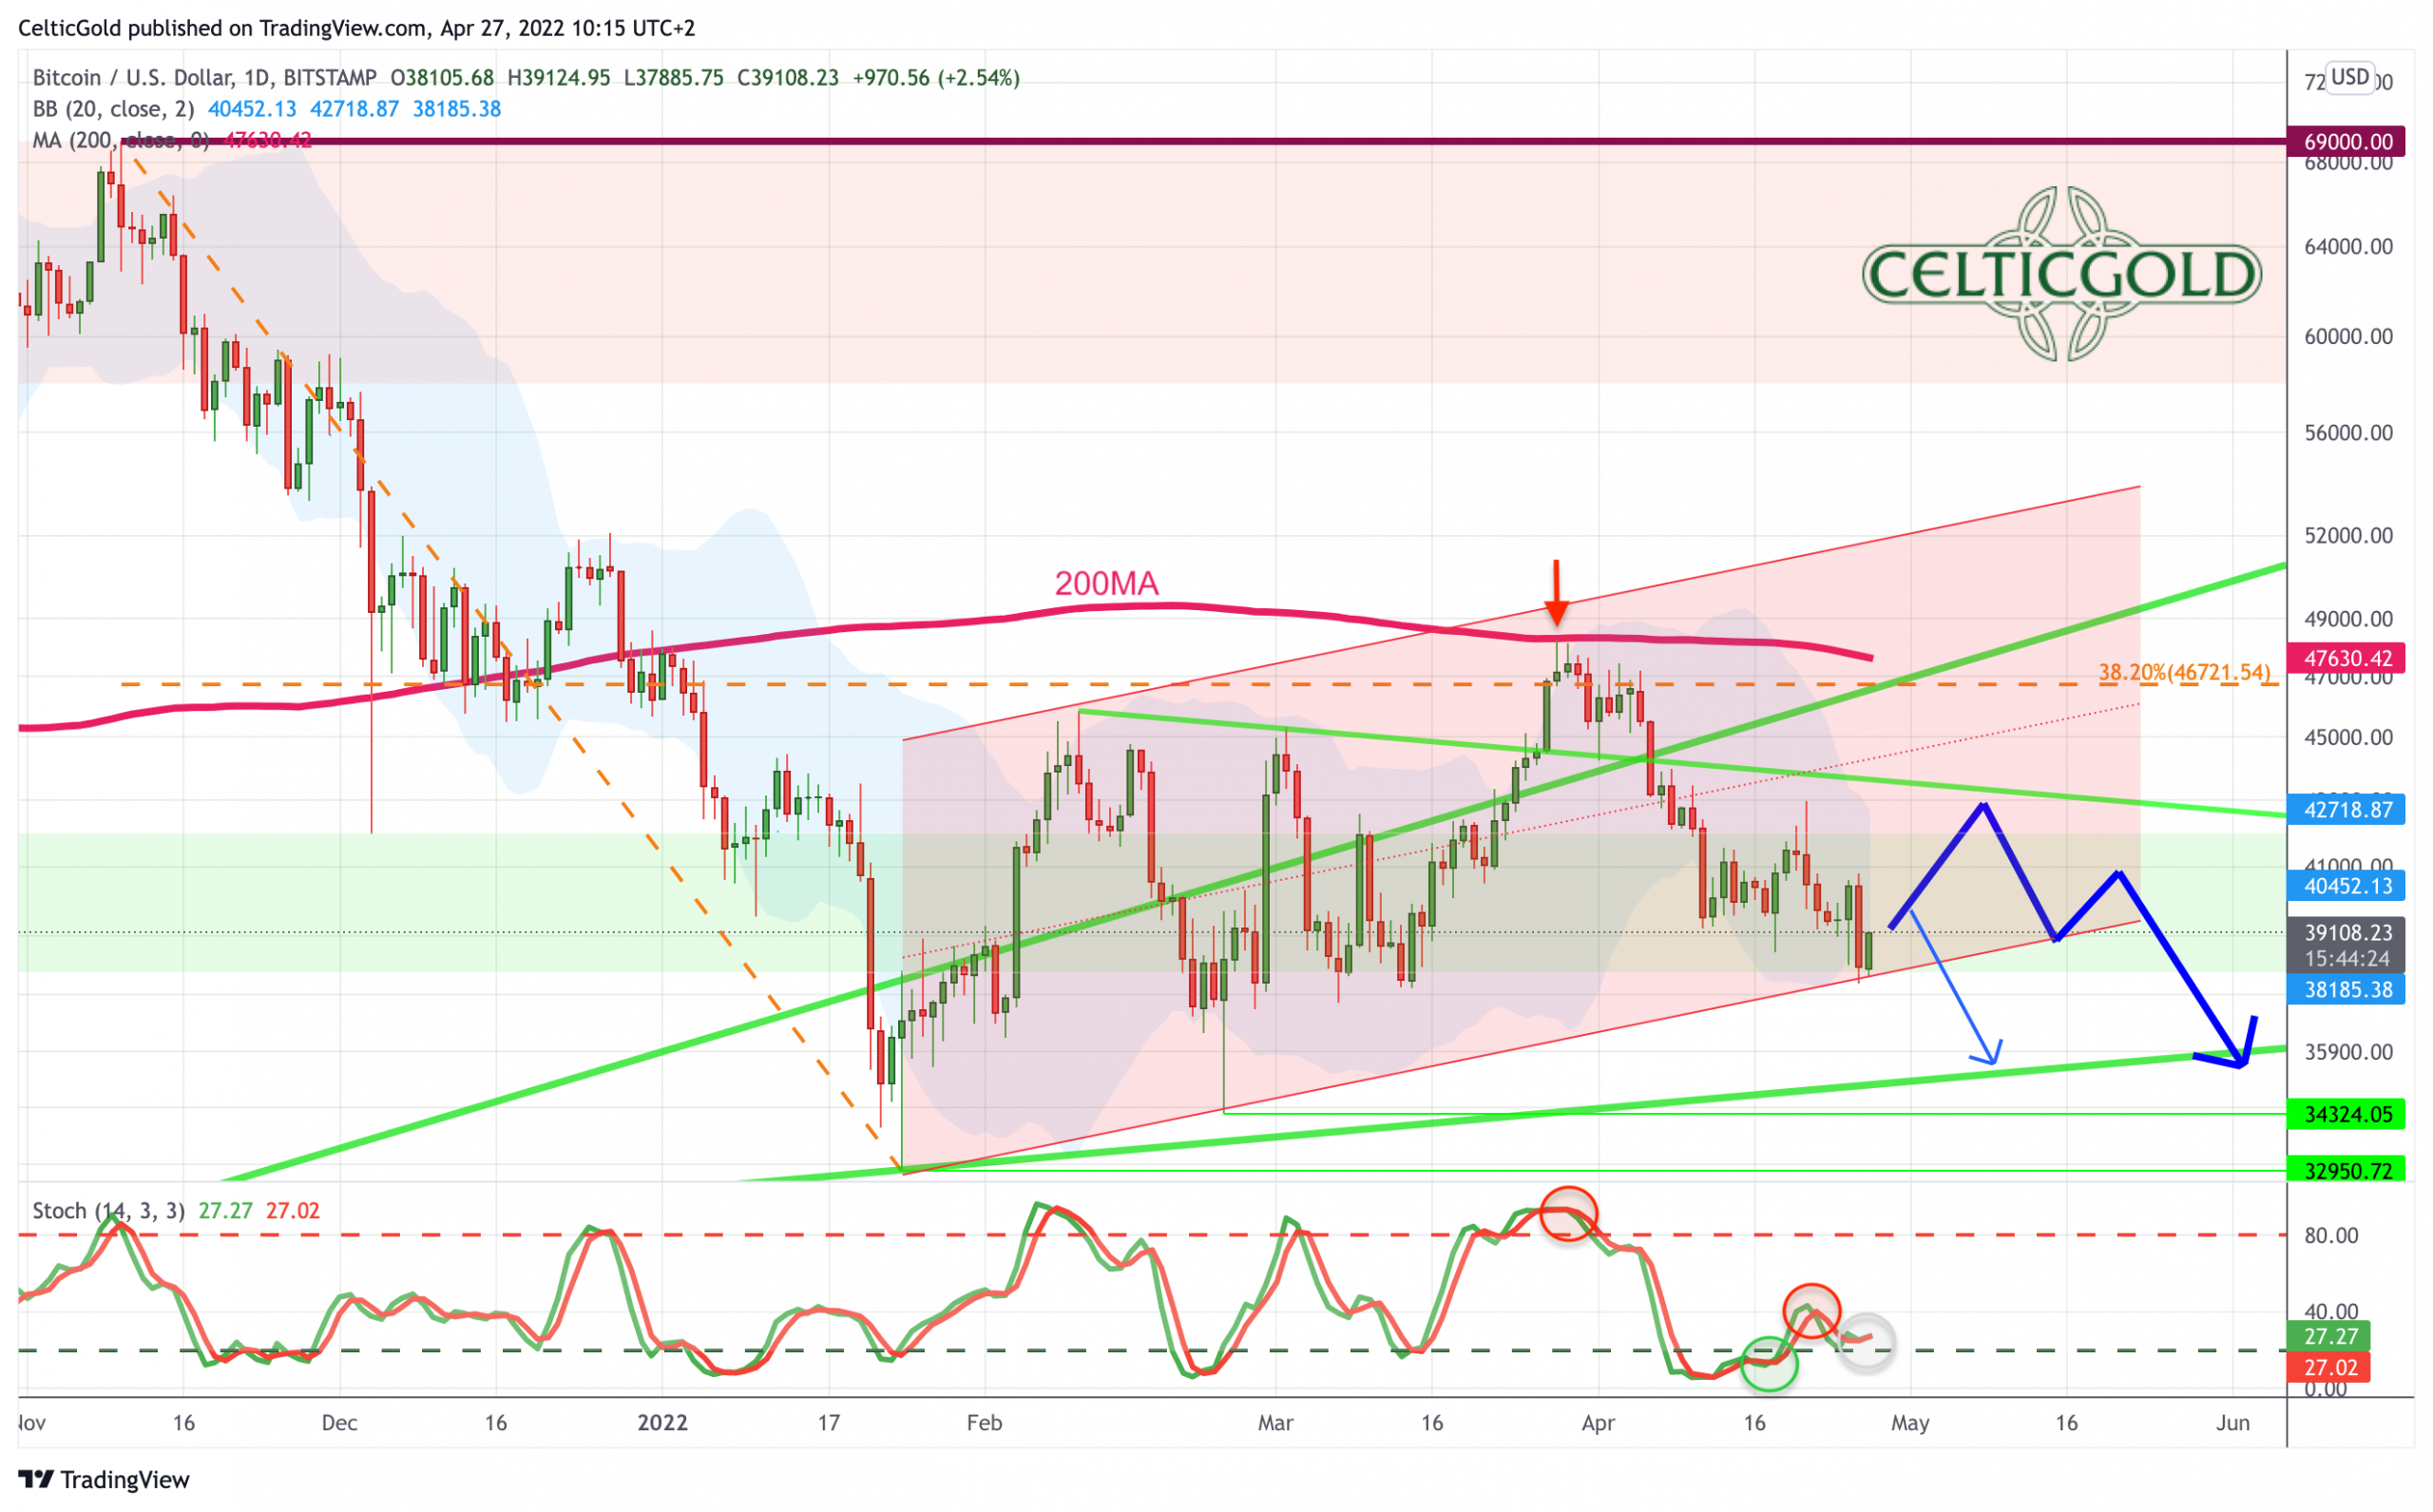
Bitcoin in USD, daily chart as of April 27th, 2022. Source: Tradingview
On the daily chart, the failure at the 200-day moving average (US$47,630) weighs heavily. In the last three weeks, bitcoin quickly lost more than US$10,000, while the bulls were not able to stage any meaningful countermovement in the meantime.
Currently, bitcoin can just barely hold within its uptrend channel. However, the set up is certainly not bullish. With the lower Bollinger Band (US$38,185), another support is also wobbling. However, should the bulls be able to use the slightly oversold situation for a bounce, there is room to about US$42,500 and at best to about US$44,200.
In summary, the daily chart is bearish, but slightly oversold. Since the mood in the crypto sector as well as overall in the financial markets is currently quite bad and slightly panicky, a surprising recovery would be quite conceivable. However, this should not change the overriding larger downtrend.
Sentiment Bitcoin – Risk-Off dominates all markets
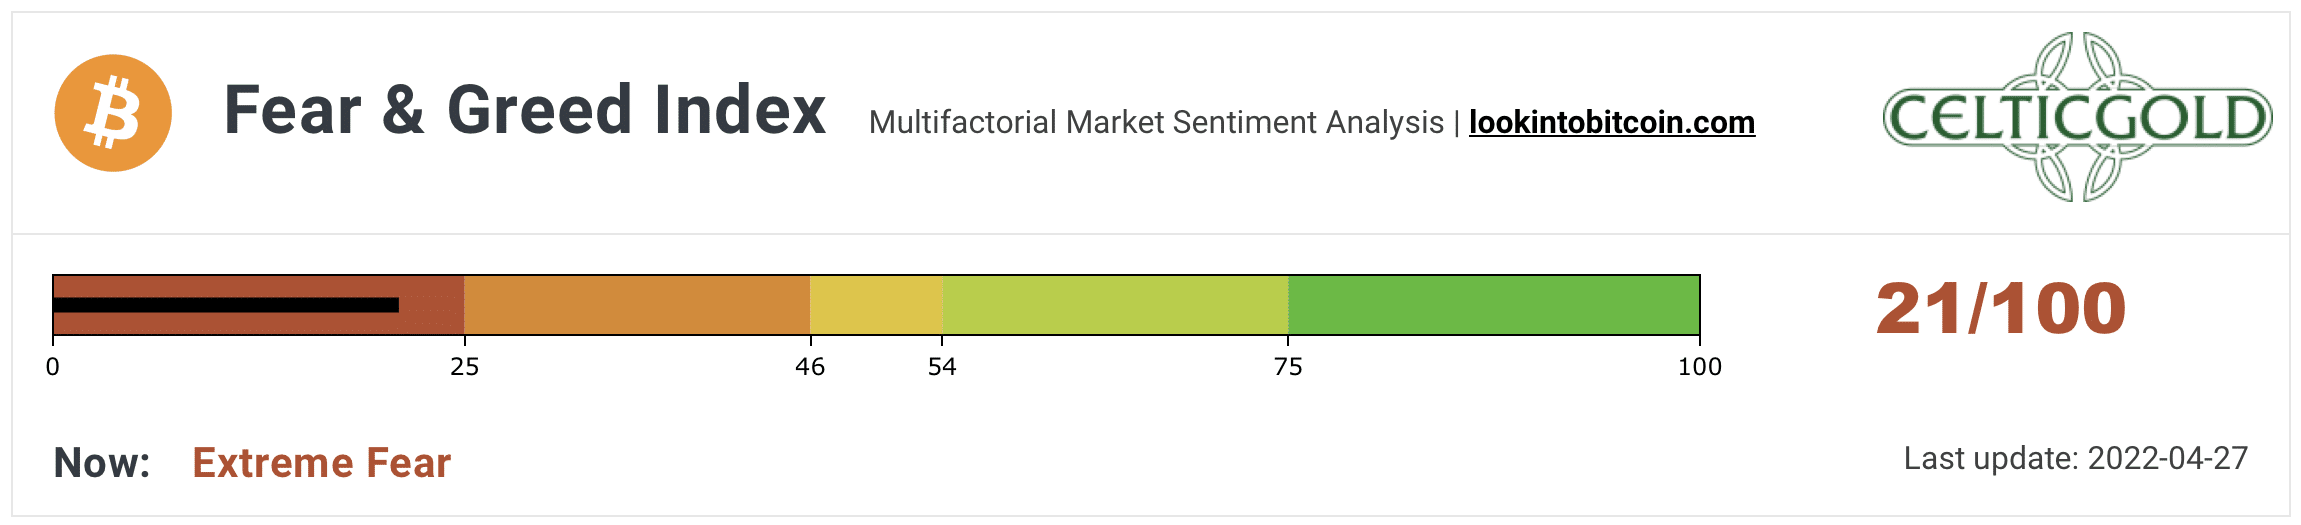
Crypto Fear & Greed Index, as of April 27th, 2022. Source: Lookintobitcoin
The Crypto Fear & Greed Index is currently at 21 out of 100 points, signaling high fear among market participants.
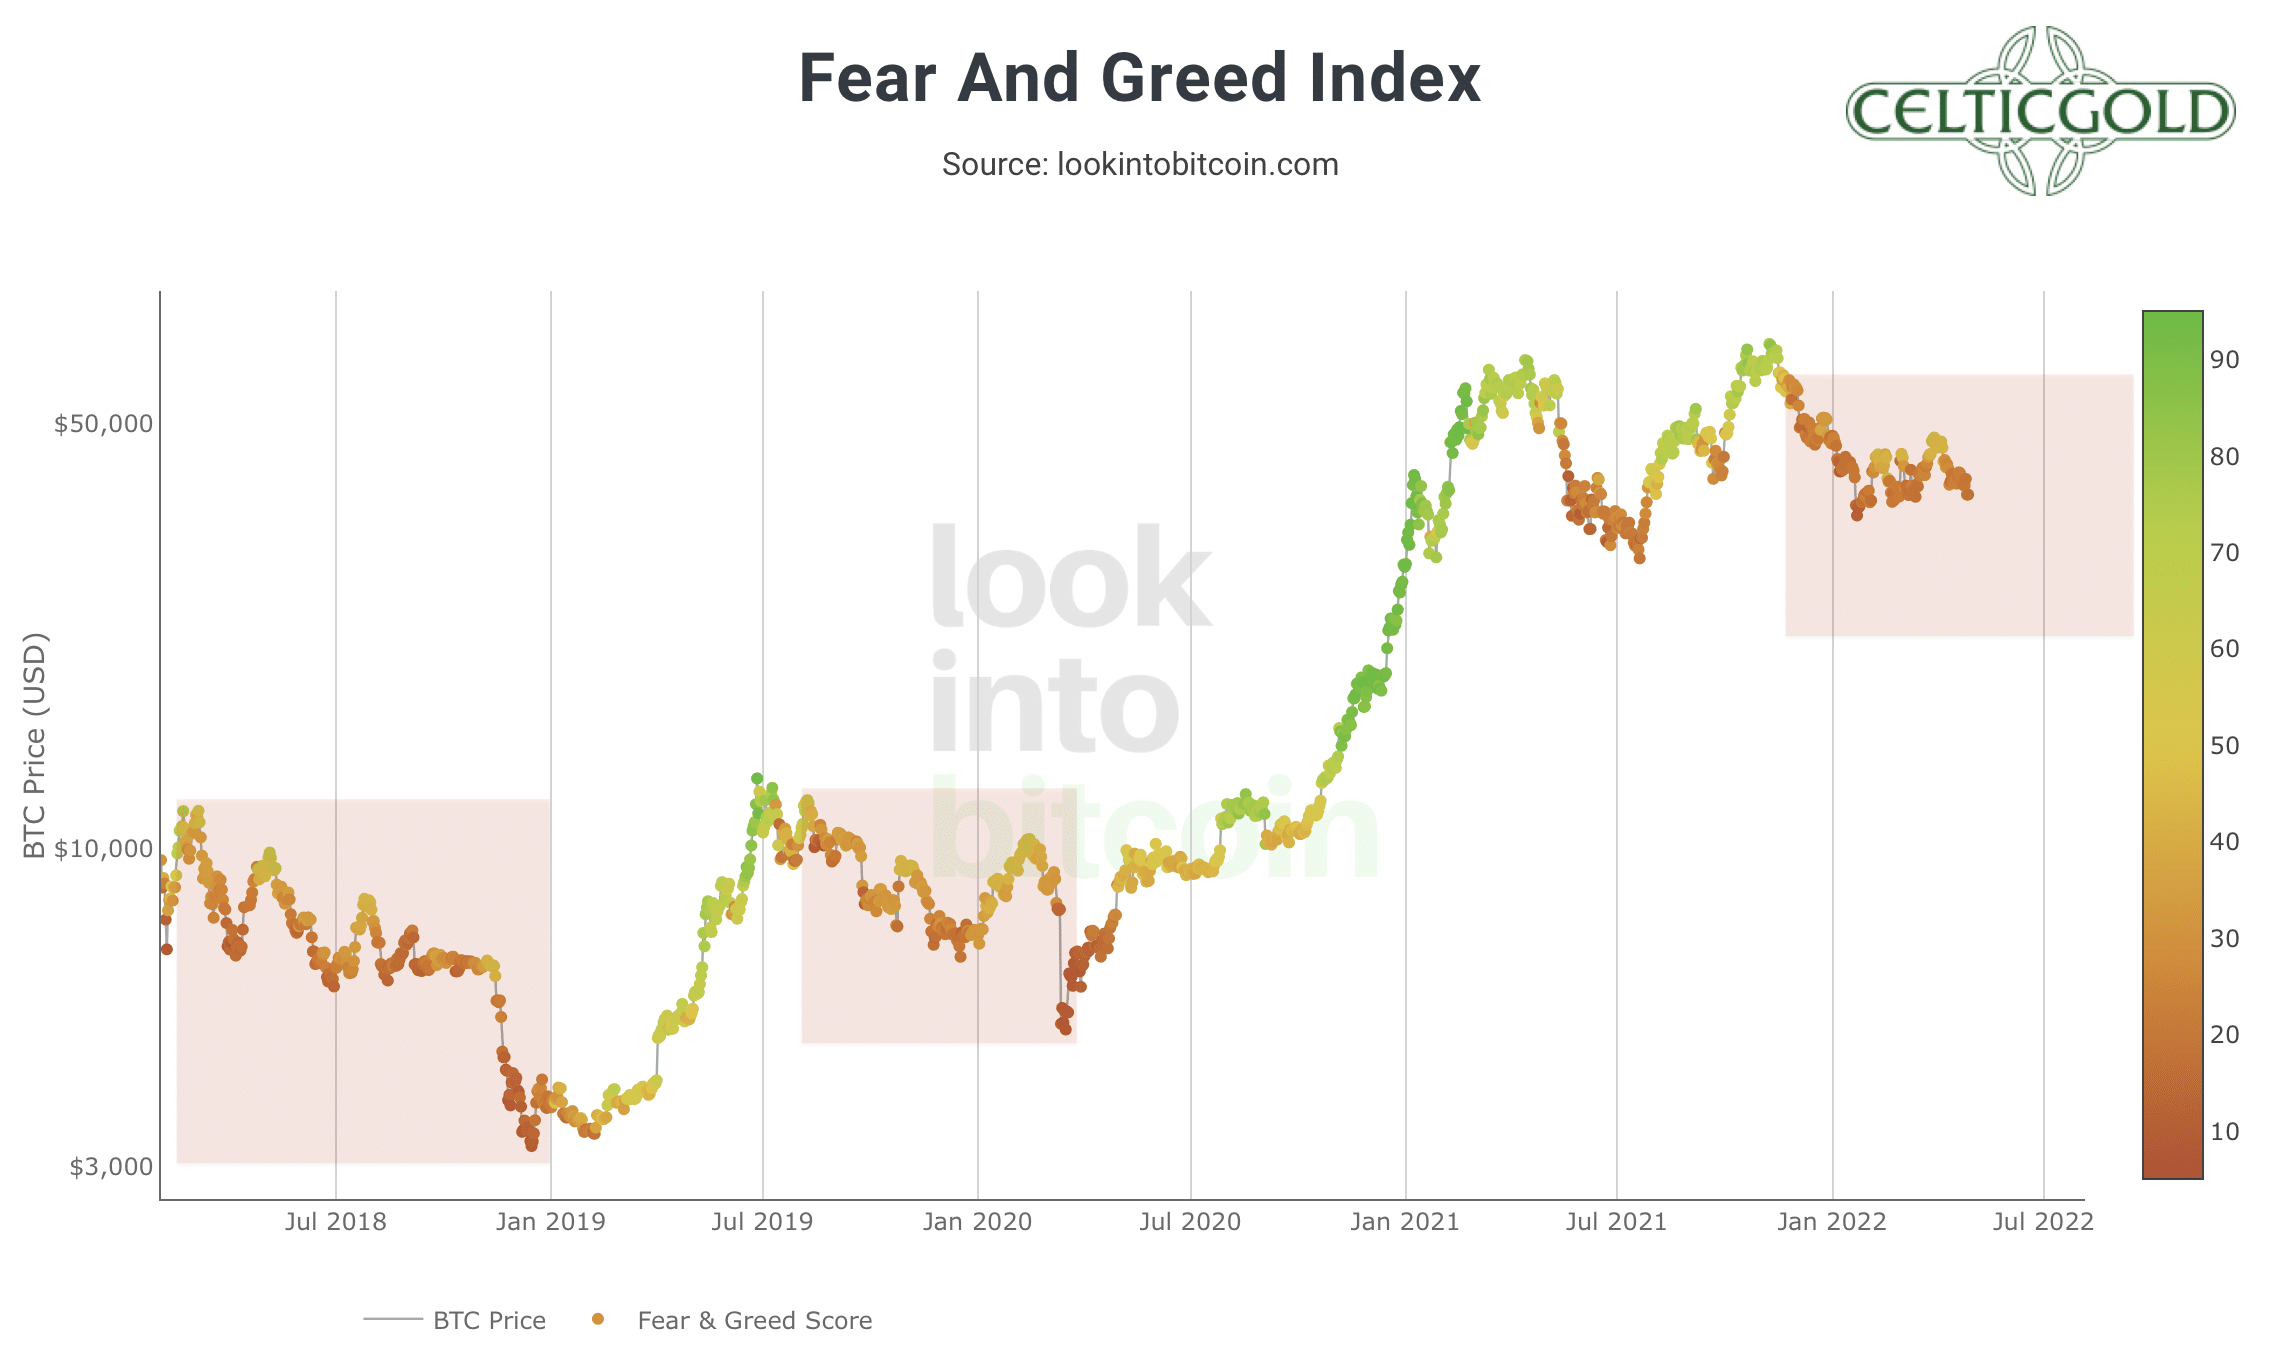
Crypto Fear & Greed Index longterm, as of April 27th, 2022. Source: Lookintobitcoin
In the bigger picture, the Crypto Fear & Greed has not shown any green signs since mid-November. If we compare the course of the last five months with the development in 2018, it quickly becomes clear that the crypto sector, like then, no longer succeeds in optimistic sentiment and we must therefore assume an established bear market. Therefore, the poor sentiment does not currently provide a contrarian buying opportunity, but rather confirms the bear market regime.
All in all, despite the bombed-out sentiment, our sentiment analysis does not currently yield a contrarian buy signal, but rather calls for caution and restraint. So far, every crypto bear market has ended with a nasty final sell-off, in which many altcoins quickly lost another 50 – 70% in value.
Seasonality Bitcoin
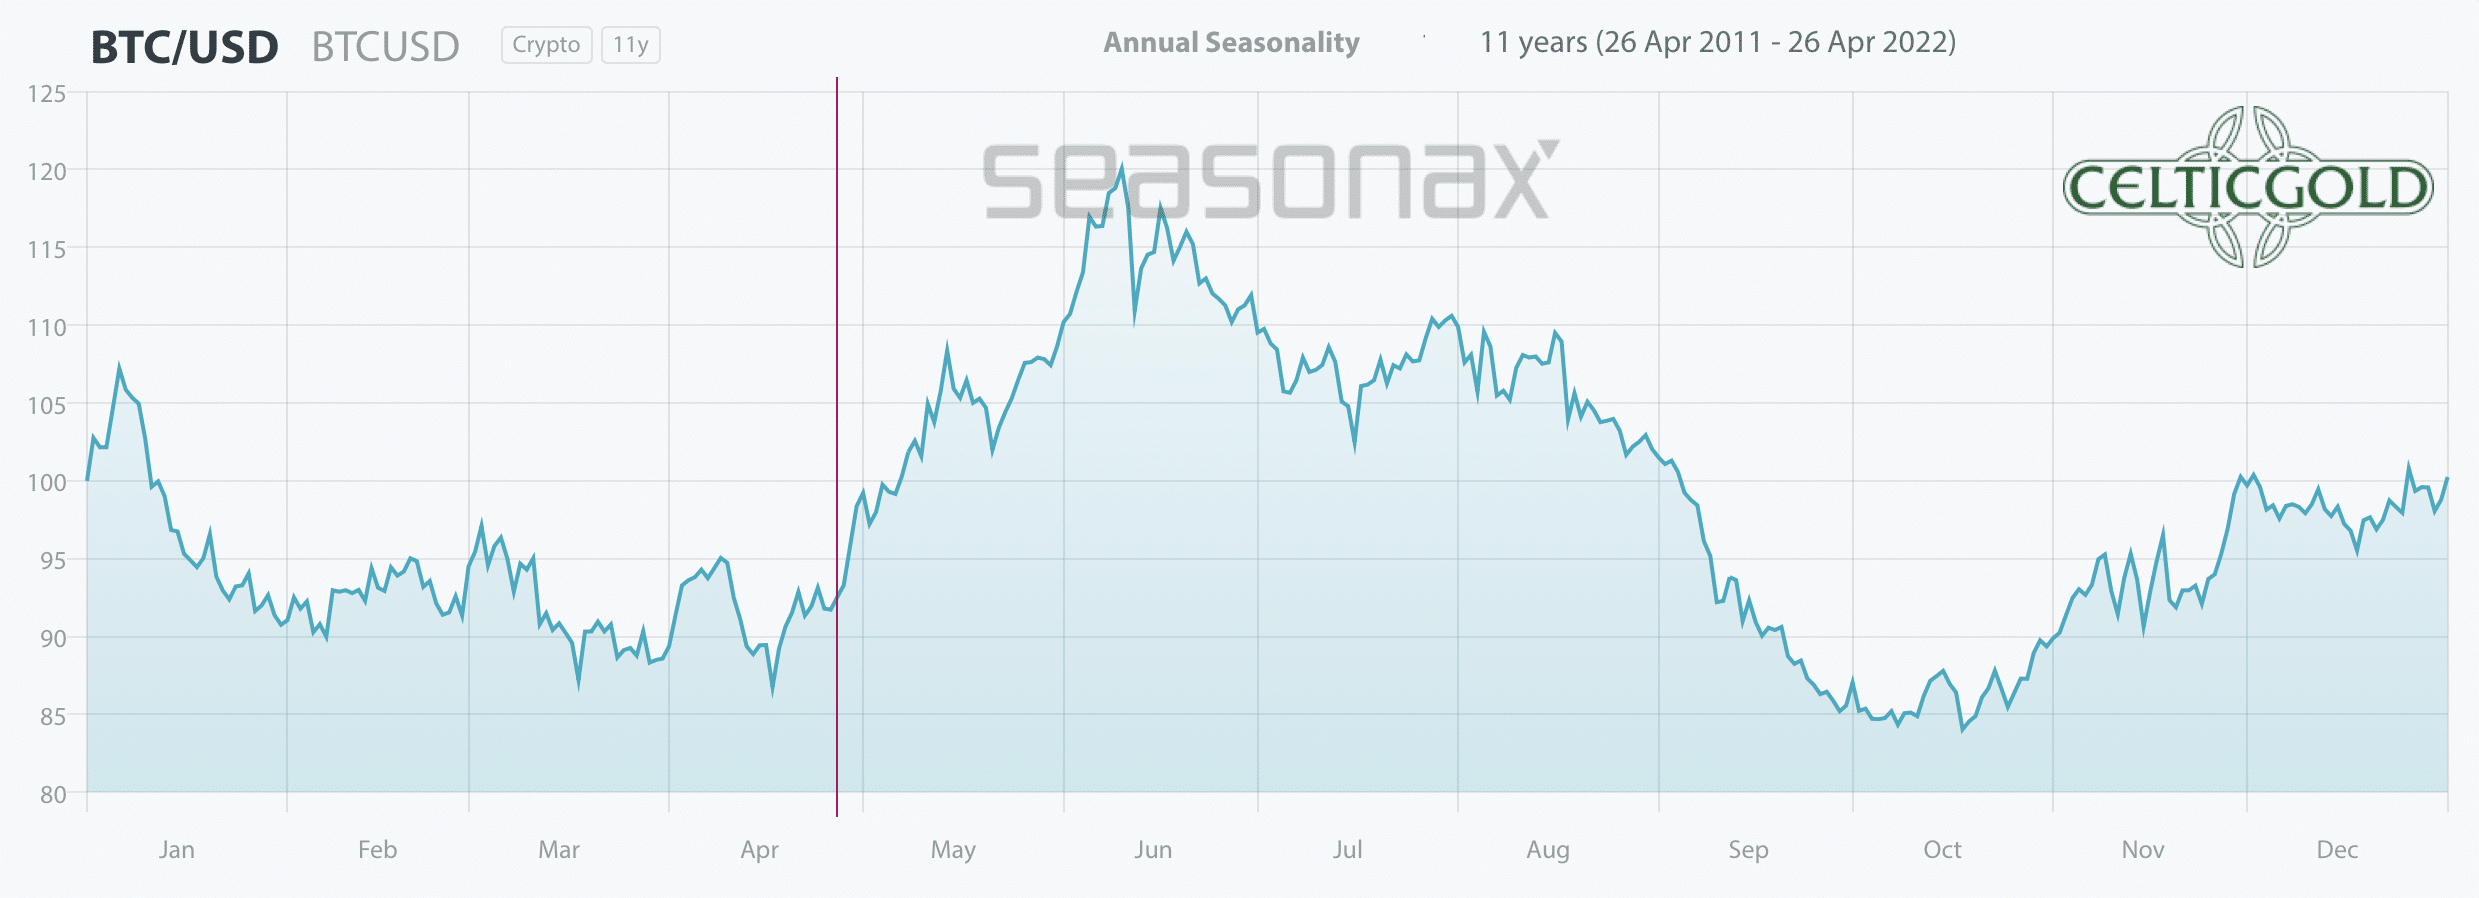
Seasonality for bitcoin, as of April 27th, 2022. Source: Seasonax
Based on the seasonal pattern of the last 11 years, bitcoin should actually be at the beginning of a multi-month wave up. Statistically, the seasonal component is still very favorable until around mid-June. It is therefore quite possible that bitcoin will now manage at least a kore or less solid bounce in the coming weeks after this sharp sell-off.
So far this year, however, market activity has not adhered to the seasonal pattern.
Sound Money: Bitcoin vs. Gold
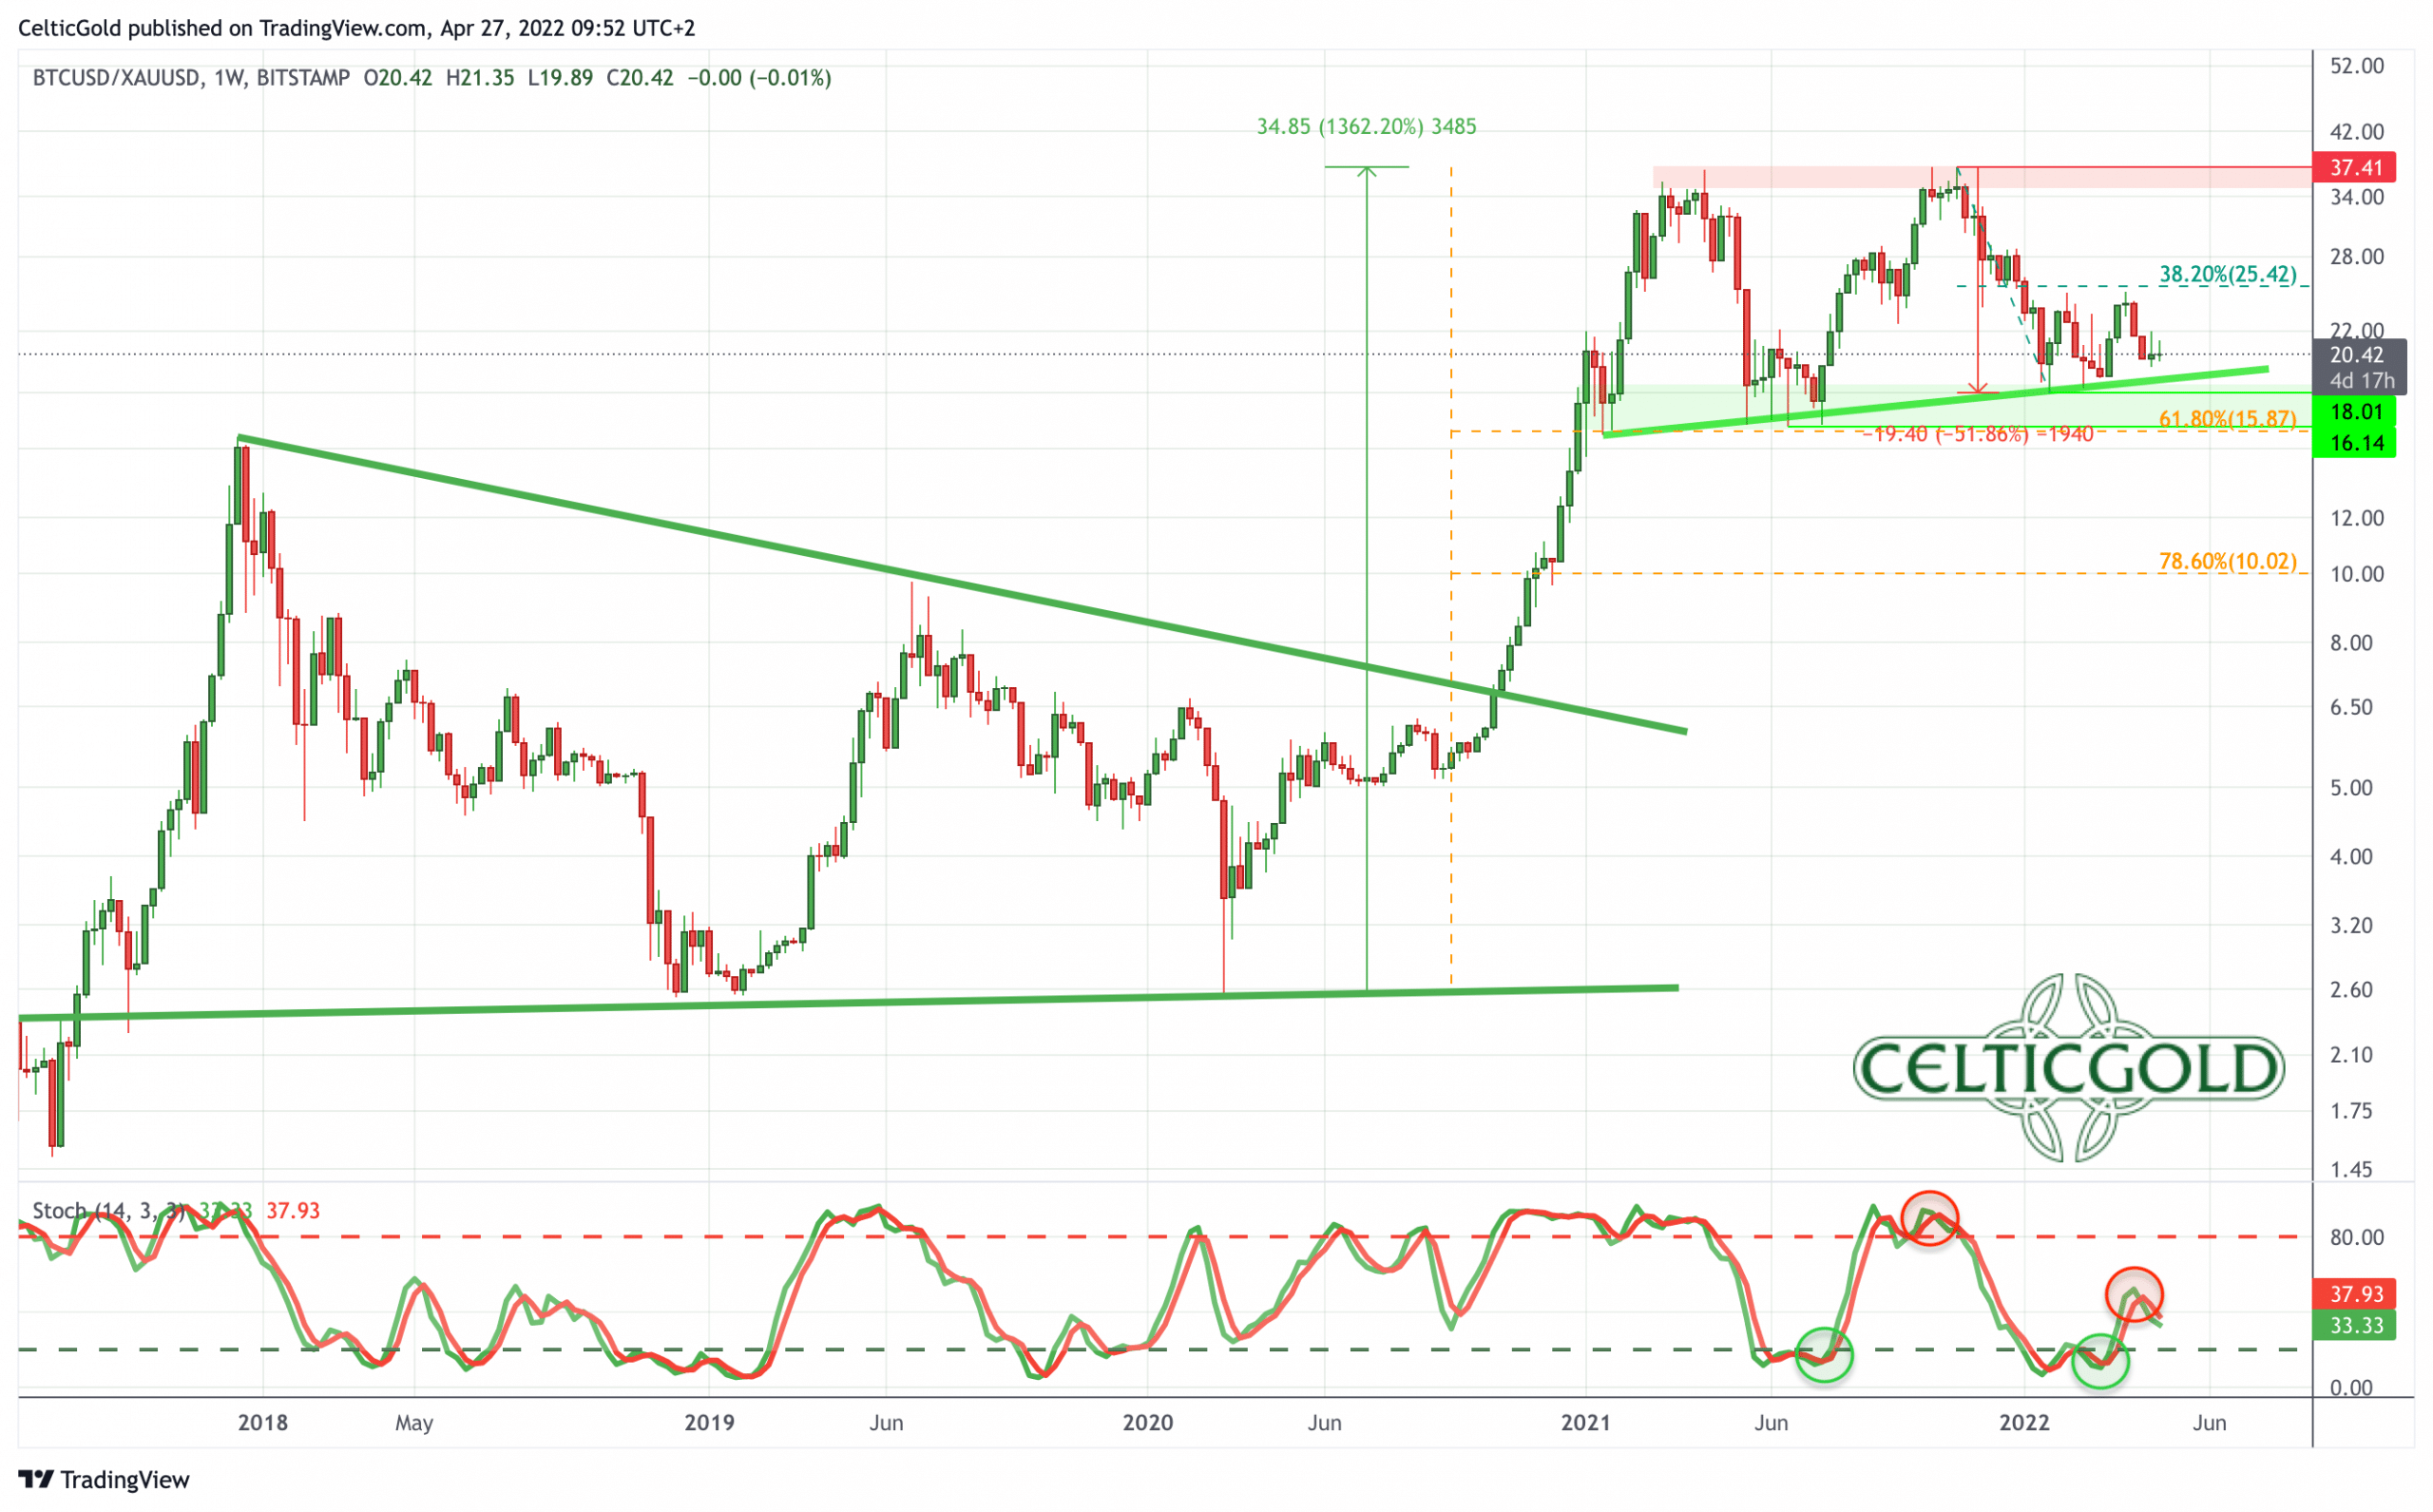
Bitcoin/Gold-Ratio as of April 27th, 2022.Source: Tradingview
After a loss of over 50% against gold, the bitcoin/gold-ratio was able to recover to just under 25 by the end of March. However, the ratio could not hold those gains for long, and ultimately failed just below the 38.2% retracement (25.42) of the previous wave down. At prices of currently about US$38,900 for a bitcoin and about US$1,900 for one ounce of gold, one has to pay a good 20.50 ounces of gold for one bitcoin. Put another way, an ounce of gold currently buys you about 0.0488 bitcoin.
The weekly chart for the bitcoin/gold-ratio suggests further weakness for bitcoin, as the recovery was ultimately rather shallow, and the ratio is approaching a key support line. The stochastic oscillator activated a new sell signal, too. Regardless of short-term recoveries, the ratio could therefore fall below the major support between 18 and 16 in the coming months. Then, a continuation of the correction towards approx. 10 would be possible.
Allocation of sound money
Generally, buying and selling Bitcoin against gold only makes sense to the extent that one balances the allocation in those two asset classes! At least 10% up to a maximum of 25% of one’s total assets should be invested in precious metals physically, while in cryptos and especially in bitcoin one should hold at least 1% but max. 5%. If you are very familiar with cryptocurrencies and bitcoin, you can certainly allocate much higher percentages to bitcoin on an individual basis. For the average investor, who is primarily invested in equities and real estate, a maximum of 5% in the still highly speculative and highly volatile bitcoin is a good guideline!
Overall, you want to own gold and bitcoin, since opposites complement each other. In our dualistic world of Yin and Yang, body and mind, up and down, warm and cold, we are bound by the necessary attraction of opposites. In this sense, you can view gold and bitcoin as such a pair of strength. With the physical component of gold and the pristine digital features of bitcoin you have a complementary unit of a true safe haven for the 21st century. You want to own both! – Florian Grummes
In summary, the recovery in the bitcoin/gold ratio seems to be over. Over the coming 3 to 10 months, the market could approach and test the support between 16 and 18. This means that the gold price will outperform bitcoin until the end of the crypto winter.
Macro Update: In the bond markets an avalanche has started rolling
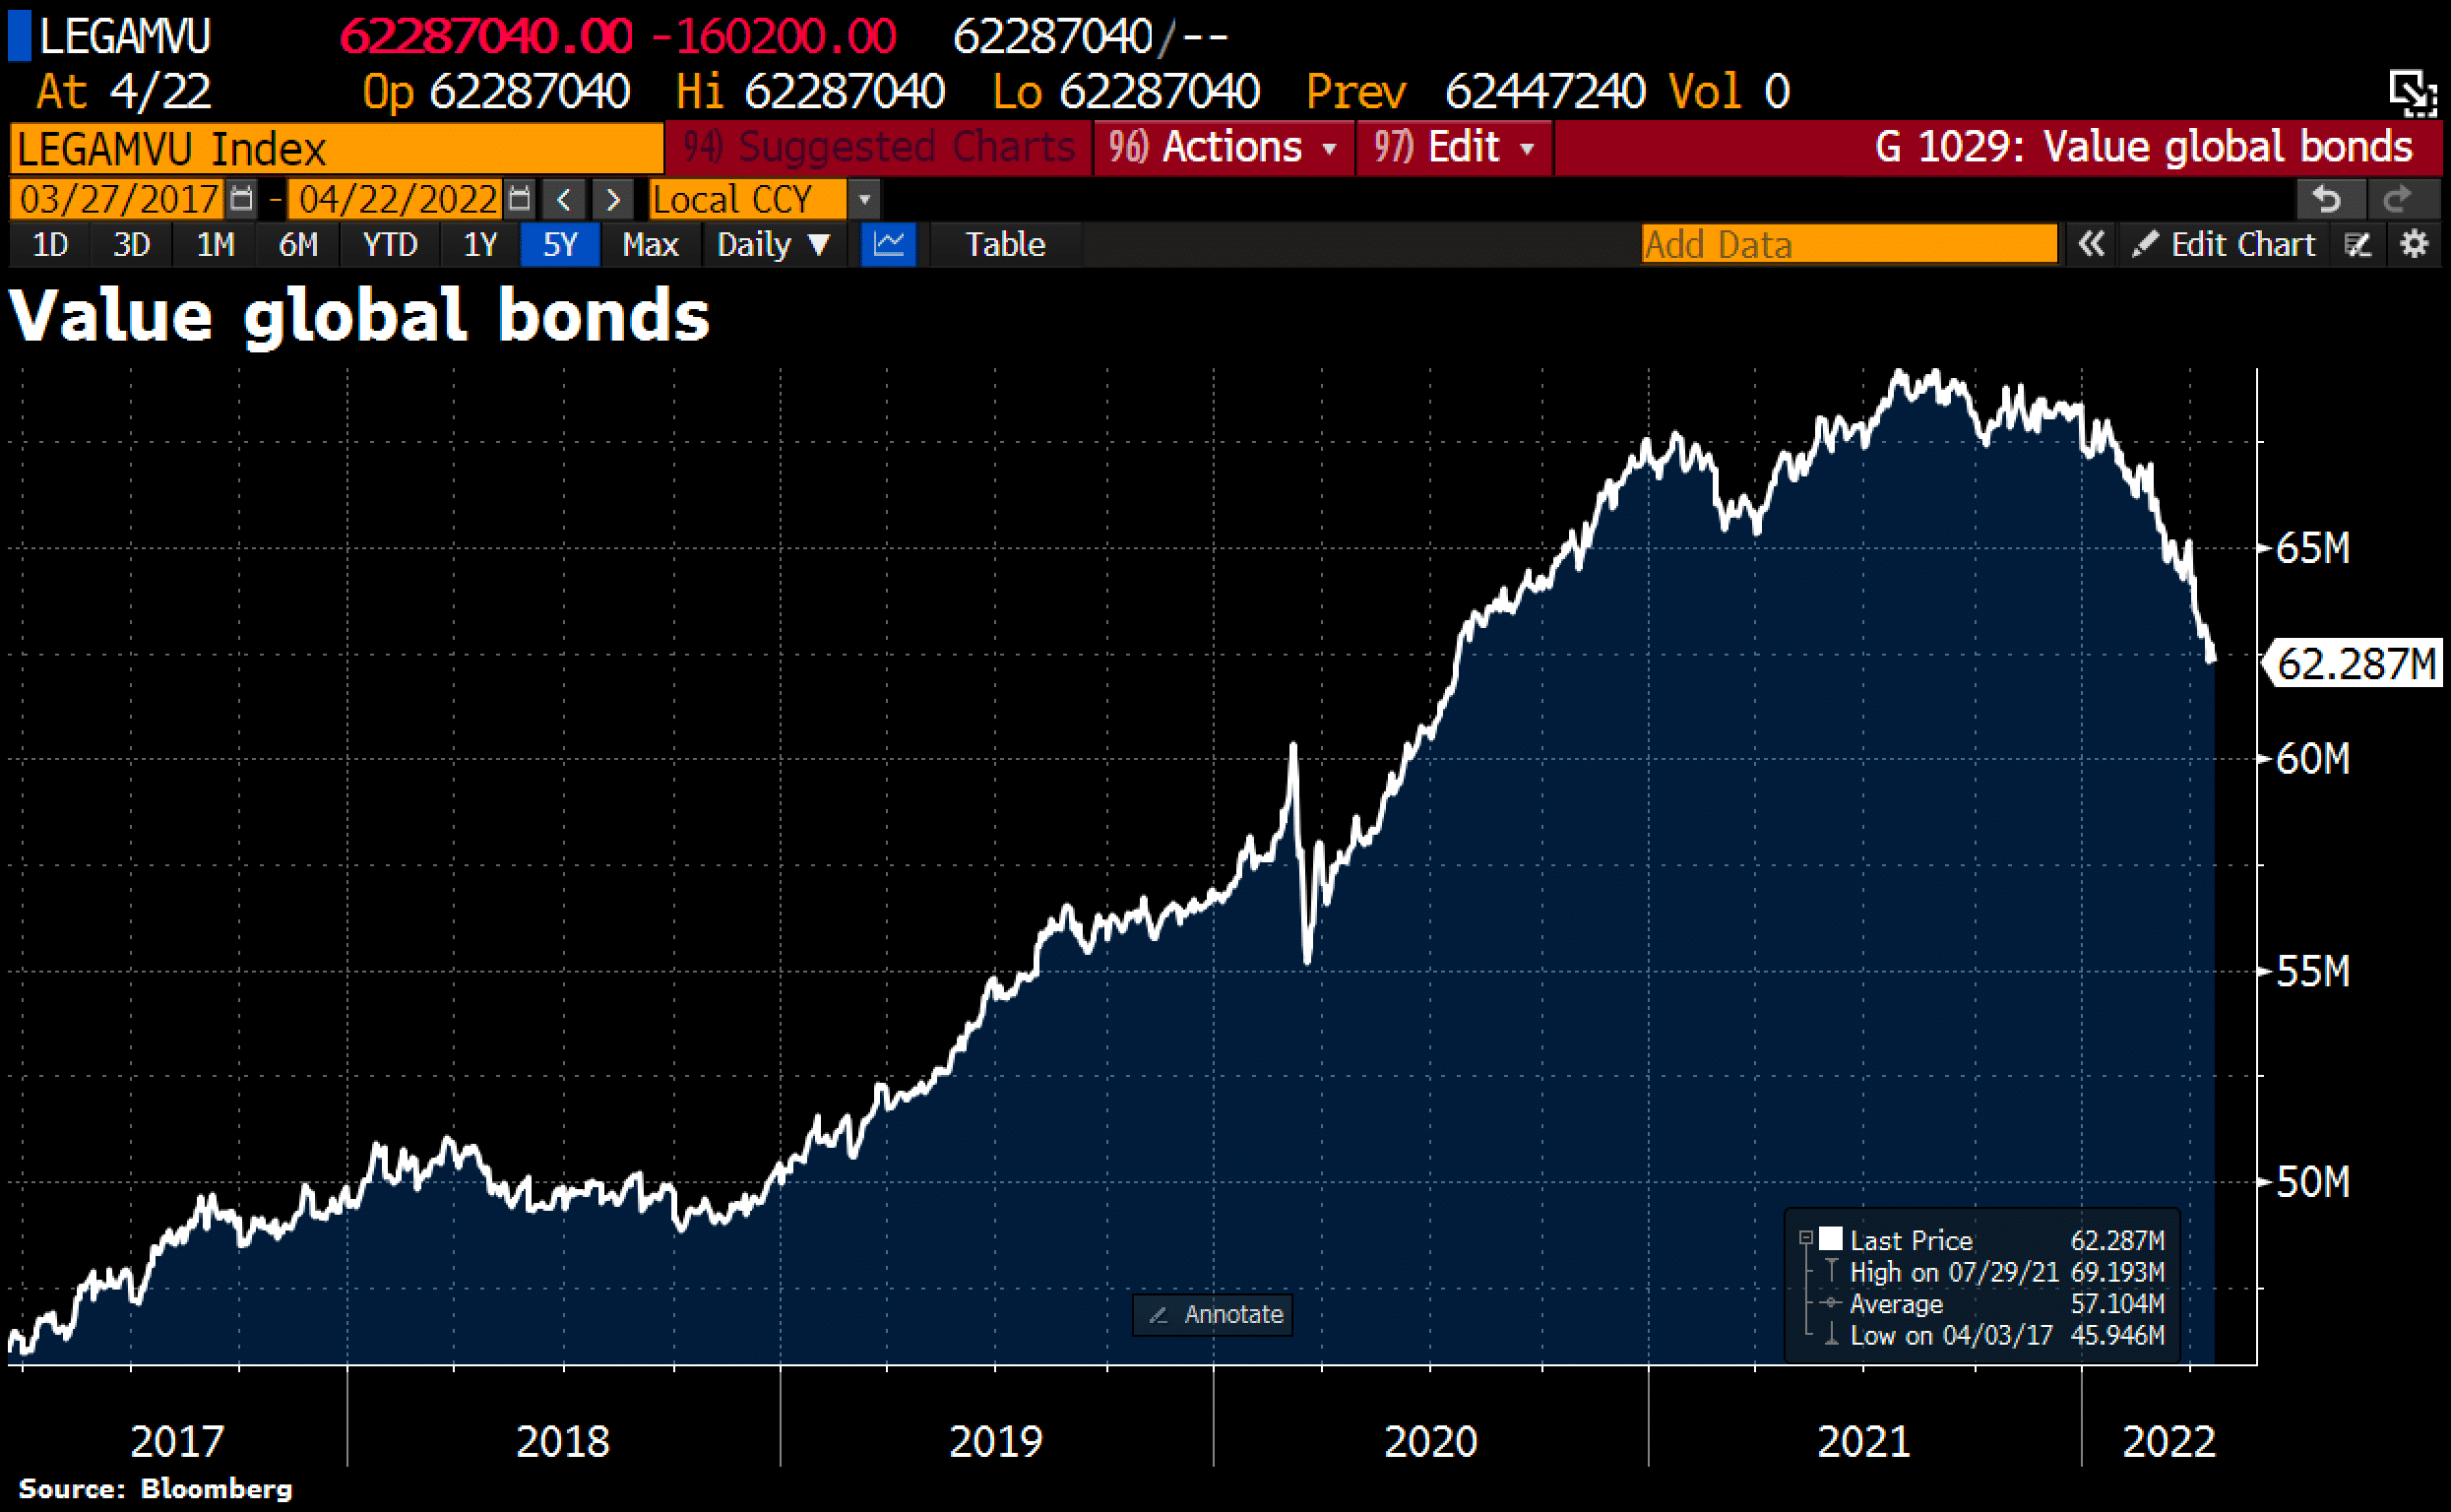
Global bond market as of April 24, 2022. ©Holger Zschaepitz
The bursting of the biggest bond bubble of all time has been causing increasing stress throughout the financial system in recent months. Driven by the Federal Reserve’s interest rate hike rhetoric and skyrocketing inflation figures, a good US$7 billion has already been wiped out since the all-time high mid of last year. This is putting enormous pressure on the equity, credit and real estate markets. It seems as if an avalanche has started rolling.
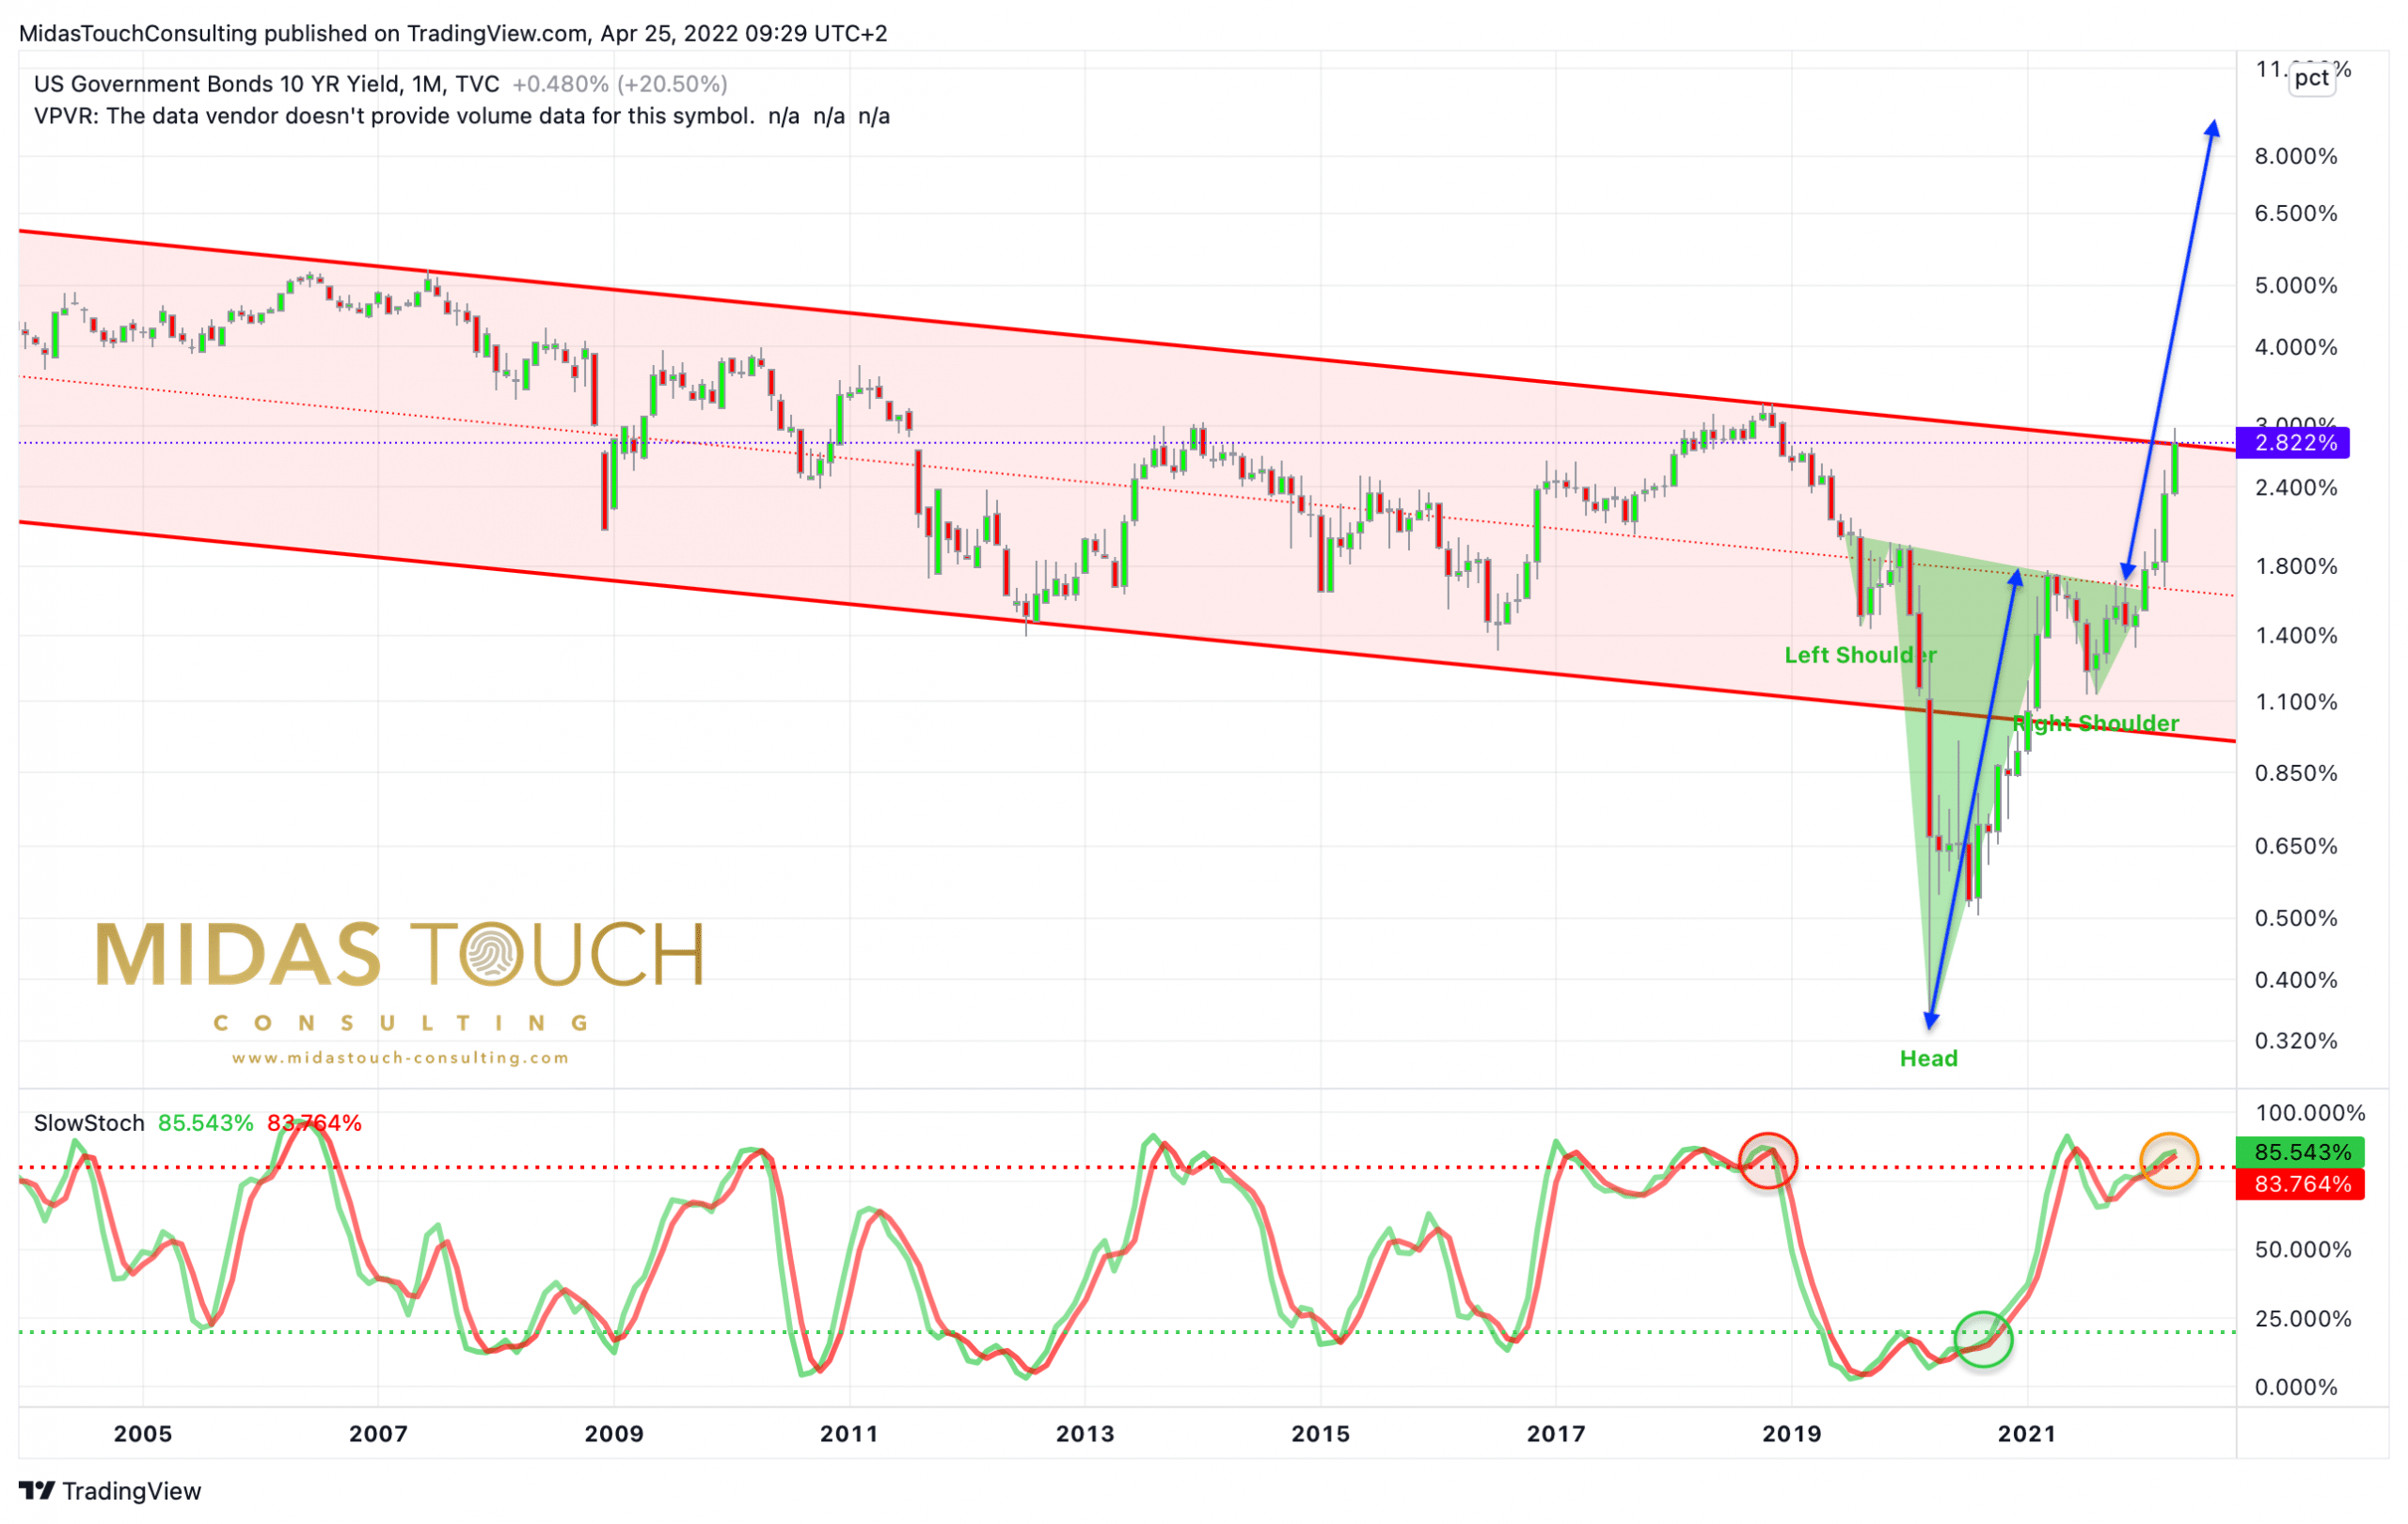
U.S. Government Bond 10-years, dated April 25, 2022. ©Midas Touch Consulting.
Since 1981, the yield on 10-year U.S. government bonds has been in a never-ending downward trend. Anyone who speculated against falling interest rates was mercilessly proven wrong. Now, however, it looks like this mega-trend ended in March 2020 with absolute record low interest rates.
Since then, the yield on the 10-year U.S. Treasury bond has increased nearly eightfold and is scraping the top of the 41-year downtrend channel. If this is an inverse shoulder-head-shoulder formation, a rise in U.S. yields to 10% over the next few months or years would be quite possible. This sharp rally also gives the impression that the Fed has lost control of the bond market. Institutional investors in particular are likely to be sitting on gigantic losses.
From this perspective, the strong pressure in all market segments makes sense. It should even continue to build up in the medium term. The recent extremely high inflation data should also decline significantly by the end of the year due to the spreading crisis. On top, commodity markets appear overheated and are probably ripe for a healthy correction after the strong rally over the past two years.
Not only Bitcoin – Risk-Off dominates all markets
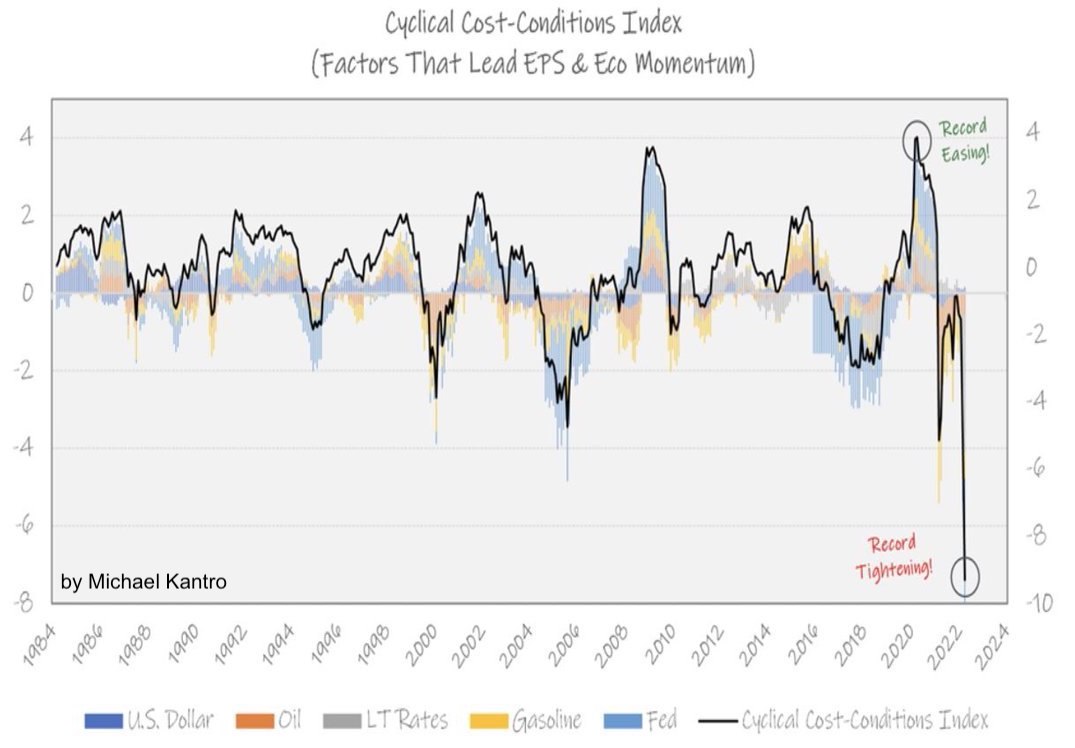
Cyclical Cost-Conditions Index, as of April 23, 2022. ©Michael Kantrowitz
We take the current situation very seriously and expect a tightening of the “risk-off mentality” and a nasty liquidity crunch until fall, as every market participant is now scrambling to still somehow raise cash. Especially the collapsing stock markets and tech stocks are likely to remain under pressure regardless of short-term recoveries. Bitcoin as well as the entire crypto sector as highly speculative “risk-on vehicles” are also likely to be massively affected.
Those who have built up a high cash position now and can hold it through to the fall should be presented with brilliant entry opportunities in all markets.
Conclusion: Risk-Off dominates all markets
The financial markets are increasingly dominated by the flight into cash since the bond markets are implodin and tech stocks (Meta -51%, Netflix -71%, PayPal -73%) have been brutally slaughtered. The US-Dollar is the only one to gain. Commodity and precious metals prices are also coming under increasing pressure. It smells like the summer of 2008!
Nevertheless, in the short term, there could be a reaction back above US$40,000 and towards US$42,000 to US$44,000 or even higher. After all, sharp but misleading recoveries always occur in any bear market. These are triggered by a temporary short squeeze, where short sellers have to cover their positions. However, these sharp recoveries then quickly collapse again. Bitcoin has not seen anything like this since January. So the next major recovery would be a selling opportunity!
In the big picture, bitcoin is still trading in the large sideways range between roughly $30,000 and $65,000. There are increasing signs that a retest of the underside around US$30,000 could occur in the coming months, regardless of any intervening recoveries. A very defensive approach to the financial markets is strongly recommended.
Analysis sponsored and initially published on April 27th, 2022, by www.celticgold.eu. Translated into English and partially updated on April 27th, 2022.
Feel free to join us in our free Telegram channel for daily real time data and a great community. If you like to get regular updates on our gold model, precious metals, commodities, and cryptocurrencies you can also subscribe to our free newsletter.
Disclosure: This article and the content are for informational purposes only and do not contain investment advice or recommendations. Every investment and trading move involves risk, and readers should conduct their own research when making a decision. The views, thoughts and opinions expressed here are the author’s alone. They do not necessarily reflect or represent the views and opinions of Midas Touch Consulting.

