


Bitcoin – Emotional rollercoaster at critical support.
Between early January and mid of July, Bitcoin had outperformed all other asset classes. Over the last six weeks, however, the largest and most dominant cryptocurrency is down more than 18%. Bitcoin – Emotional rollercoaster at critical support.
Review
With prices topping out at USD 31,818 on July 13th, Bitcoin had achieved its highest level since June 1st, 2022. However, this level could only be maintained for two days before prices swiftly descended again. Bitcoin then traded in a sideways range for nearly five weeks, roughly between USD 30,500 and USD 29,000 USD.
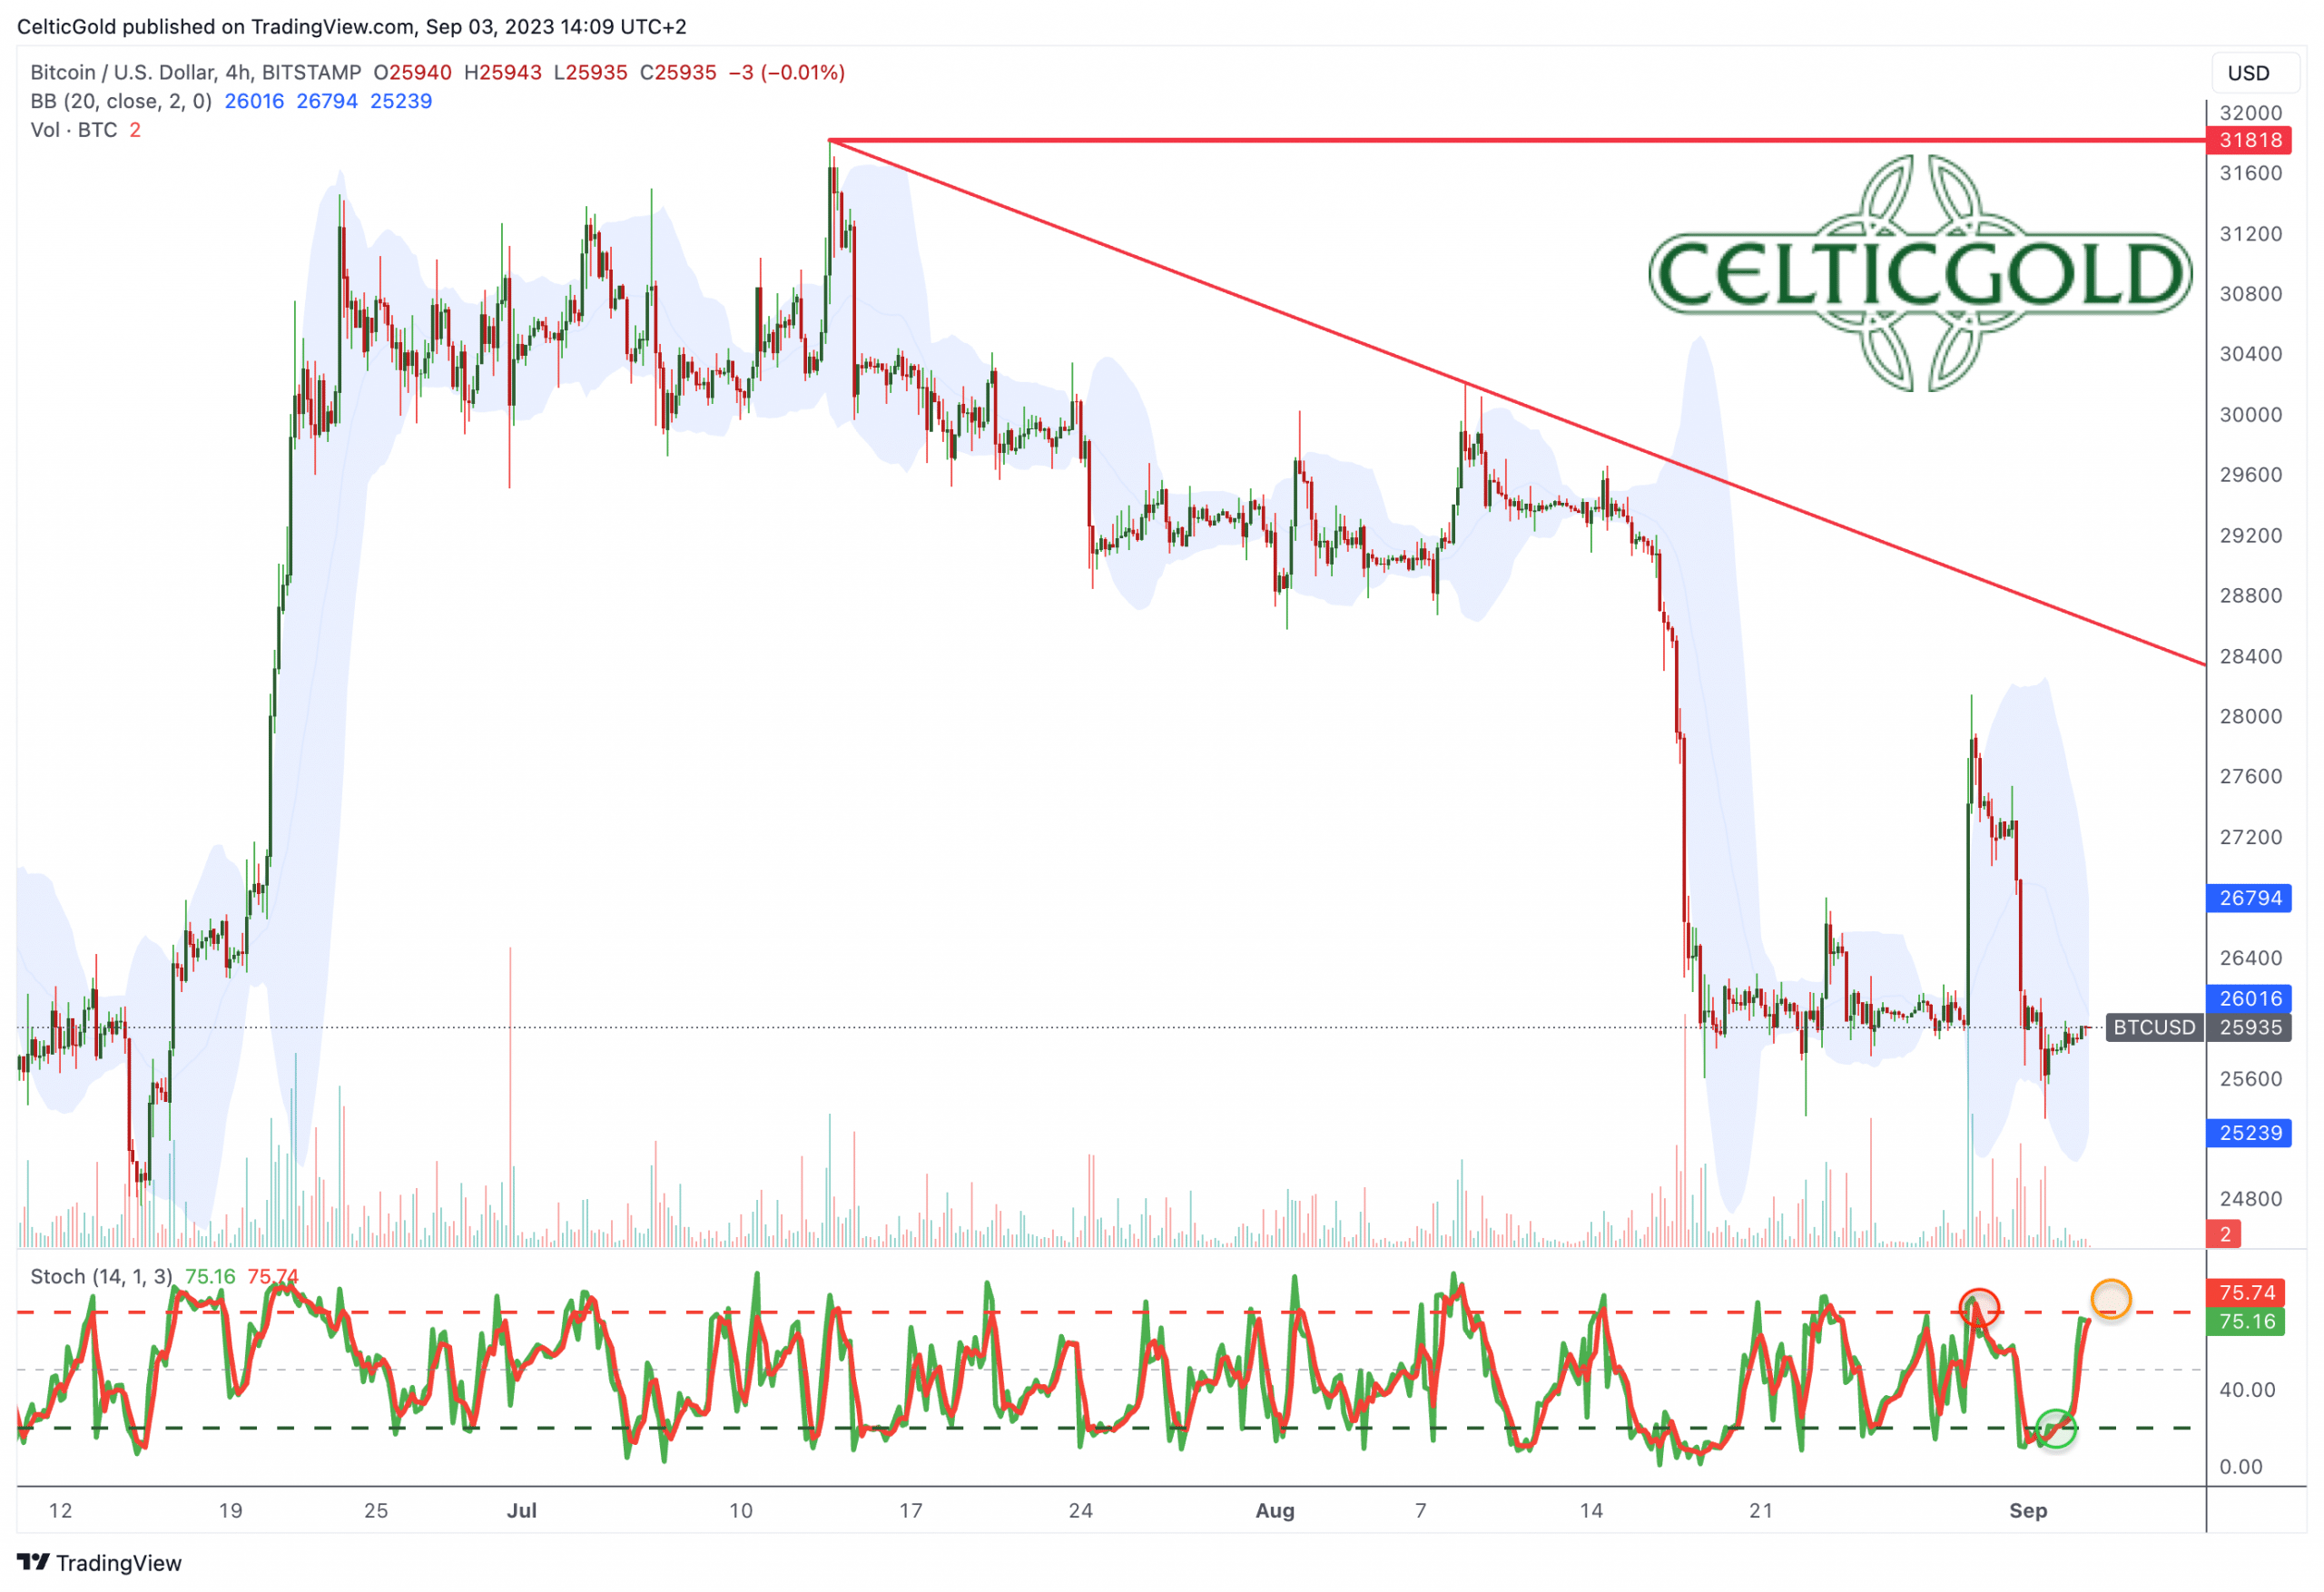
Bitcoin in USD, 4-hour chart as of September 3rd, 2023. Source: Tradingview
In the midst of peak summer season, breaching the USD 29,000 support on August 17th triggered a sharp decline. Prices quickly plummeted to USD 26,100, with some crypto exchanges briefly seeing even lower prices around USD 24,700 USD. According to Coinglass, this crash forced the liquidation of long positions worth over USD 820 million within a few hours!
Bitcoin – Emotional rollercoaster at critical support
Over the following 11 trading days, Bitcoin remained in a state of shock, moving in a narrow range just above USD 26,000.
Almost out of nowhere, the landmark decision of a U.S. court regarding the unlawful rejection of Grayscale Investments’ application for a publicly traded Bitcoin Spot ETF reignited Bitcoin last Tuesday. Prices surged to nearly USD 28,200 within a few hours and immediately unleashed big enthusiasm among perma crypto bulls.
However, this recovery was very short-lived as Bitcoin quickly relinquished all its gains over the following two trading days, returning to its tight trading range around USD 26,000. From a sober perspective, this emotional rollercoaster at the critical support of USD 26,000 does not bode well regarding price action in the short-term future.
Whether the dismal economic data from China, the most aggressive interest rate hike cycle in the U.S. ever, the Binance saga, or simply a larger bear market is to blame for the price decline remains open to interpretation. In any case, Bitcoin has been losing momentum since mid-July. Trading volume has also been significantly declining since many weeks. Furthermore, the last attempt to break above USD 30,000 USD on August 8th failed miserably. As a result, the sell signals accumulated, requiring very little to trigger a cascade of stop-loss orders and liquidations.
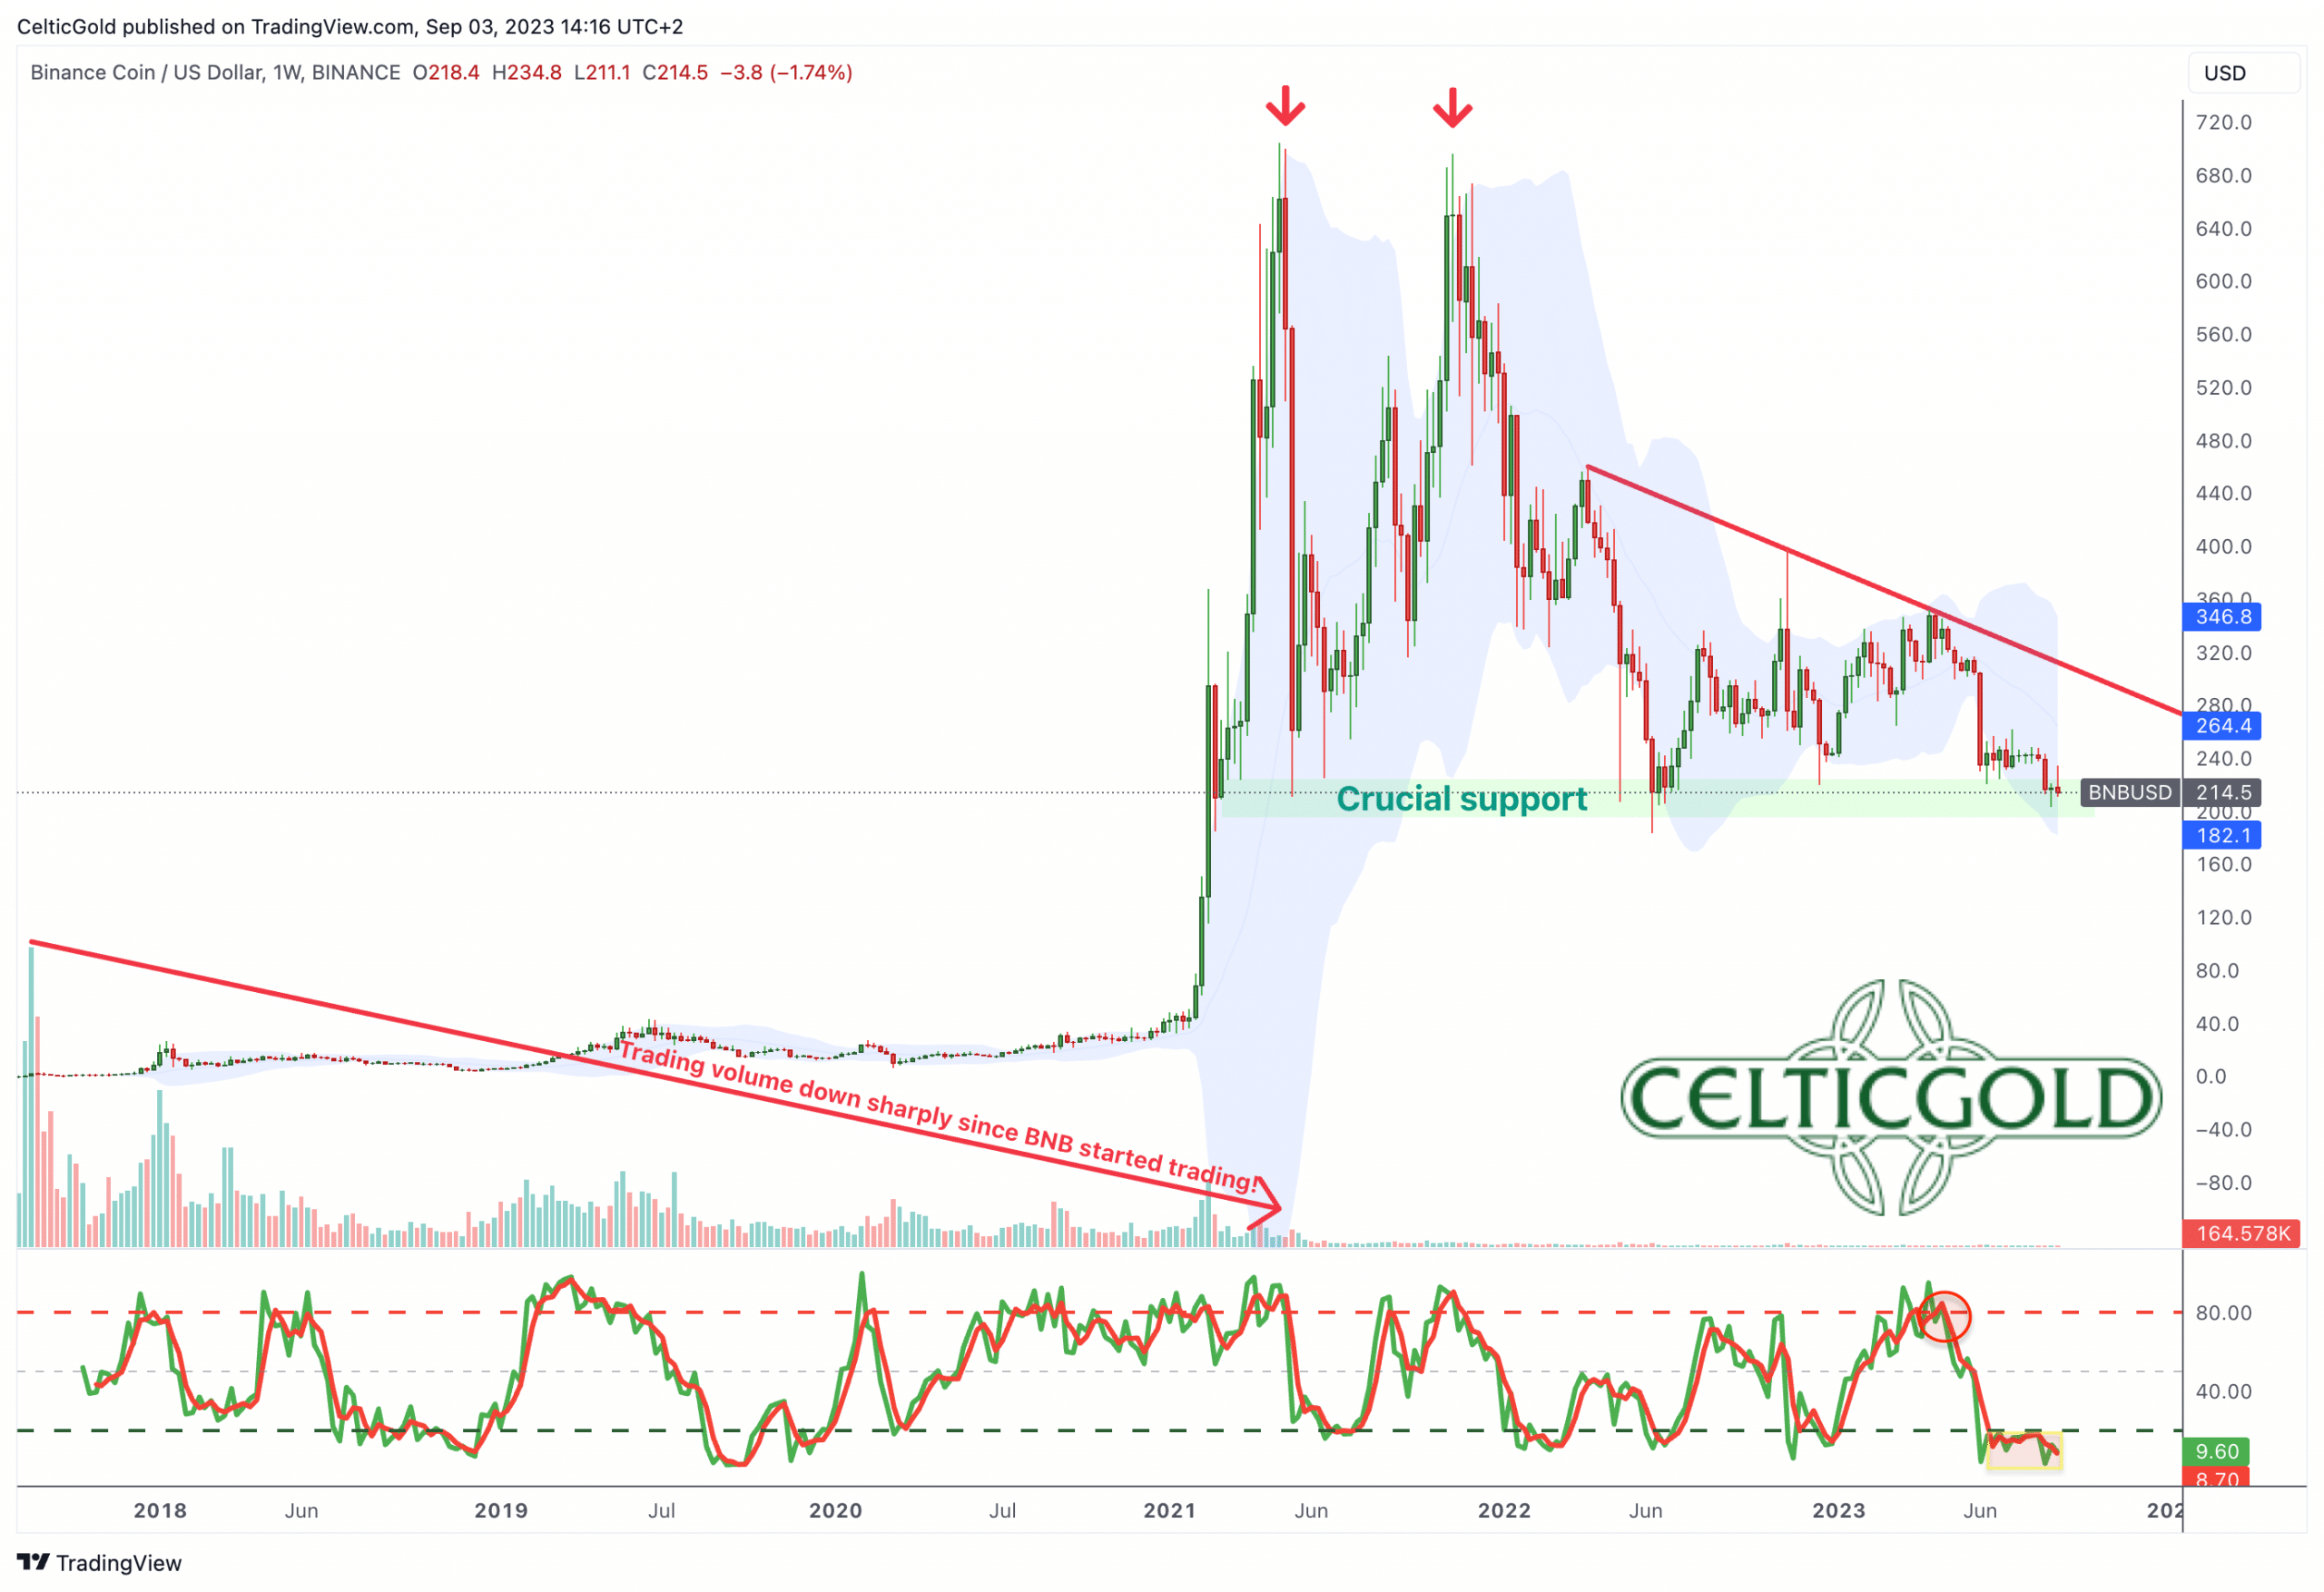
BNB (Binance Smart Chain) in USD, weekly chart as of September 3rd, 2023. Source: Tradingview
However, the “Binance problem” has not been resolved by the ongoing pullback. On the contrary, the once-largest and most successful crypto exchange has been struggling for months. The FTX collapse and the bear market since late 2021 have taken a toll on Binance. Since being sued by the SEC for lacking trading licenses, the situation has been progressively worsening, with its own blockchain, “Binance Smart Chain,” and the BNB token coming under severe pressure. The market capitalization of BNB is still around USD 33 billion, but the token price has recently fallen sharply and is hanging around the critical support zone at USD 210 USD. Below that, there is essentially a void down to approximately USD 40.
In retrospect, the excitement surrounding the potential spot ETF from the world’s largest asset manager, BlackRock, was short-lived. While BlackRock’s application in mid-June led to a rapid 26.6% increase, most of those gains have since been erased. However, the “Bitcoin Spot ETF” topic is not off the table and should generate excitement again, no later than the first quarter of 2024.
Technical Analysis for Bitcoin in US-Dollar
Bitcoin Weekly Chart – The recovery rally since January is now undergoing a correction.
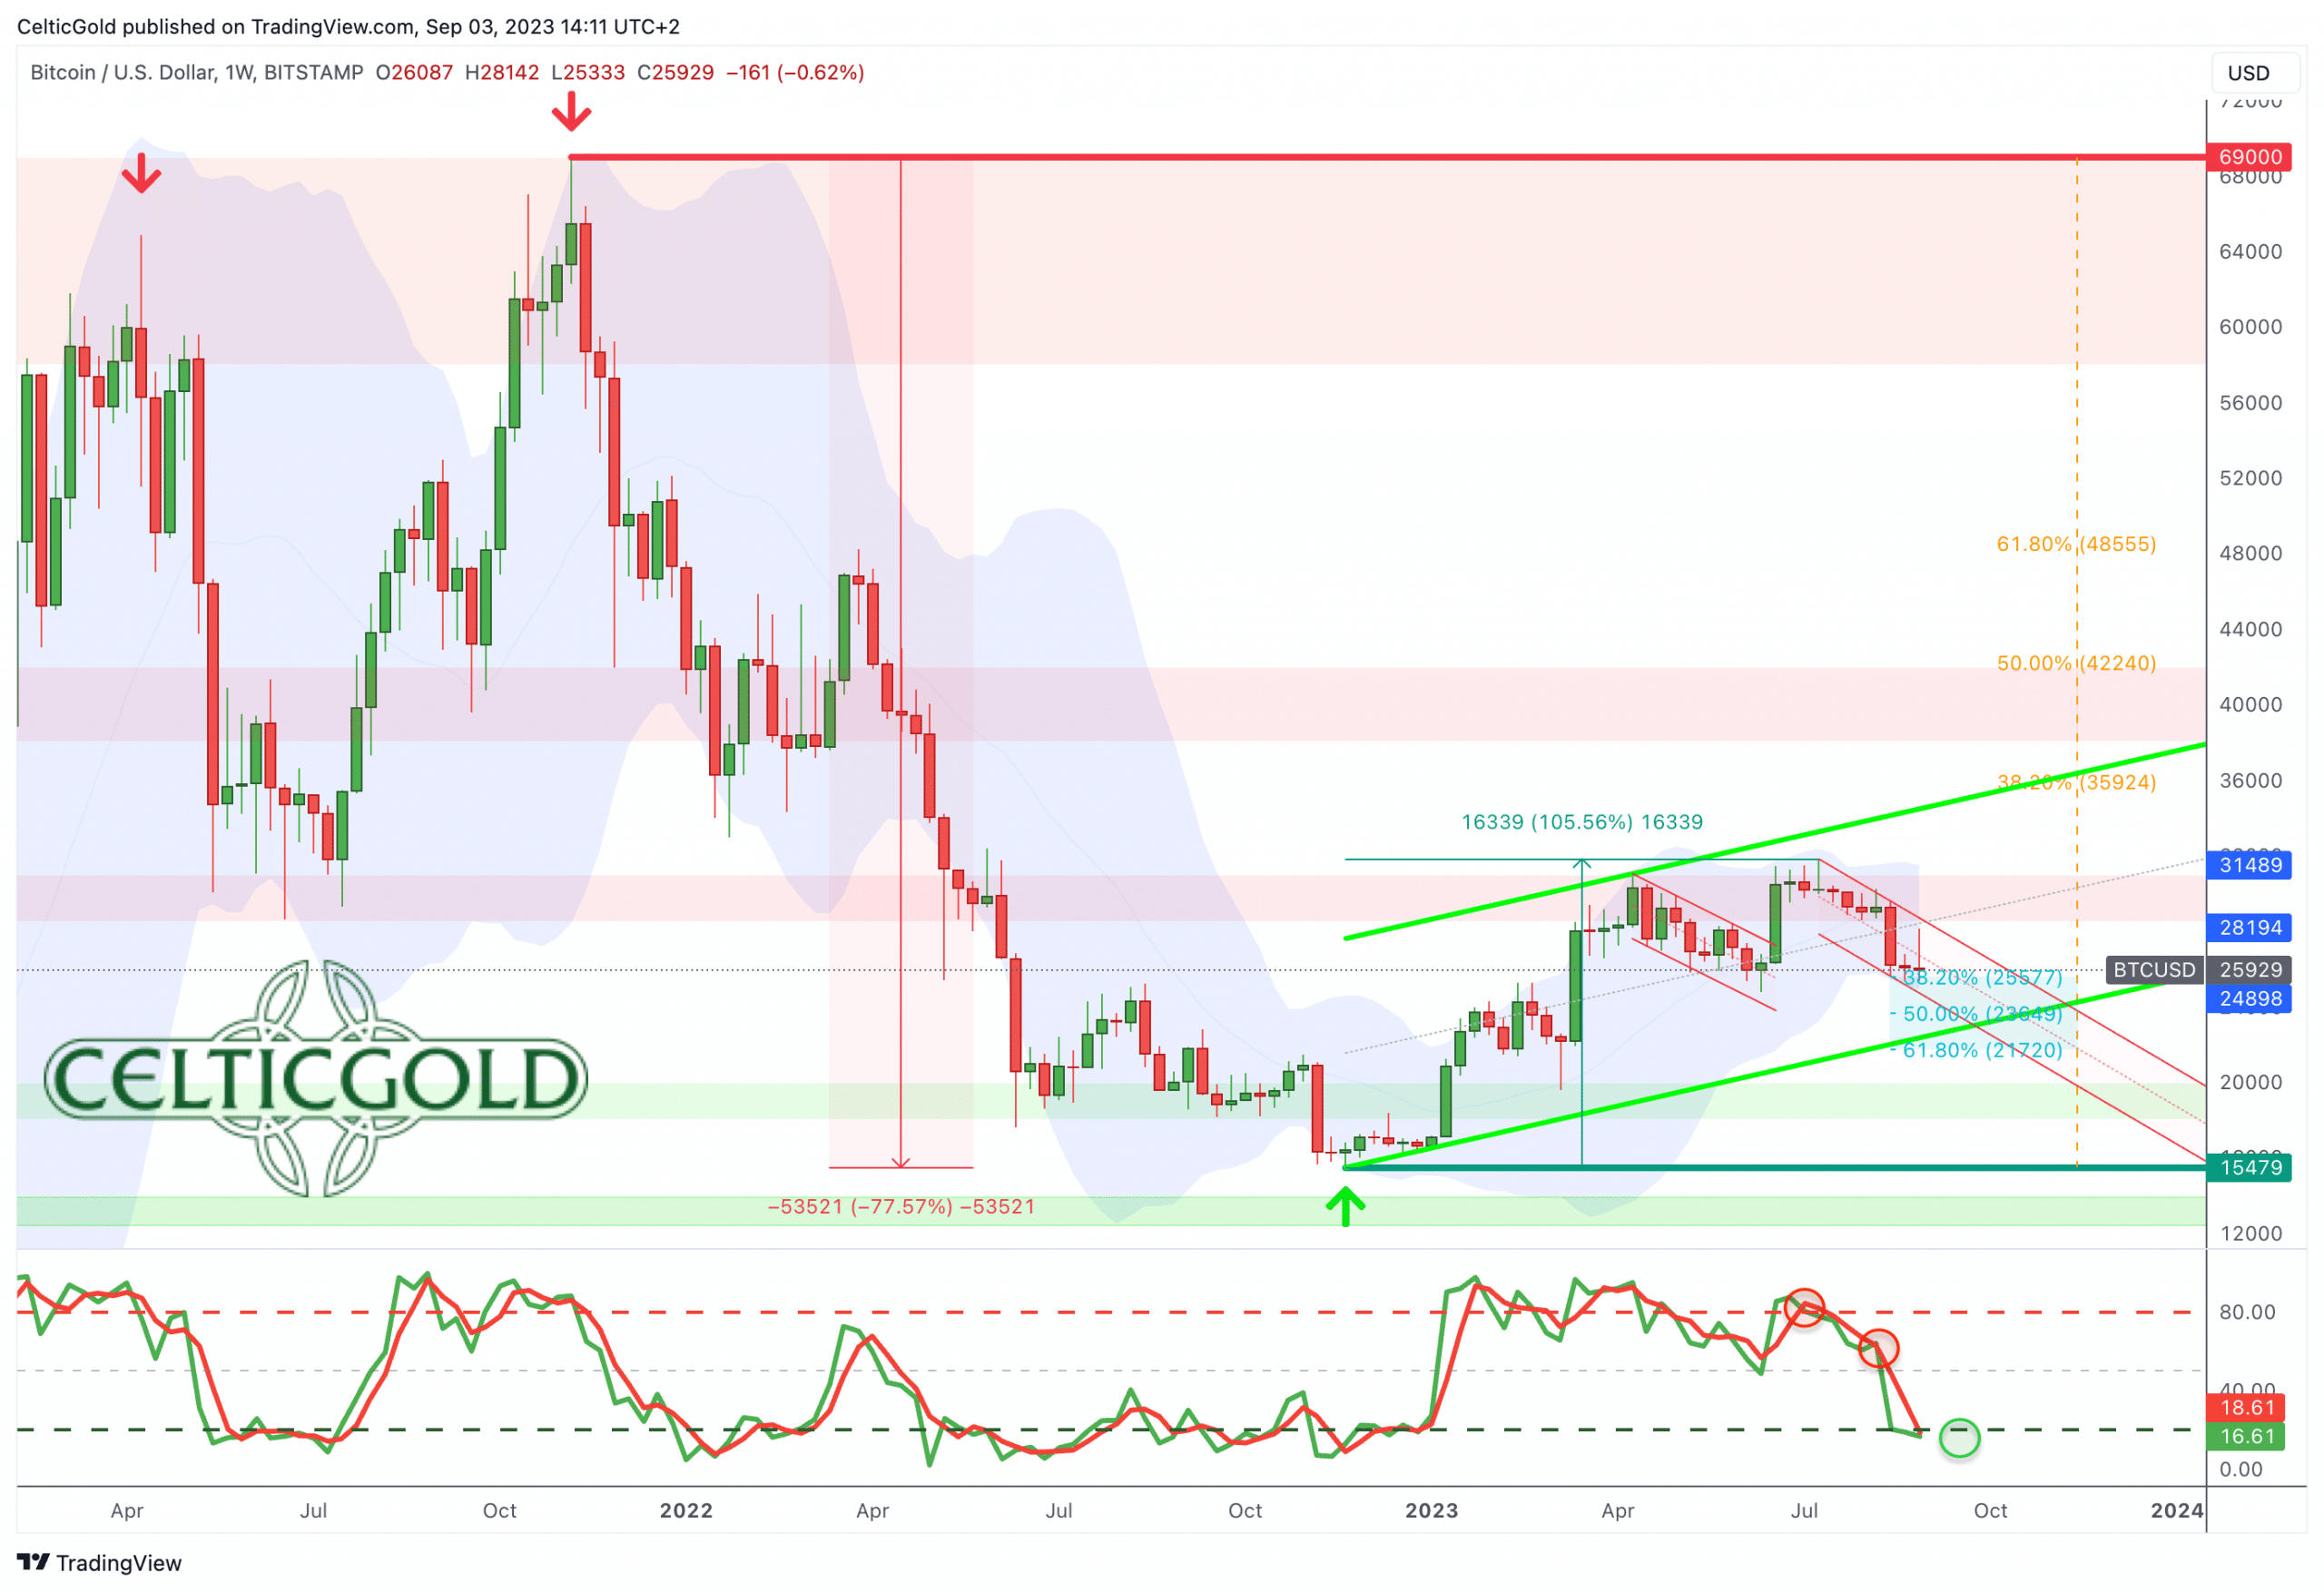
Bitcoin in USD, weekly chart as of September 3rd, 2023. Source: Tradingview
While Bitcoin reached a higher high of USD 31,818 USD in mid-July, further price gains remained elusive. The well-known resistance zone just above the round USD 31,000 mark proved to be too strong.
With the sharp sell-off and failed recovery, the picture has now definitively changed, and we must assume that the recovery rally that began in early January is now being fully corrected. The upward trendline in place since the beginning of the year was easily overrun by the bears. Even the 38.2% Fibonacci Retracement (USD 25,577 USD) was briefly breached. The classic 61.8% Fibonacci Retracement (USD 21,720) along with the uptrend channel are currently waiting around USD 21,750. Although the Stochastic Oscillator has reached its oversold zone, there is no sign of any trend reversal so far.
In summary, the weekly chart is bearish and suggests further selling towards approximately USD 22,000.
Bitcoin Daily Chart – When will the 38.2% retracement be breached?
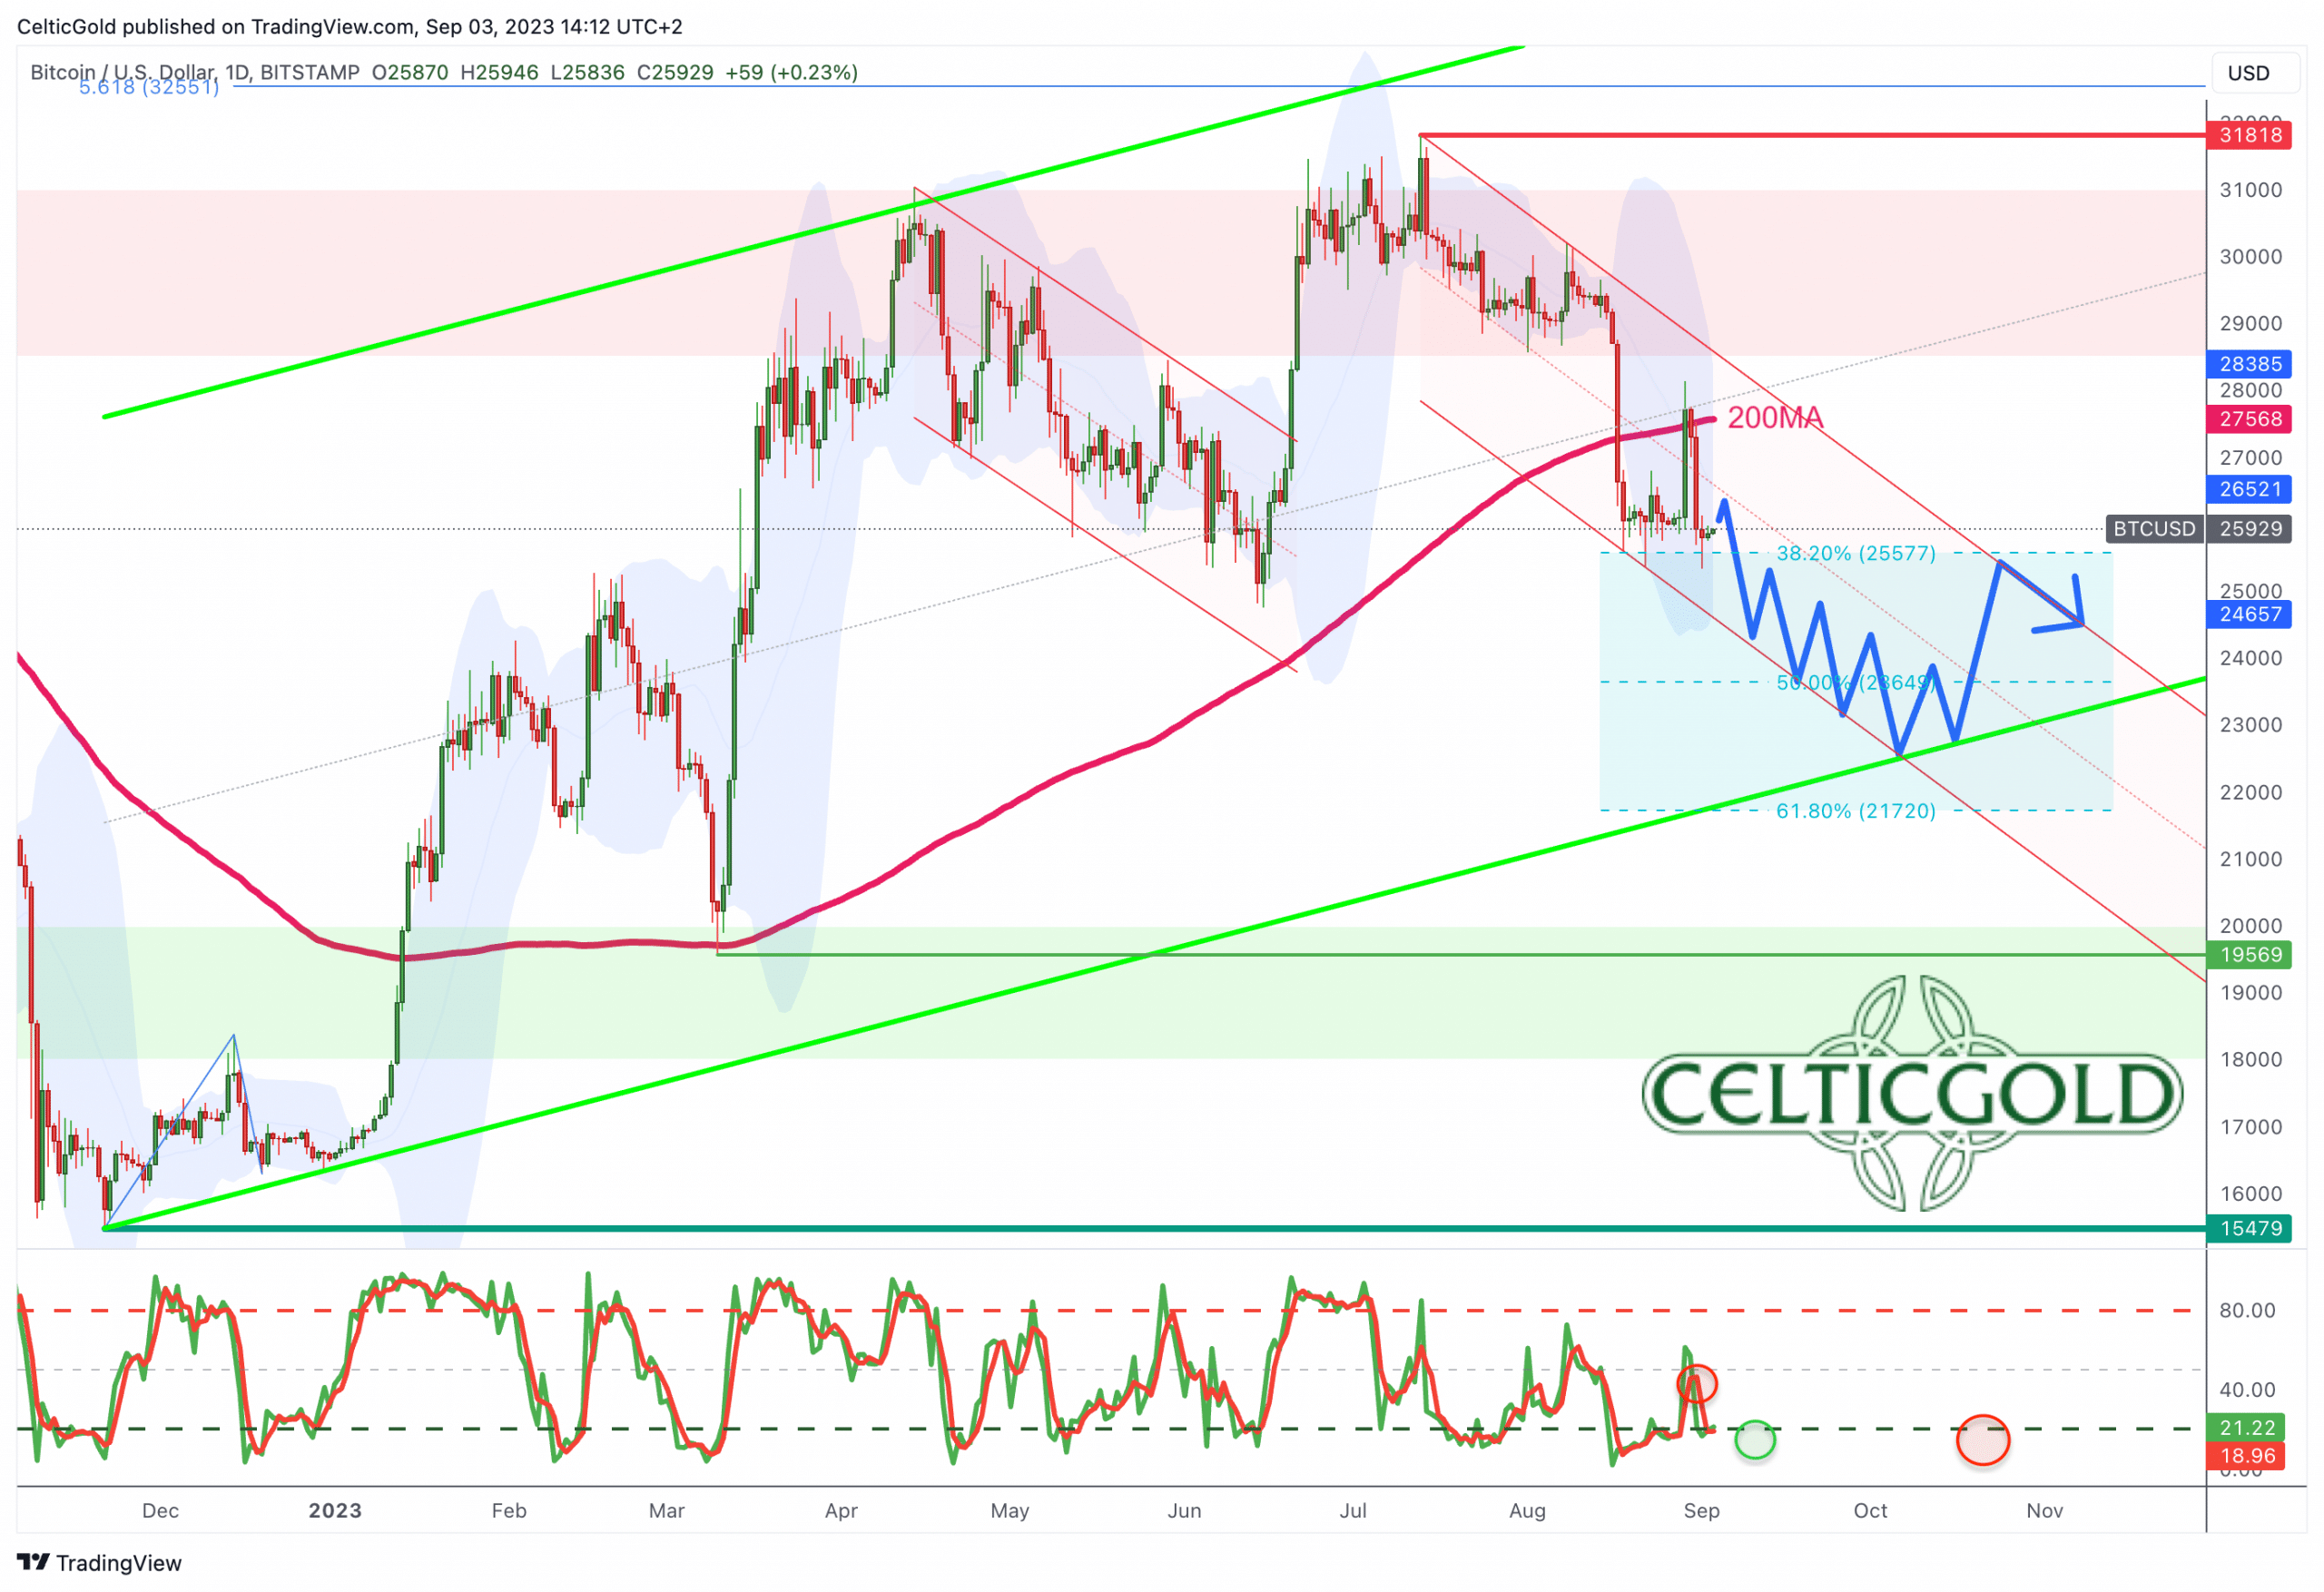
Bitcoin in USD, daily chart as of September 3rd, 2023. Source: Tradingview
Our expectation of a breakout to the upside was clearly wrong in mid-July. With USD 31,818, only a slightly higher high was achieved. And instead of further rising prices, Bitcoin sold off hard in the last six weeks. Without any resistance whatsoever the 200-MA (USD 27,543) was clearly breached. The bounce back to this moving average also failed during this week, activating another selling signal on the Stochastic oscillator. Hence, in the worst case, Bitcoin may target the 61.8% retracement at USD 21,720 USD in the coming weeks.
Overall, the daily chart is bearish, and supports are relatively scarce until around USD 22,000 USD. At best, the mid-June low around USD 24,750 could slow down the bears.
Sentiment Bitcoin – Sentiment is slightly fearful.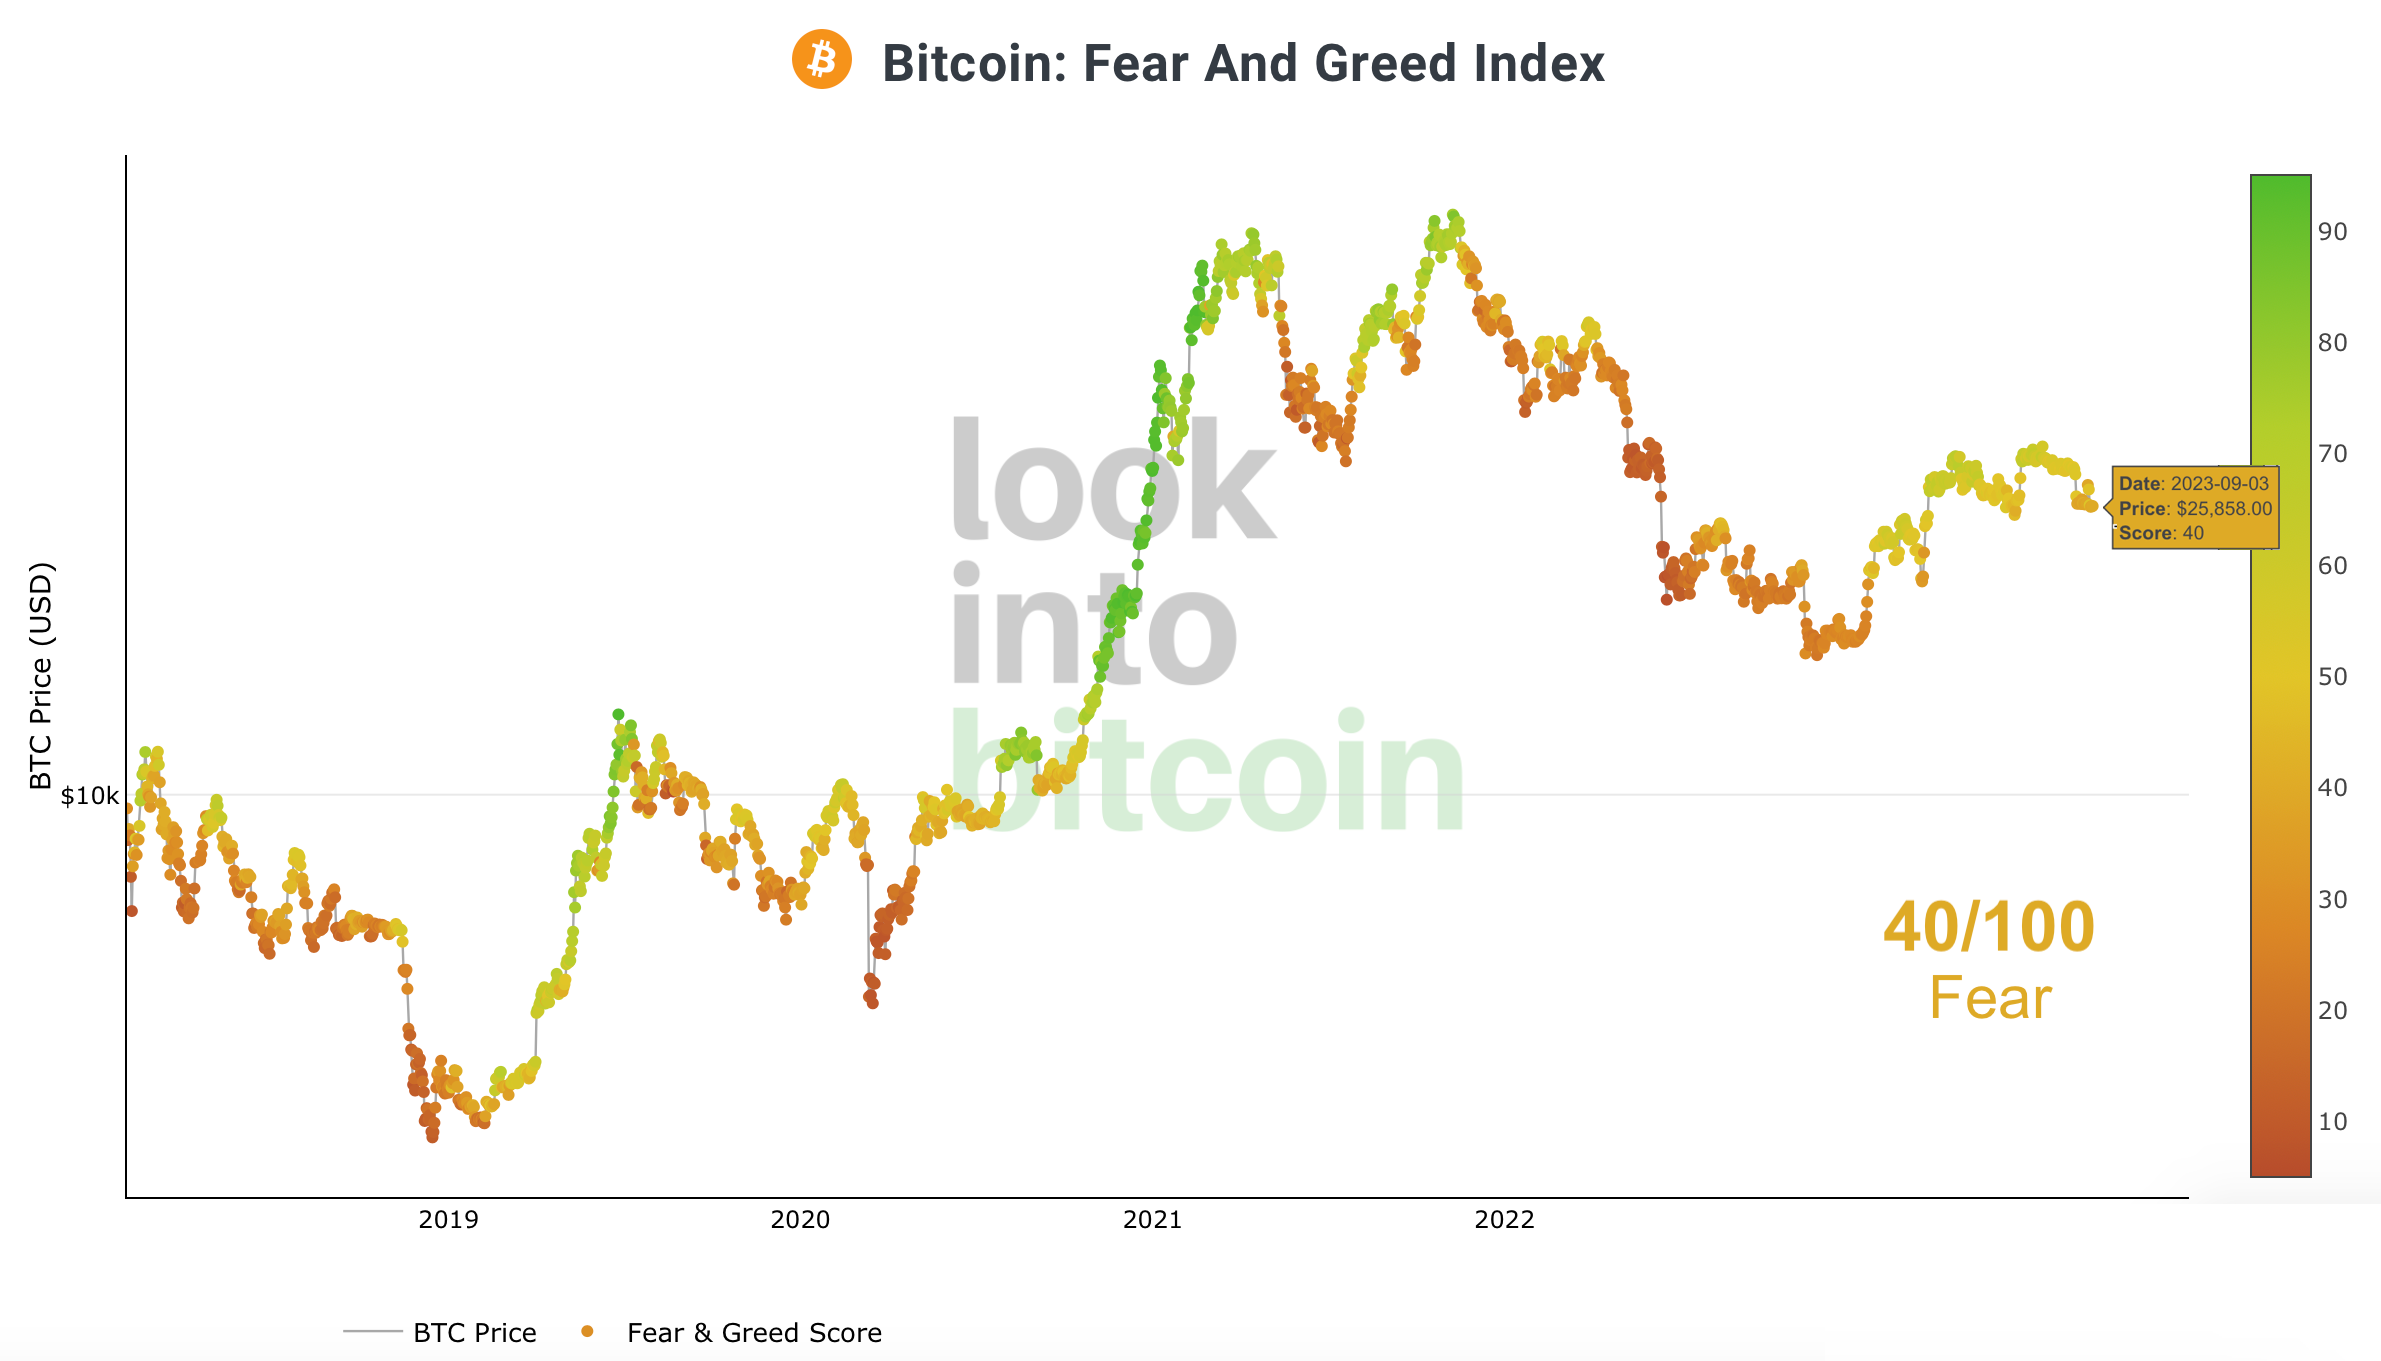 Crypto Fear & Greed Index long term, as of September 3rd, 2023. Source: Lookintobitcoin
The “Crypto Fear & Greed Index” is currently at 40 out of 100 points. Therefore, the sentiment in the crypto sector is slightly fearful.
In the bigger picture, sentiment has significantly recovered over the past nine months since the panic low in November 2022. However, the extreme euphoria from 2021 has by no means been reached. At the same time, the recent drop in sentiment has not yet lead to extreme fear and panic nor signaling a decisive end of the sentiment recovery.
In total, sentiment is neutral to slightly fearful and therefore not giving us a a clear indication or any contrarian signal.
Seasonality Bitcoin – Very unfavorable until mid-October
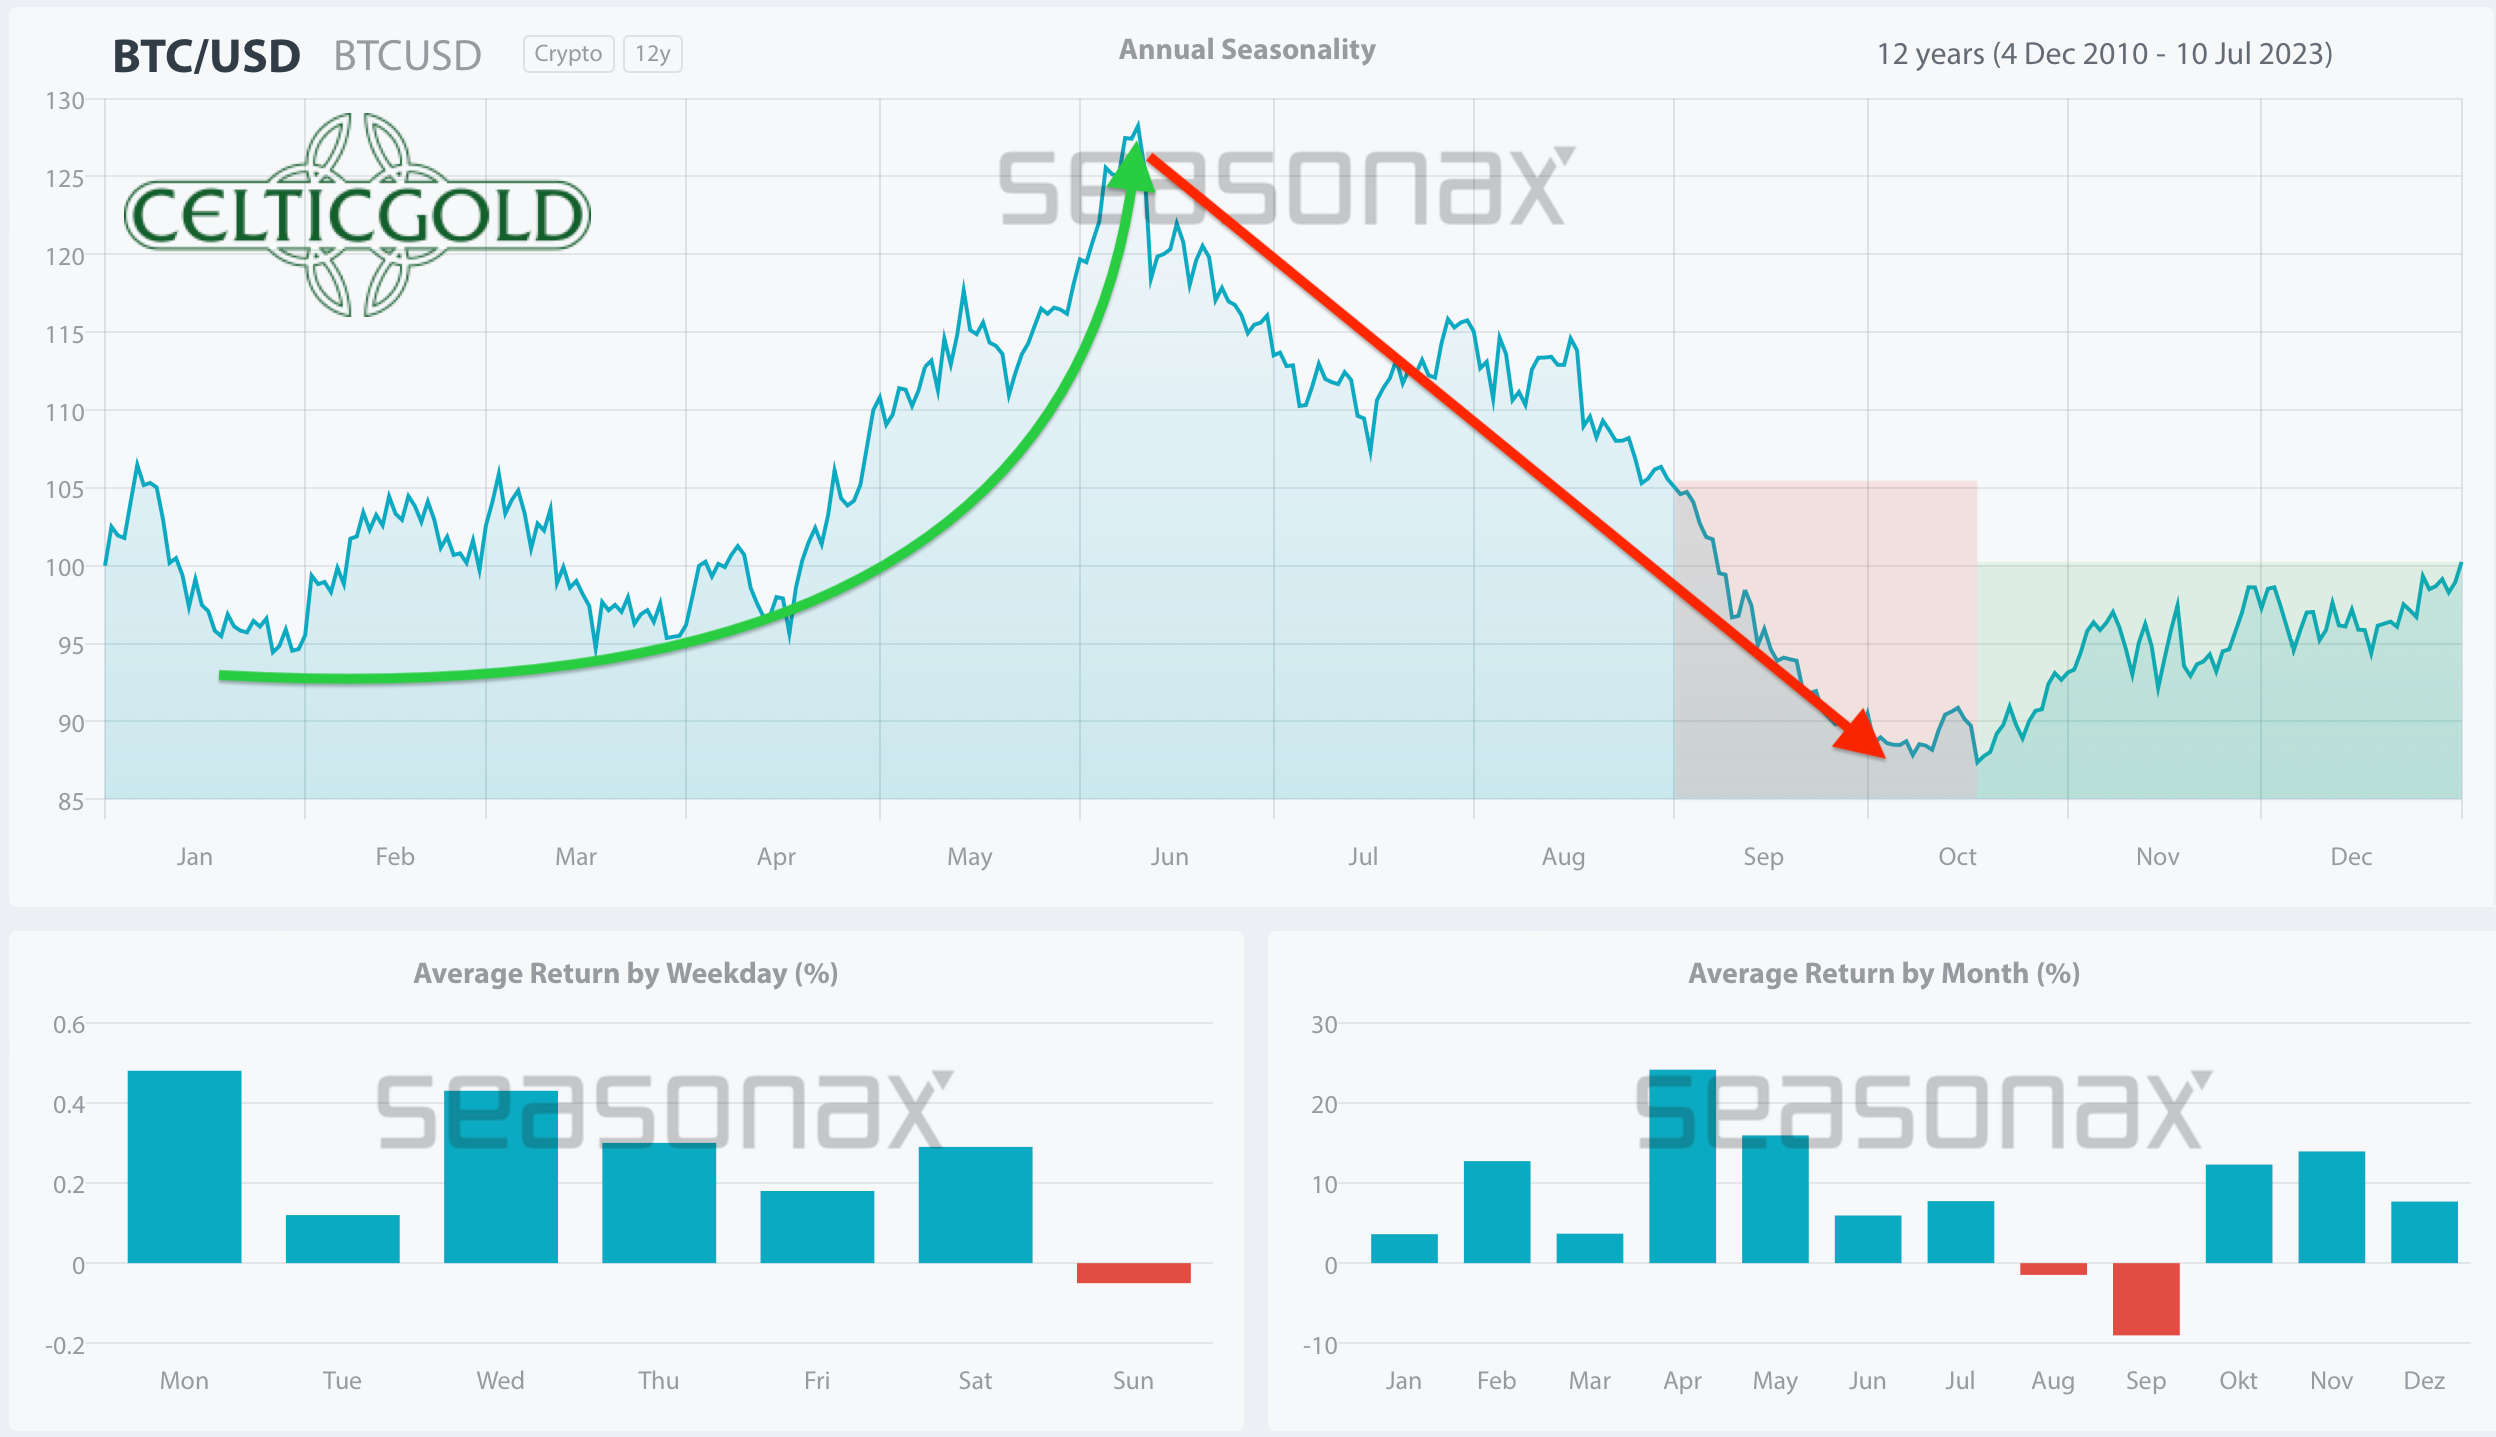
Seasonality for Bitcoin, as of August 30th, 2023. Source: Seasonax
The seasonal pattern for Bitcoin has been quite negative since mid-June and is expected to remain so until mid-October. Bitcoin typically experiences weakness, especially in September, before a bottoming process usually begins in October. Whether this pattern will hold true this year is, of course, uncertain. In any case, the statistics for the upcoming weeks advise caution and restraint.
In summary, seasonal cycle for Bitcoin is extremely unfavorable and clearly negative until mid-October.
Sound Money: Bitcoin vs. Gold
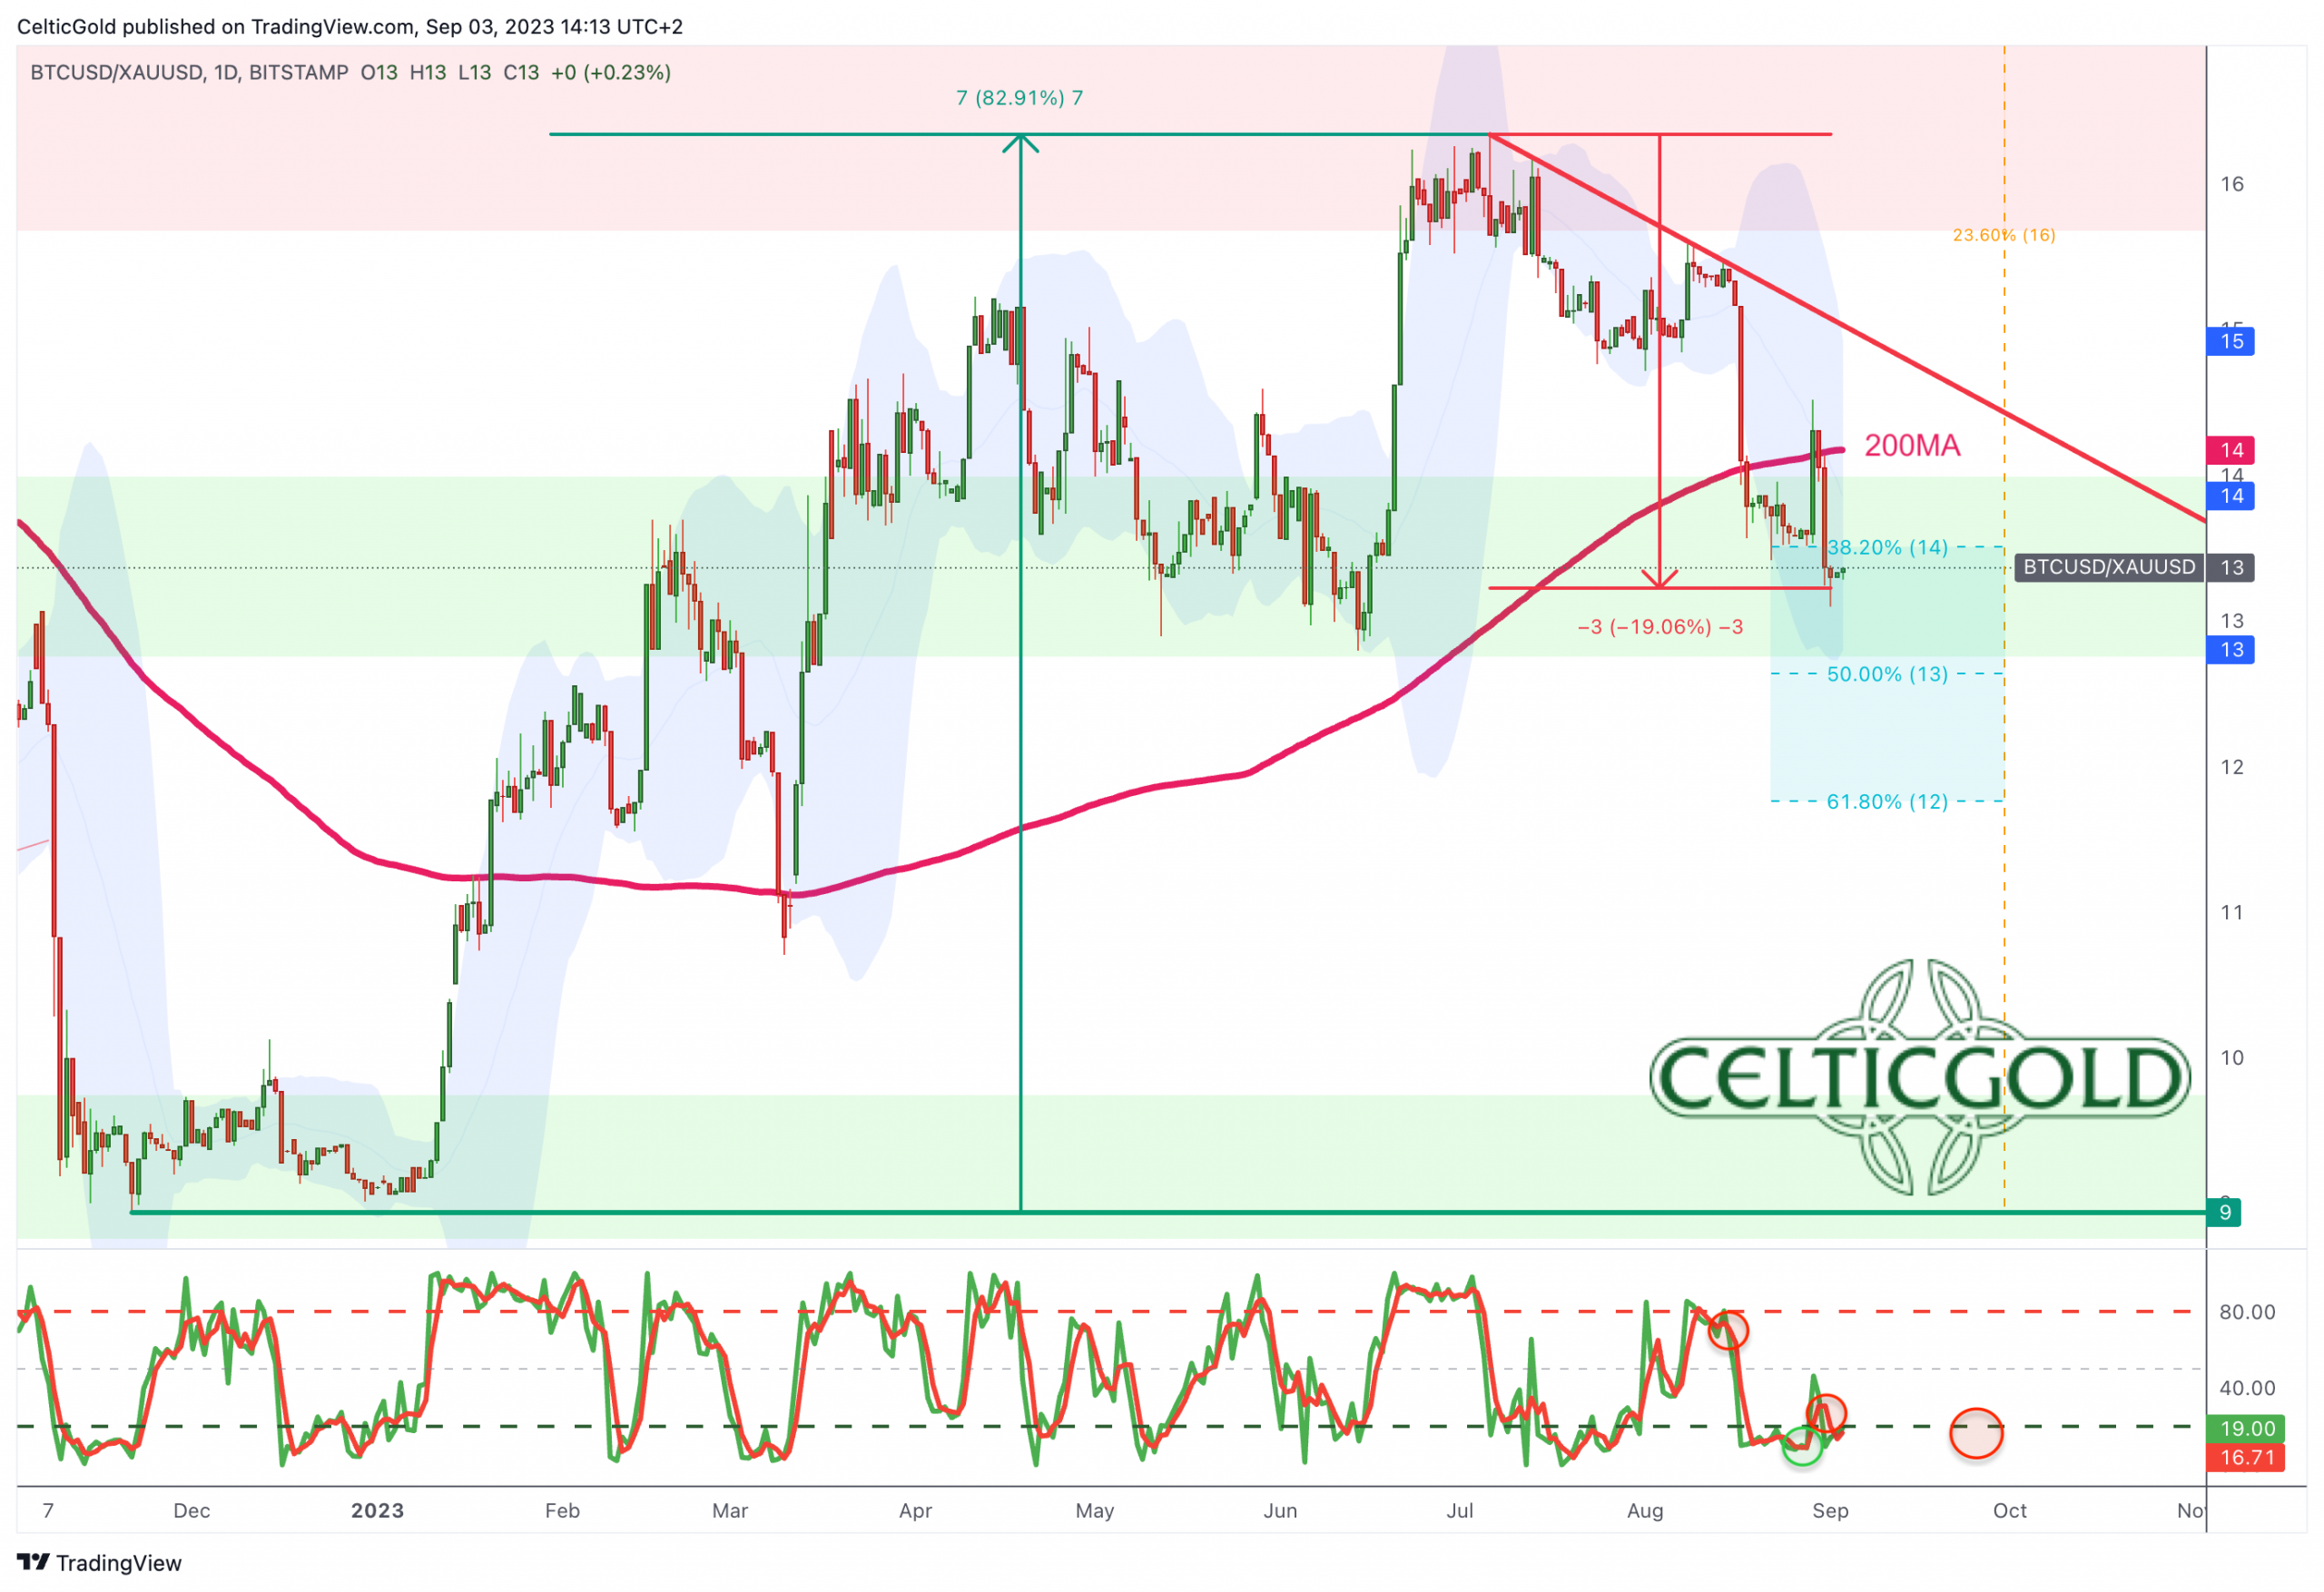
Bitcoin/Gold-Ratio, weekly chart as of September 3rd, 2023. Source: Tradingview
The strong US dollar has put pressure on gold and Bitcoin since mid-July. While the price of gold has been recovering significantly from its low around USD 1,885 USD over the last two weeks, Bitcoin remains under pressure.
With Bitcoin trading at around USD 26,000 USD and gold at USD 1,940, one currently needs about 13.4 ounces of gold to buy one Bitcoin. Conversely, one ounce of gold currently costs approximately 0.0746 Bitcoin. Despite the recent pullback, Bitcoin (+54.76%) is still the best performer since the beginning of the year, outperforming the price of gold (+5.45%) by a factor of 10!
Looking back, the Bitcoin/Gold-ratio reached its highest level in 13 months on July 6th, with values around 16.5. Since then, the ratio has retraced around 38.2% back to 13.6. As long as this low is not breached, the uptrend since the beginning of the year remains intact. On the upside, the ratio would need to break above the downtrend-line of the past few weeks, at around 15, to continue this uptrend. Overall, it seems more likely to see lower ratio values or, at best, a consolidation between the broad support zone (12.5 to 14.5) and the broad resistance zone (16 to 18.5).
Macro Update – The “Oath of Revelation” by central bankers will come sooner or later!
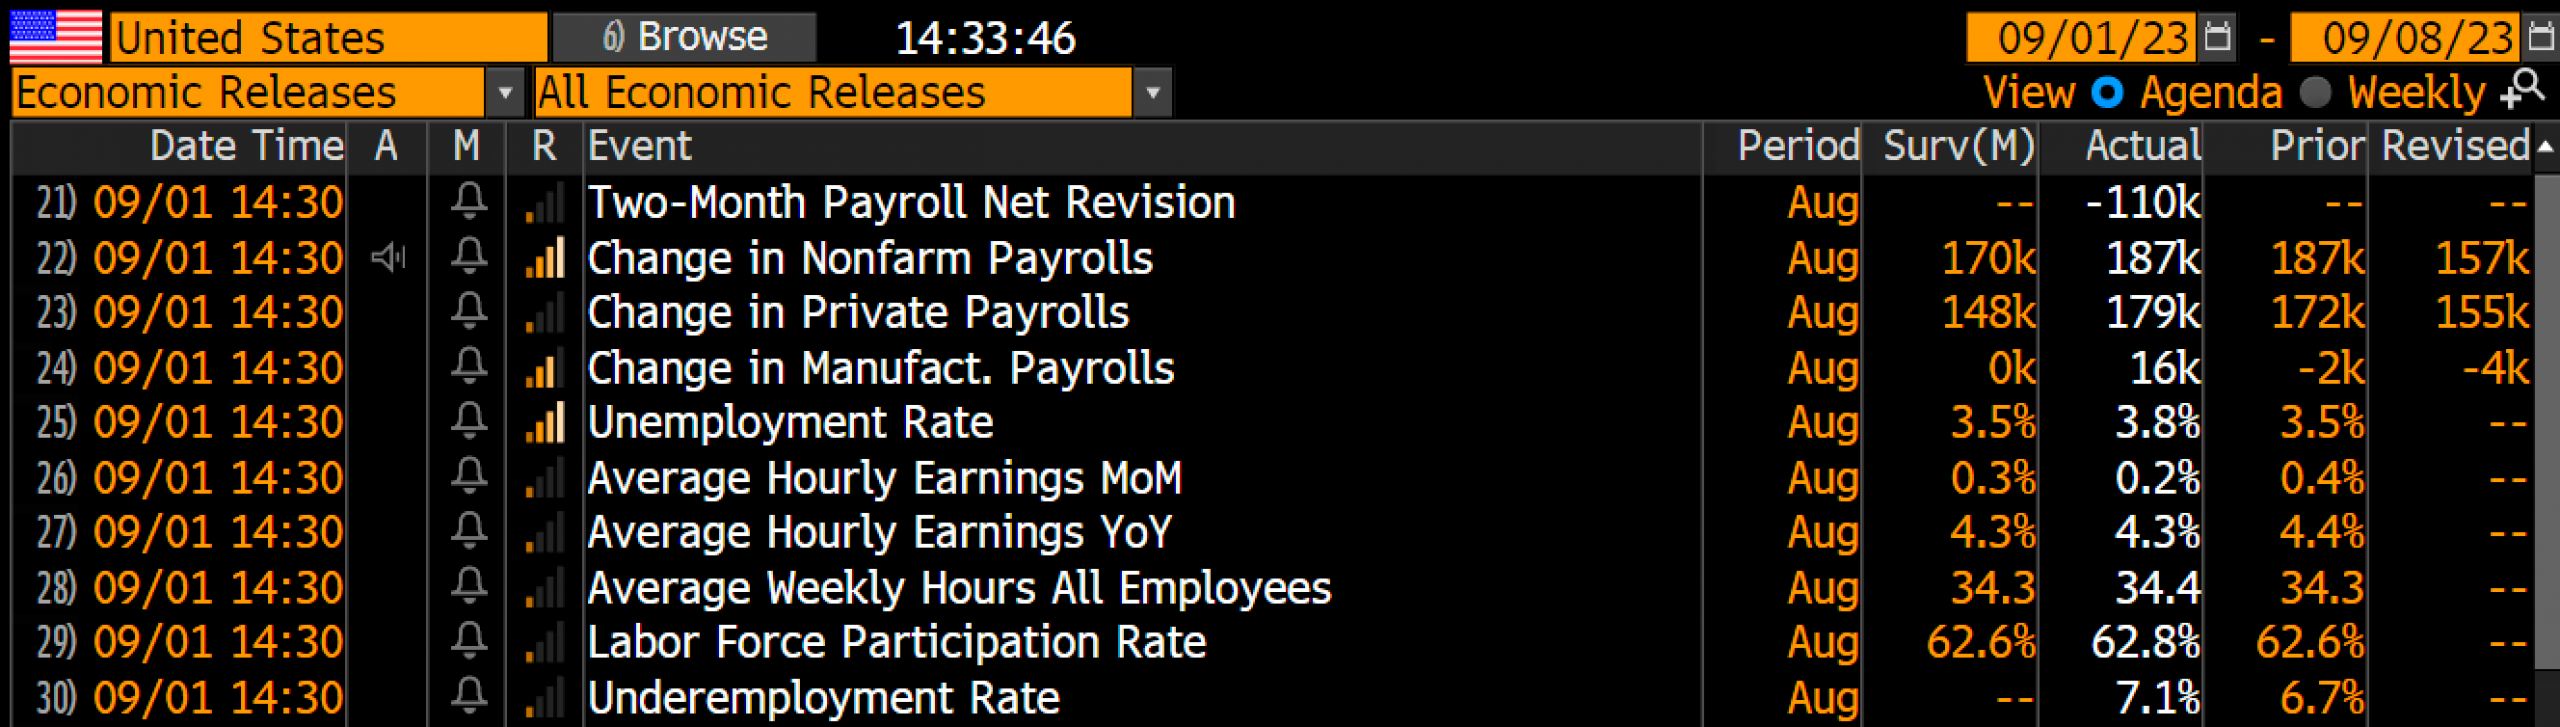
U.S. unemployment rate, as of August 31st, 2023. Source: Holger Zschäpitz
The US labor market continues to slow down. According to the latest US labor market report, the unemployment rate surged to 3.8% in August. At the same time, the number of non-farm payrolls increased by 187,000, slightly more than expected. As usual, job gains for the previous months of June and July were significantly revised downward, a well-known game played by government statisticians that increasingly questions the credibility of these labor market reports.
Overall, it is likely to be challenging for the Federal Reserve (FED) to further raise interest rates. Although the US central bank has had some success in combating the high inflation with its aggressive rate hikes, the official inflation rate in the US is still at 3.2%, which is considered too high. Unlike China and Germany, the US economy has shown some resilience to the withdrawal of cheap money so far. However, the effects of restrictive monetary policy typically take hold with a significant delay of about 12 to 20 months.
Distress within the US commercial real estate sector is steadily increasing.
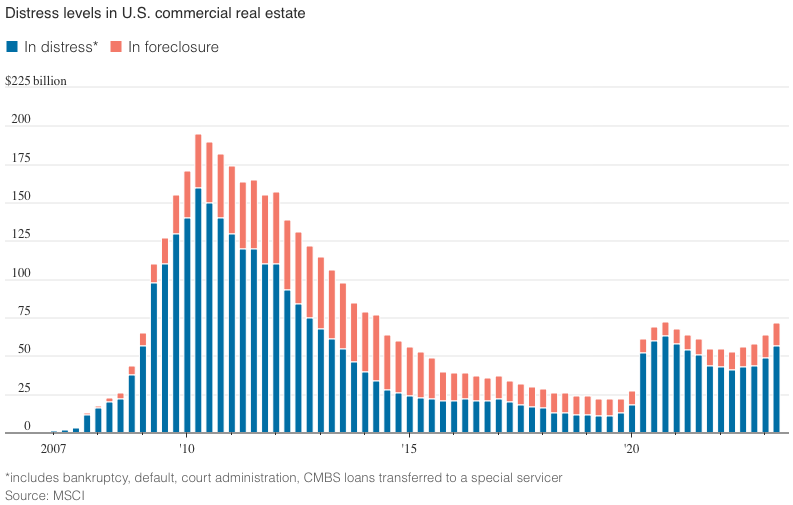
Distress levels in U.S. commercial real estate, as of April 30th, 2023. Source: MSCI
While the US real estate market, like in Germany, has largely entered a state of shock due to high interest rates, disruptions in the US commercial real estate sector continue to grow. According to real estate research firm Green Street, prices for American office and commercial properties have already fallen on average by 16% since their peak in March 2022. Unlike the 2008 financial crisis, when a lack of credit affected the value of all properties, the current downturn has hit some sectors of real estate much harder than others.
While foreclosures are still relatively rare, the total value of US properties in distress, in default, or already under special servicing reached nearly USD 72 billion already by end of April and is likely to have increased significantly since then. Including vulnerable properties, the pool of potentially troubled assets is more than twice as high.
KBW Bank Index down 8.78% in August
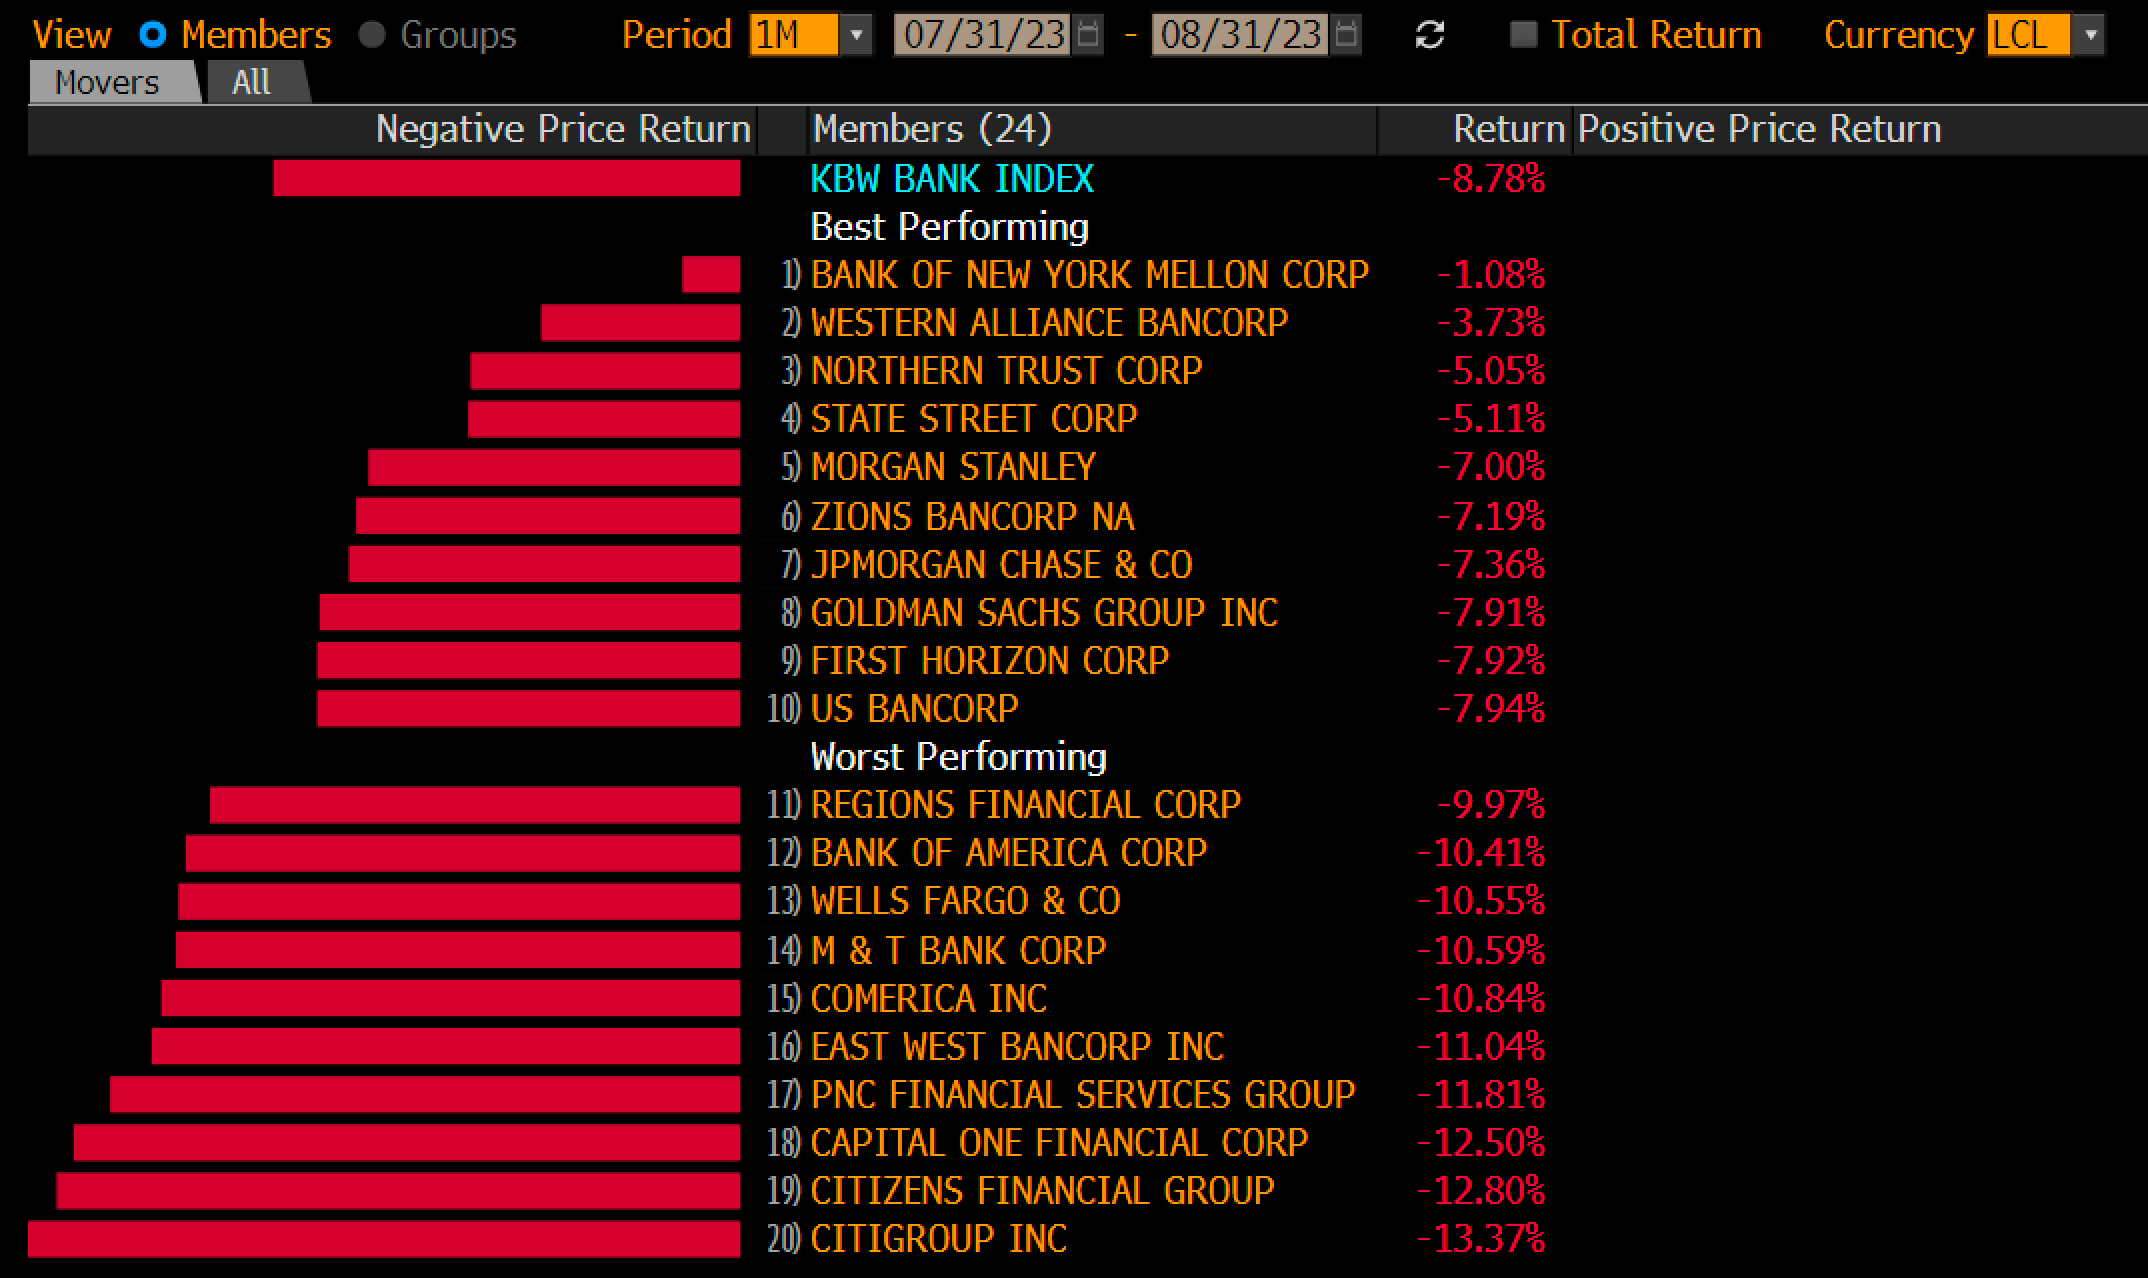
KBW Nasdaq Bank Index as of August 31st, 2023. Source: Holger Zschaepitz
For US regional banks, these commercial properties pose a significant risk because their exposure is dramatically higher than that of Wall Street’s big banks. Nevertheless, five months after the collapse of Silicon Valley Bank and Signature Bank, the KBW Bank Index fell significantly in August. The worst-performing bank stock was Citigroup, with a -13.4% decline.

Given this situation, a recession or a hard landing for the global economy is the logical consequence. However, it is challenging to predict exactly when the “oath revelation” of central bankers will come. Most likely, it will be within the next six months. The necessary amount of new liquidity that will be required to save the system again will surpass anything seen before and not only catapult precious metal prices to new heights but also breathe new life into Bitcoin.
However, as long as at least one of the proposed Bitcoin spot ETFs is not approved, Bitcoin is likely to remain under pressure or weak. A second support level in the range of USD 15,000 to USD 20,000 is possible before the next halving in April 2024 could create a supply shock.
Conclusion: Bitcoin – Emotional rollercoaster at critical support
With its rise of over 100% within around six months, Bitcoin once again outperformed all other asset classes. However, in the last six weeks, the situation has significantly deteriorated since reaching its yearly high at USD 31,818, as numerous sell signals have emerged.
As a result, the recovery since the November low appears quite modest considering the huge declines from the all-time high at USD 69,000 USD. The 38.2% retracement at USD 35,924 has not been reached so far, which is disappointing and a sign of weakness.
With the breach of support around USD 29,000 and the clear drop below the 200-day moving average (USD 27,542), Bitcoin is now trading in the lower half of its uptrend channel. The critical support at USD 26,000 is increasingly weakening.
Be very patient & cautious over the next six weeks
Considering the statistically unfavorable September weeks, we should anticipate a continuation of the correction towards USD 24,500 and USD 22,000 USD. At the lower edge of the uptrend channel, we may see a bottoming process and the beginning of a recovery around mid-October.
Analysis sponsored and initially published on September 1st, 2023, by www.celticgold.eu. Translated into English and partially updated on September 3rd, 2023.
Feel free to join us in our free Telegram channel for daily real time data and a great community. If you like to get regular updates on our gold model, precious metals, commodities, and cryptocurrencies, you can also subscribe to our free newsletter.
Disclosure:
This article and the content are for informational purposes only and do not contain investment advice or recommendations. Every investment and trading move involves risk, and readers should conduct their own research when making a decision. The views, thoughts, and opinions expressed here are the author’s alone. They do not necessarily reflect or represent the views and opinions of Midas Touch Consulting.

