


Gold – No clear turning point yet
In early May, gold once again failed to overcome the resistance around USD 2,070. Hence, the widely expected breakout has been once again postponed. Instead, our anticipated correction scenario has fully played out. Gold – No clear turning point yet.
Review
After a strong rally lasting about seven months, gold prices reached a high of USD 2,067 on May 4th. Like in August 2020 at USD 2,075 and March 2022 at USD 2,070, gold bulls once again failed to break through the same resistance zone. As a result, a correction took grip of the gold-market over the past seven weeks.
Initially, gold prices dropped down to USD 1,932. The temporarily oversold condition led to a recovery starting on May 30th. However, this recovery failed at the 38.2% retracement level around USD 1,983. Subsequently, a sluggish and tricky consolidation occurred between approx. USD 1,940 and USD 1,970. It was only in the past trading week that the bears finally achieved a more sustained breakthrough below the support at USD 1,940, resulting in a low during the Asian trading session on Friday morning around USD 1,910.
At the end of a last week as well as today, the gold bulls briefly staged a bounce, temporarily pushing prices up to USD 1,937 and USD 1,933. However, these recoveries so far were short-lived, and gold currently trades around last week’s close at USD 1,921, which was the lowest weekly closing price since mid-March.
Overall, the rather sluggish correction has so far resulted in a decline of USD 157 or around -7.6% in the gold market. Silver has been hit much harder with a decrease of -15.4%. Generally, the volatile yet trend-less price movements have made it challenging for investors and traders in recent weeks.
Year-to-date performance
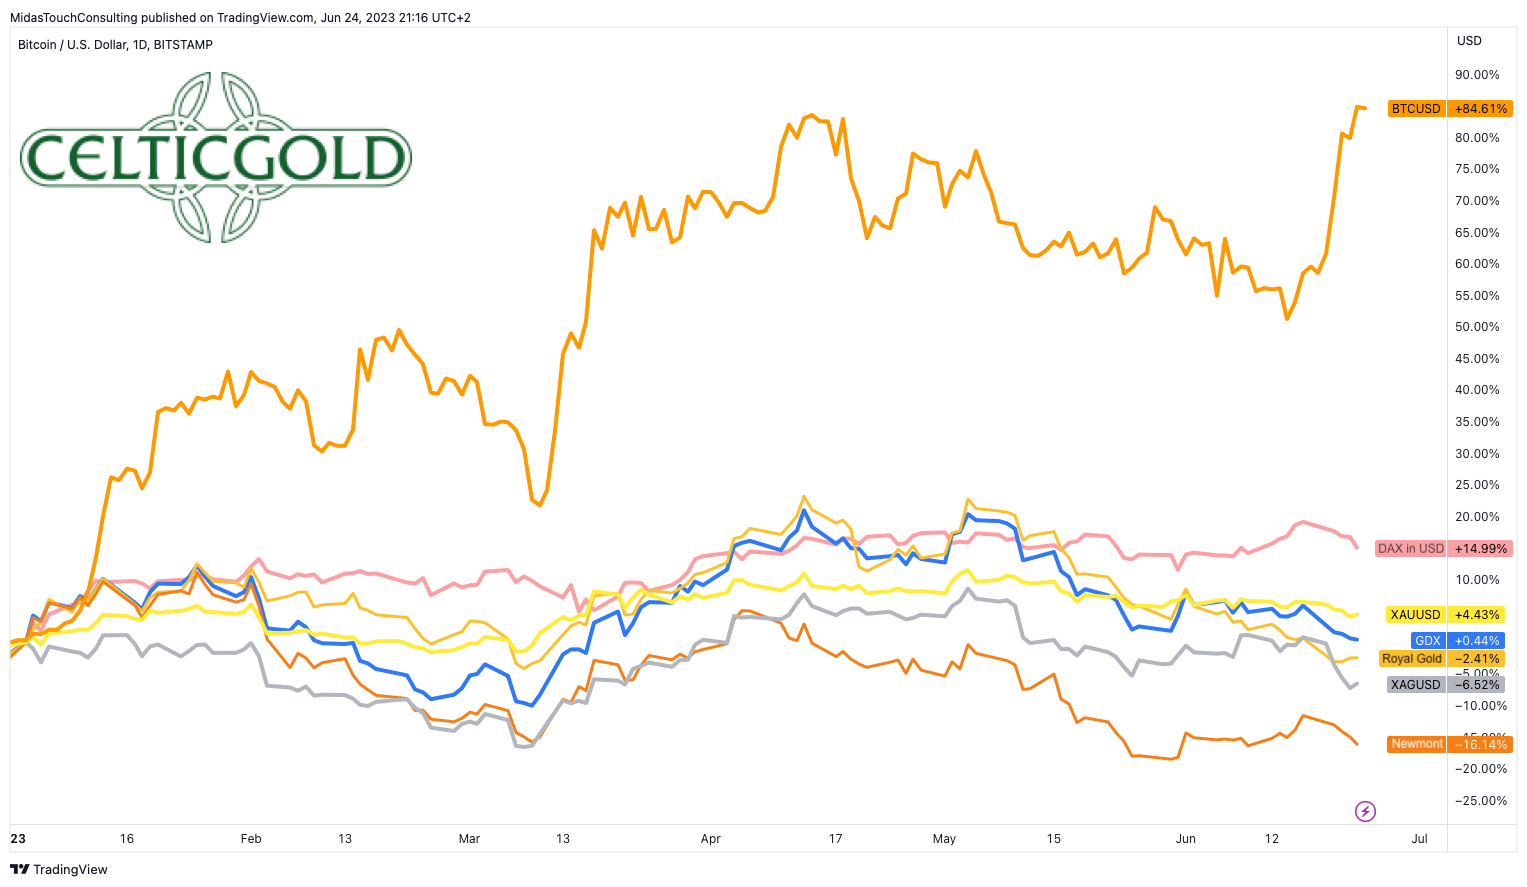
Ytd-performance of gold, silver, mining stocks, DAX, and Bitcoin in US-Dollar, as of June 24th, 2023. Source: Tradingview
As a result of the correction, gold had to give up most of its gains accumulated since the beginning of the year and currently shows a small increase of 4.4% when measured in USD. The year-to-date performance of the silver price even slipped into negative territory during the last trading week.
While the gold mining stocks ETF “GDX” shows hardly any change with +0.44% overall, individual mining stocks have been severely punished in recent weeks. This year’s performance so far is particularly disappointing for industry giant Newmont Corporation, for example. The rising gold prices in spring failed to generate significant momentum on the upside. The annual high was already reached at the end of January, and the stock has been in a downtrend despite strong profit margins since then. There is a -16.14% decline since the beginning of January. Apparently, the market is not particularly enthusiastic about the Newcrest acquisition, which is the largest in the history of the gold mining industry.
On the other hand, Royal Gold managed to hold relatively well with a -2.41% decline. The stock has a weighting of 3.4% in the GDX and is considered one of the top royalty stocks. However, gold mining stocks have been significantly disappointing this year overall. Nevertheless, there has been an increase in contrarian buying signals on the charts of individual stocks due to the oversold conditions.
In contrast, Bitcoin is significantly outperforming with a remarkable +84.7% gain and a factor of approx. 20x compared to the gold price. The recent steep price increase has further intensified its dramatic outperformance. Additionally, the DAX is surpassing the gold price on a USD basis with an almost +15% gain, too.
Chart Analysis – Gold in US-Dollar
Weekly chart: Active sell signal and still room to the downside
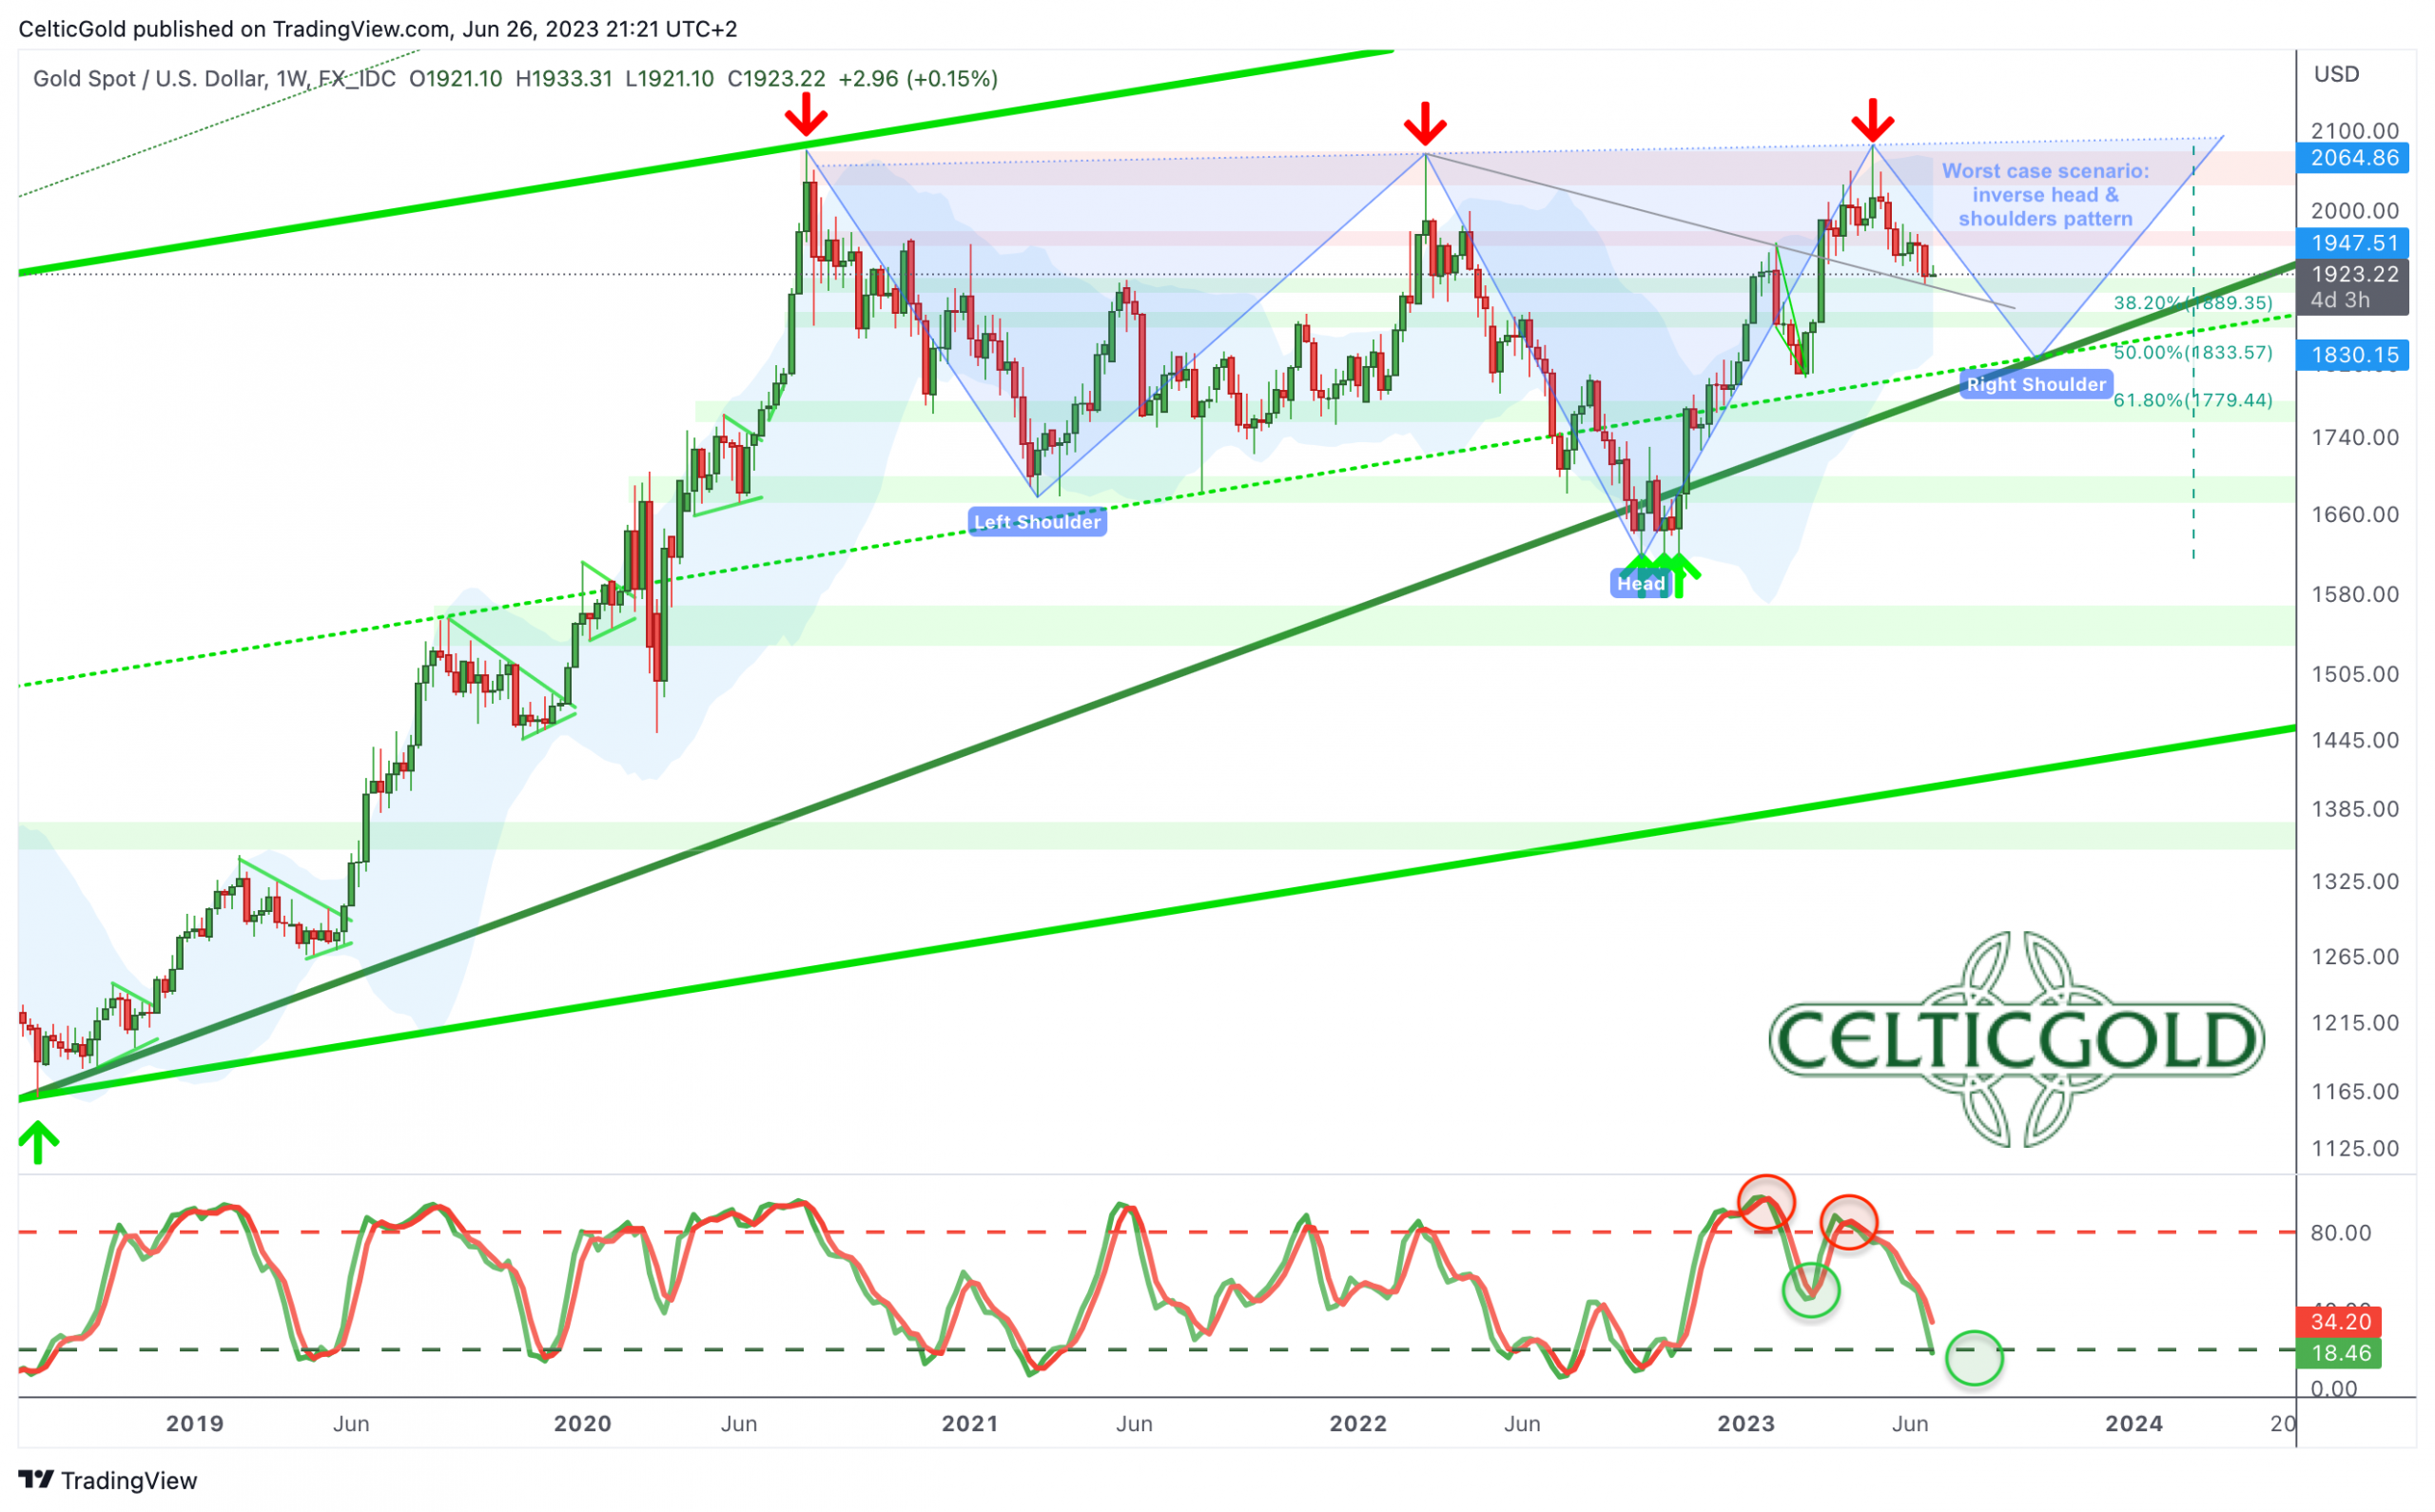 Gold in US-Dollar, weekly chart as of June 26th, 2023. Source: Tradingview
On the weekly chart, the seven-week correction has brought the gold price back to a former downtrend line. If this rather weak support around USD 1,912 does not hold, the 38.2% retracement of the previous uptrend would be the next target at around USD 1,890.
At the same time, the weekly stochastic indicator still has an active sell signal and has not yet reached its oversold zone. This suggests that the correction could continue for a few more weeks. In an extreme case, the lower Bollinger Band (USD 1,822) could also be reached, gradually moving up by about USD 5-10 per week.
In this context, it is necessary mentioning a potential “inverse head and shoulders formation” as a worst-case scenario. With the recent failure to break through the resistance around USD 2,070, a clear neckline has formed over the past three years. The correction last year provided the head of the inverse head and shoulders formation with prices around USD 1,615. What would be missing now is the right shoulder of this formation, which could form with a deep retracement ranging between USD 1,825 and USD 1,865. Hence, in this scenario, the current correction wave could potentially go much deeper. Afterwards, the gold price would need to move back towards the neckline around USD 2,070 to eventually break out. While this inverse head and shoulders scenario would suggest a continuation of the correction in the short term, it would provide a very bullish mid-term gold price target of approx. USD 2,525!
Overall, the weekly chart remains bearish, and there is no indication of an immediate trend reversal. Only the mentioned former trendline halted the sell-off last Friday so far.
Daily chart: Break of support at USD 1,940
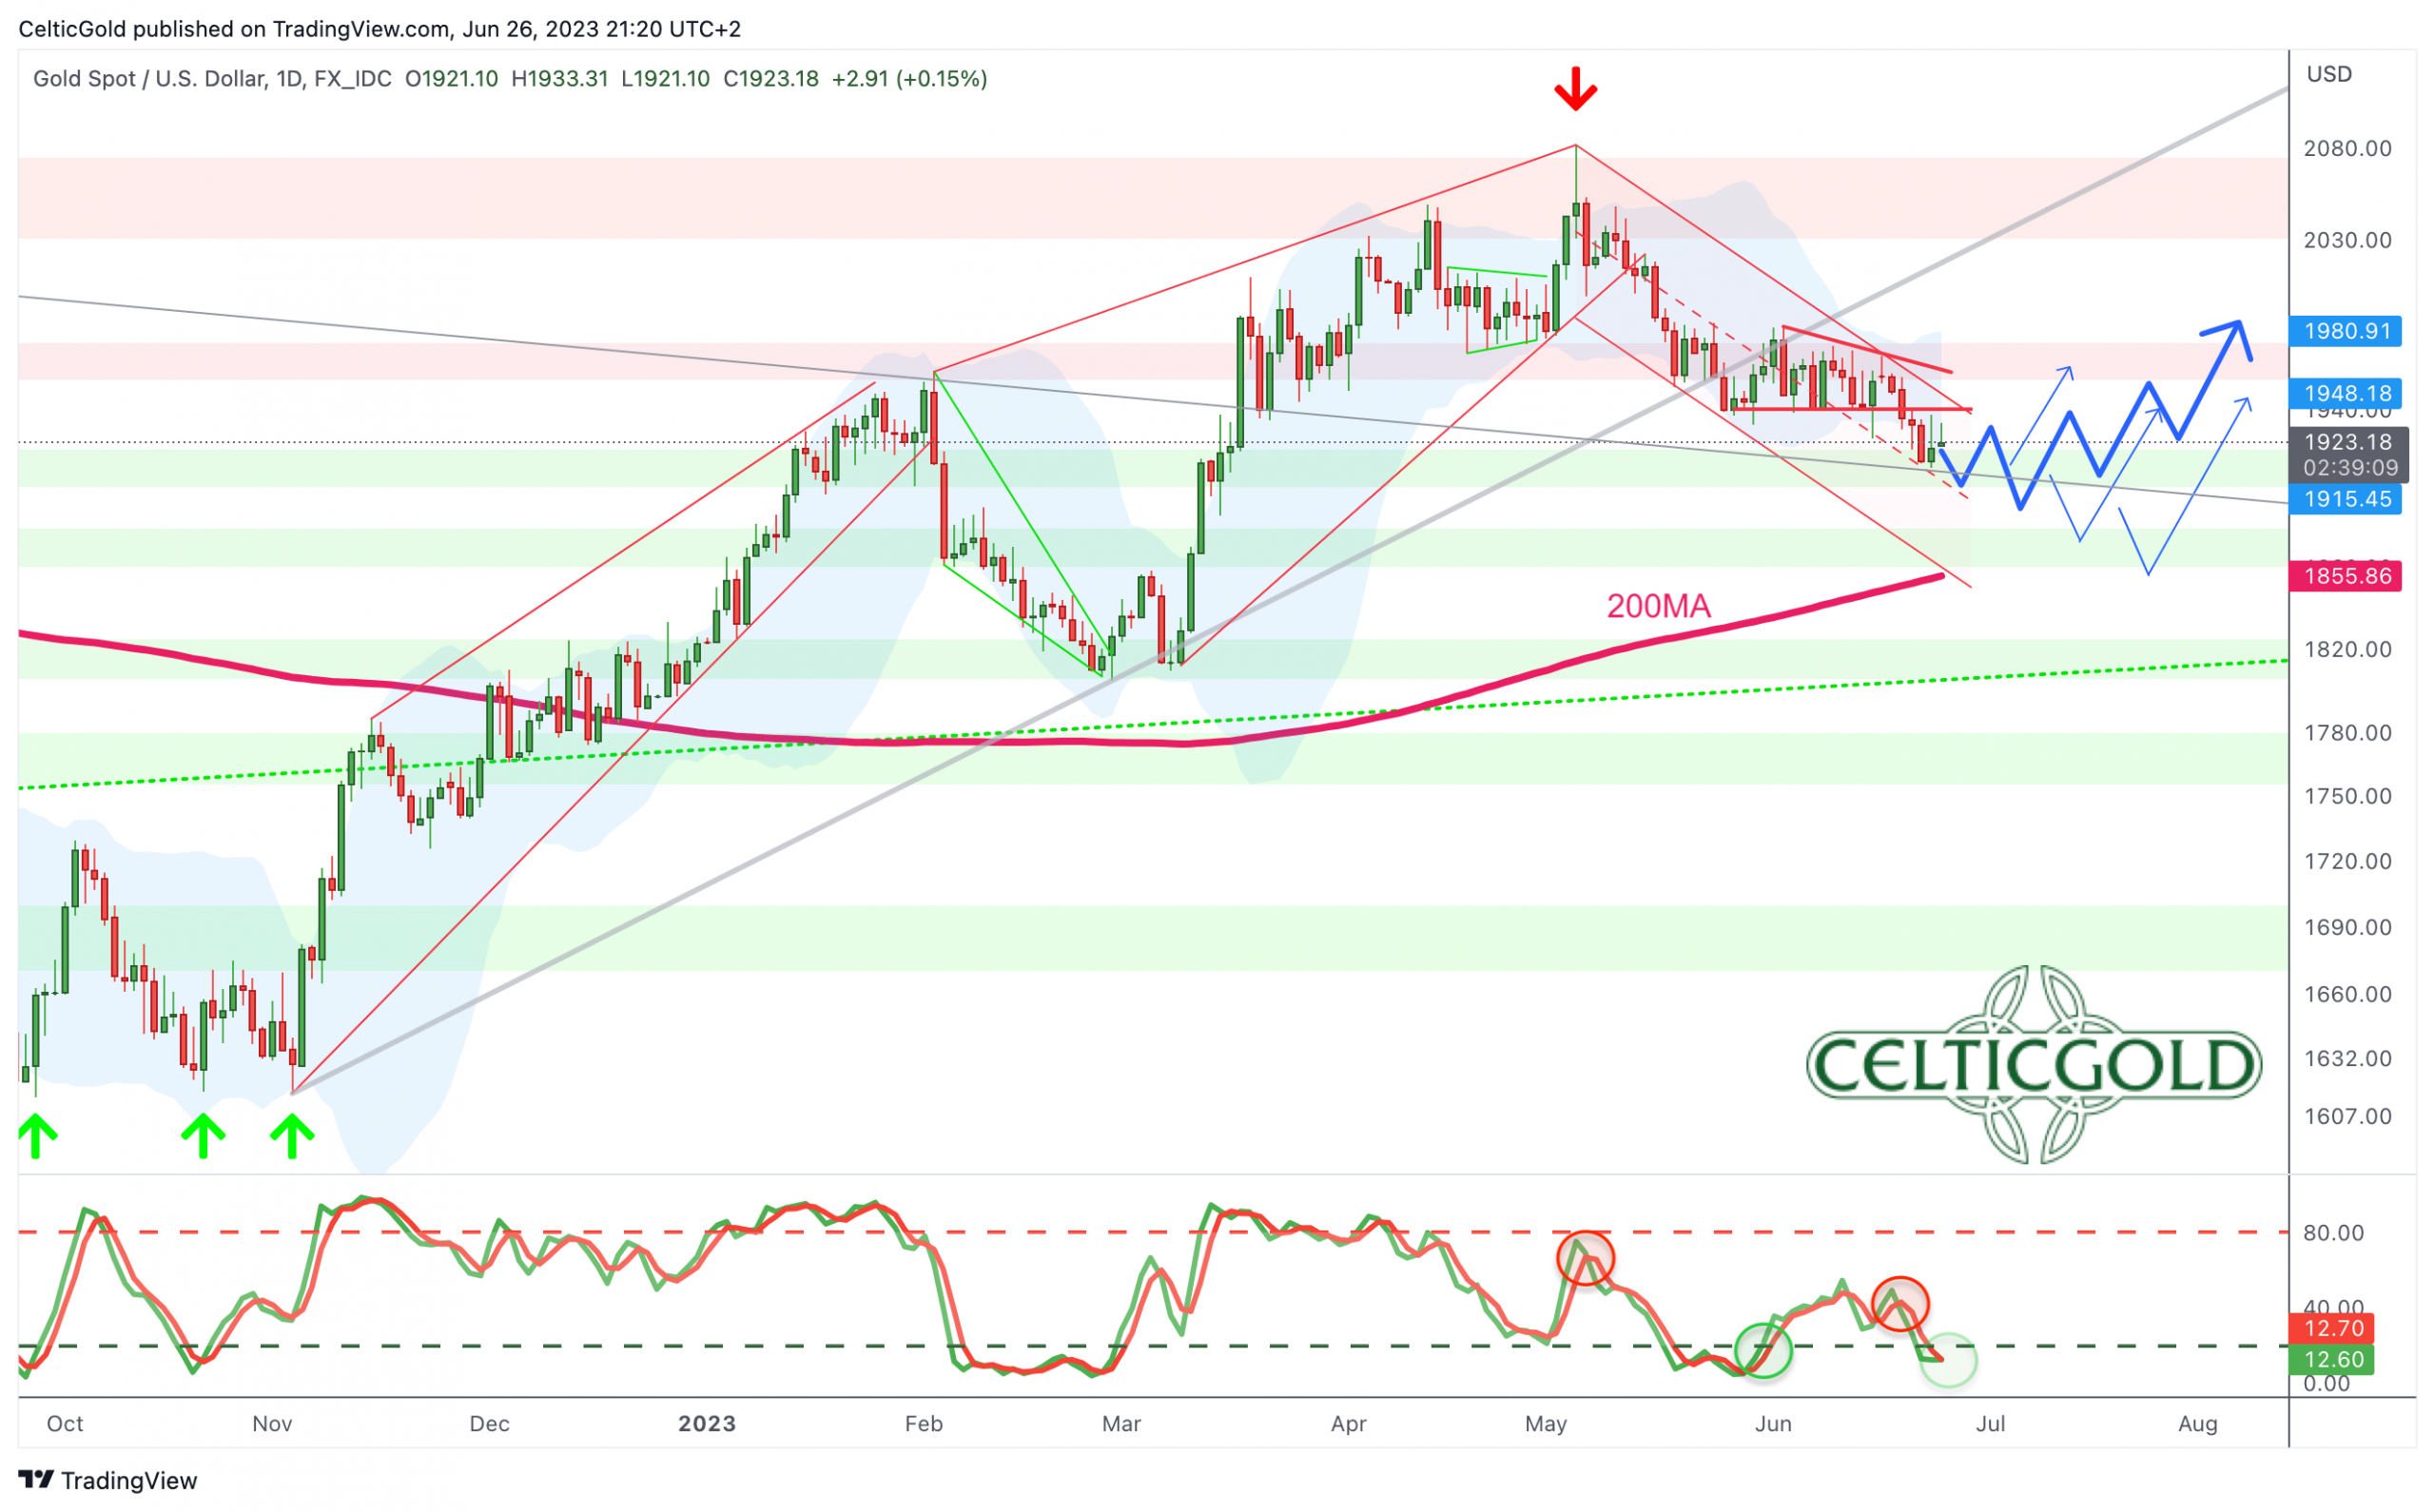
Gold in US-Dollar, daily chart as of June 26th, 2023. Source: Tradingview
On the daily chart, gold has closely followed our forecast from April 29th and reached our first target zone between USD 1,900 and USD 1,920 last week. The recent sell-off has pushed the stochastic indicator into oversold territory, and for lower prices, the bears would need to expand the lower Bollinger Band (USD 1,918). Therefore, the probabilities currently do not favor significantly lower prices in the short term. However, it is not entirely ruled out. Testing the psychological level of USD 1,900 and reaching the 38.2% retracement around USD 1,890 is still possible.
At the same time, the bulls have shown signs of life over the past three and a half weeks and have not completely given up. Hence, the relatively wide distance to the 200-day moving average (USD 1,854) could be gradually narrowed through a bottoming phase over time.
All in all, the daily chart is still bearish. The possibility of a recovery within a larger bottoming phase is offset by the remaining risk of a further downward slide. In any case, before breaking out to new all-time highs, the gold price would and should need to retest its 200-day moving average as a springboard, so to speak. In the case of a more complex consolidation between USD 1,900 and USD 2,000, this could also be delayed towards the later midsummer. However, we would prefer a direct sell-off towards approx. USD 1,875 as the conclusion of the ongoing correction.
Commitments of Traders for Gold – No clear turning point yet
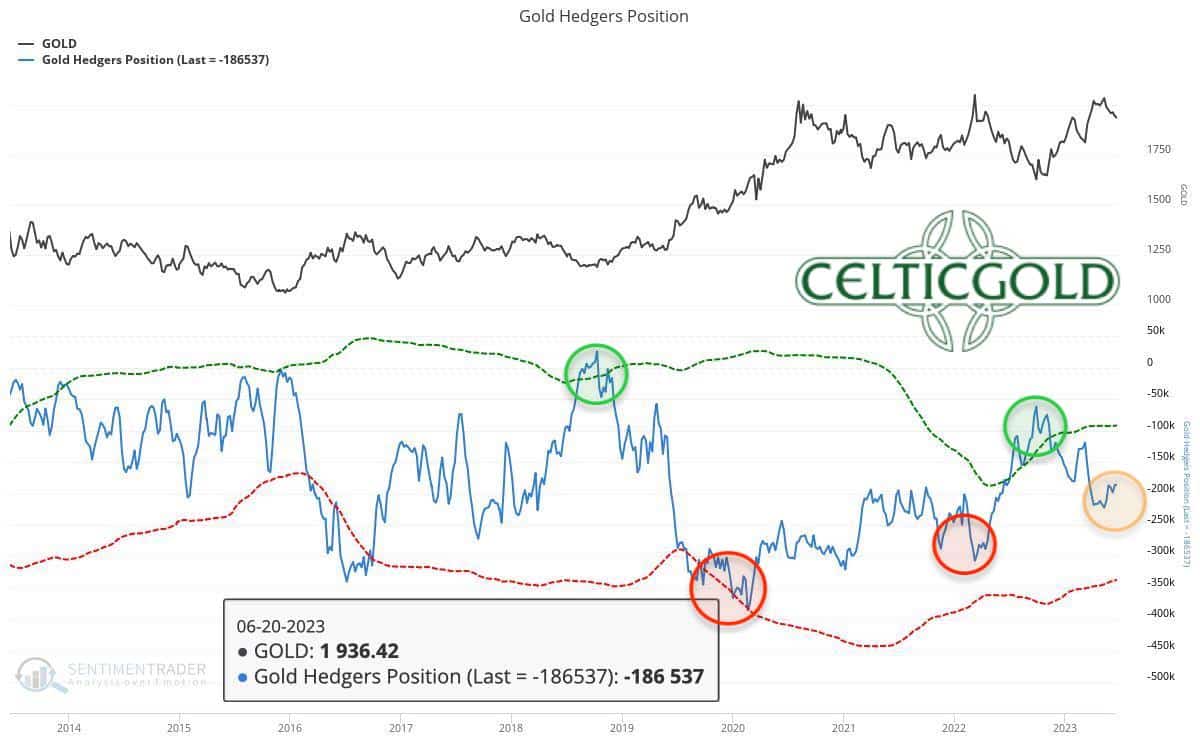
Commitments of Traders (COT) for gold as of June 20th, 2023. Source: Sentimentrader
According to the latest CoT report, commercial traders held a cumulative short position of 186,537 futures contracts on the gold price as of last Tuesday. In a long-term comparison, this short position is still relatively high despite the recent correction, which is unfavorable for further price development.
The current CoT report has a slightly bearish tone. It is only when the cumulative short position falls below 100,000 contracts that the analysis component turns bullish.
Sentiment for Gold – Neutral
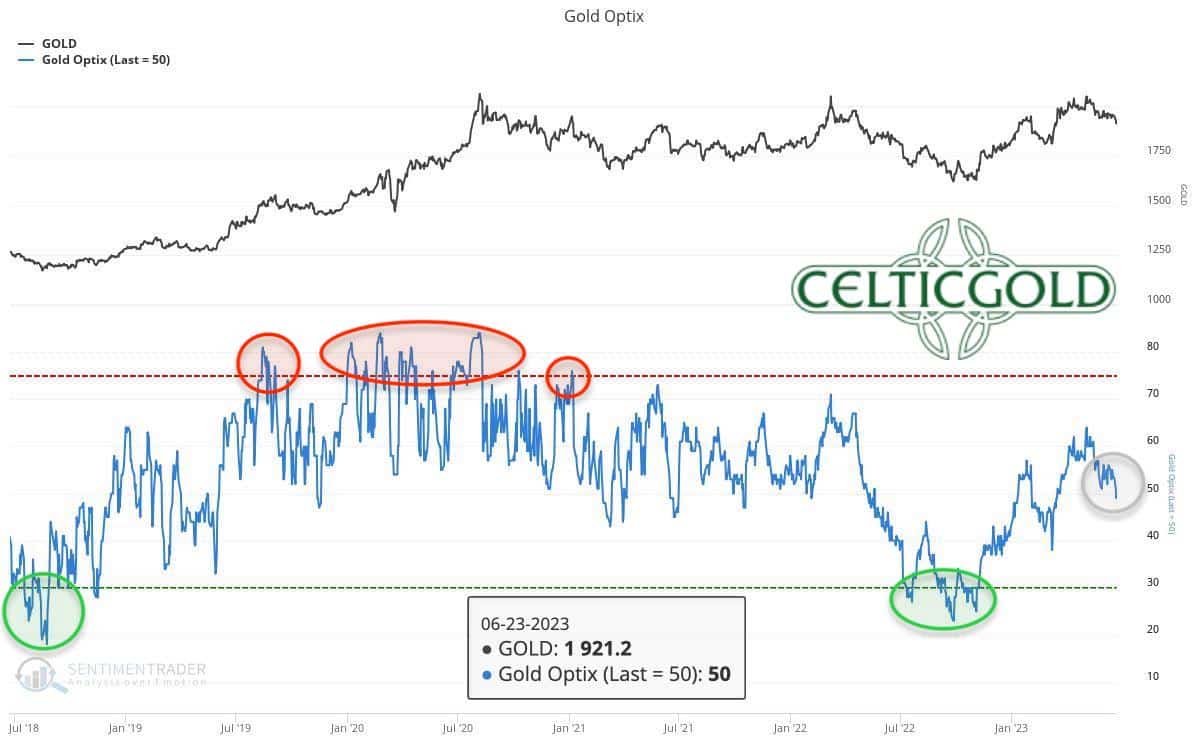
Sentiment Optix for gold as of June 23rd, 2023. Source: Sentimentrader
The sentiment among gold-market participants has cooled off significantly in recent weeks and is currently in the neutral zone. There is neither greed and euphoria nor fear and panic prevailing. Therefore, the sentiment analysis is only marginally helpful at present.
A complete cleansing of the gold market would only be possible through significantly lower prices, but such panic lows occur only every few years. The most recent contrarian opportunity of this kind occurred in early November 2022. At the same time, the current sentiment does not hinder a breakout to new all-time highs.
Overall, sentiment remains neutral.
Seasonality for Gold – No clear turning point yet
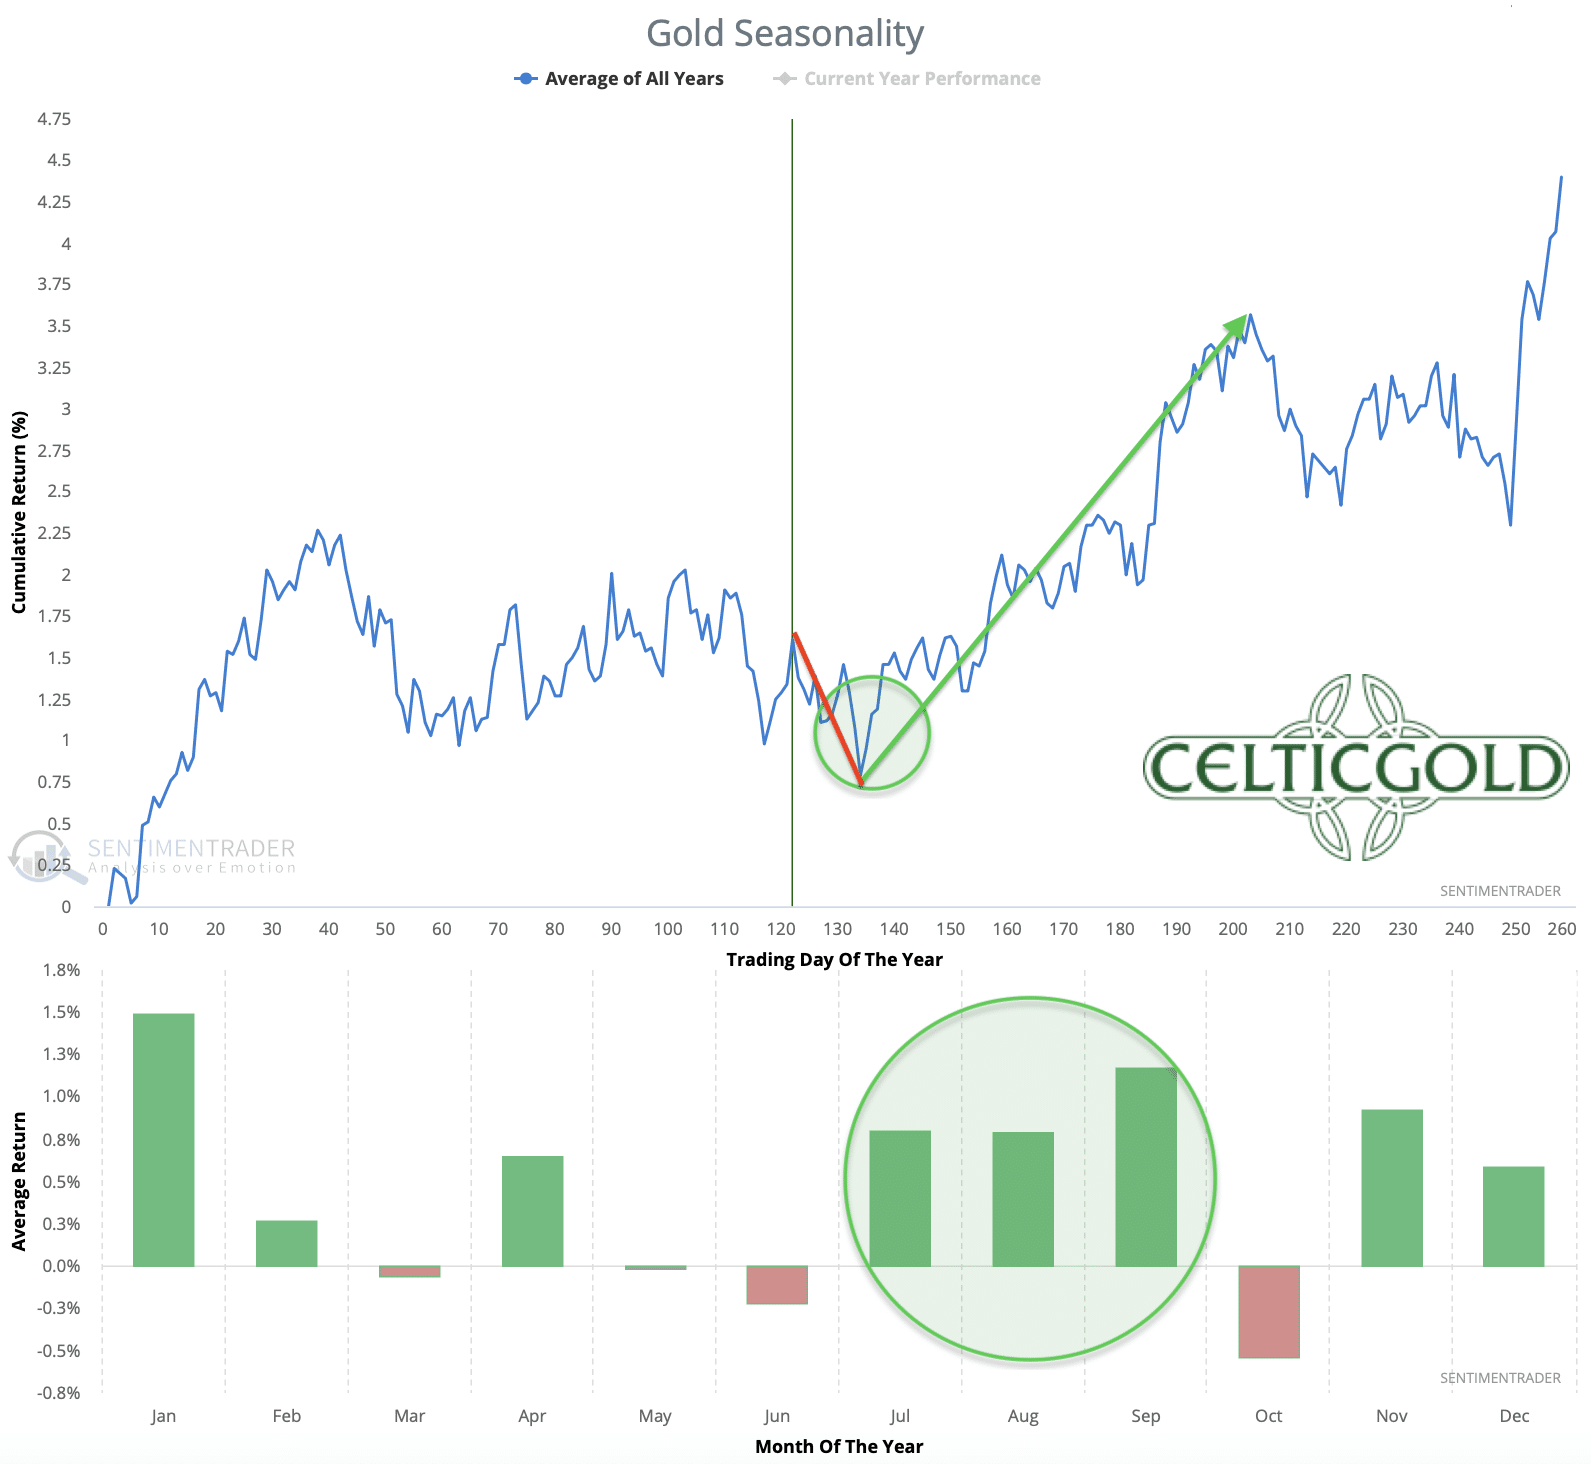
Seasonality for gold over the last 54-years as of June 23rd, 2023. Source: Sentimentrader
Statistically speaking, the unfavorable spring phase is slowly but surely coming to an end. However, this year, gold reached its typical spring high rather late in early May, whereas in the past 54 years, it mostly occurred between late February and late March. Therefore, it would not be surprising if the seasonal turning point were to be delayed by a few weeks.
At the same time, the correction has been ongoing for seven weeks, thus fulfilling the minimum time requirement. However, compared to the seven-month rally, the correction has only lasted seven weeks. From this perspective as well, a low point and trend reversal still appear somewhat premature.
In summary, the seasonal component will gradually shift to bullish in the next two to six weeks.
Macro update – Liquidity remains the pivotal piece of the puzzle.
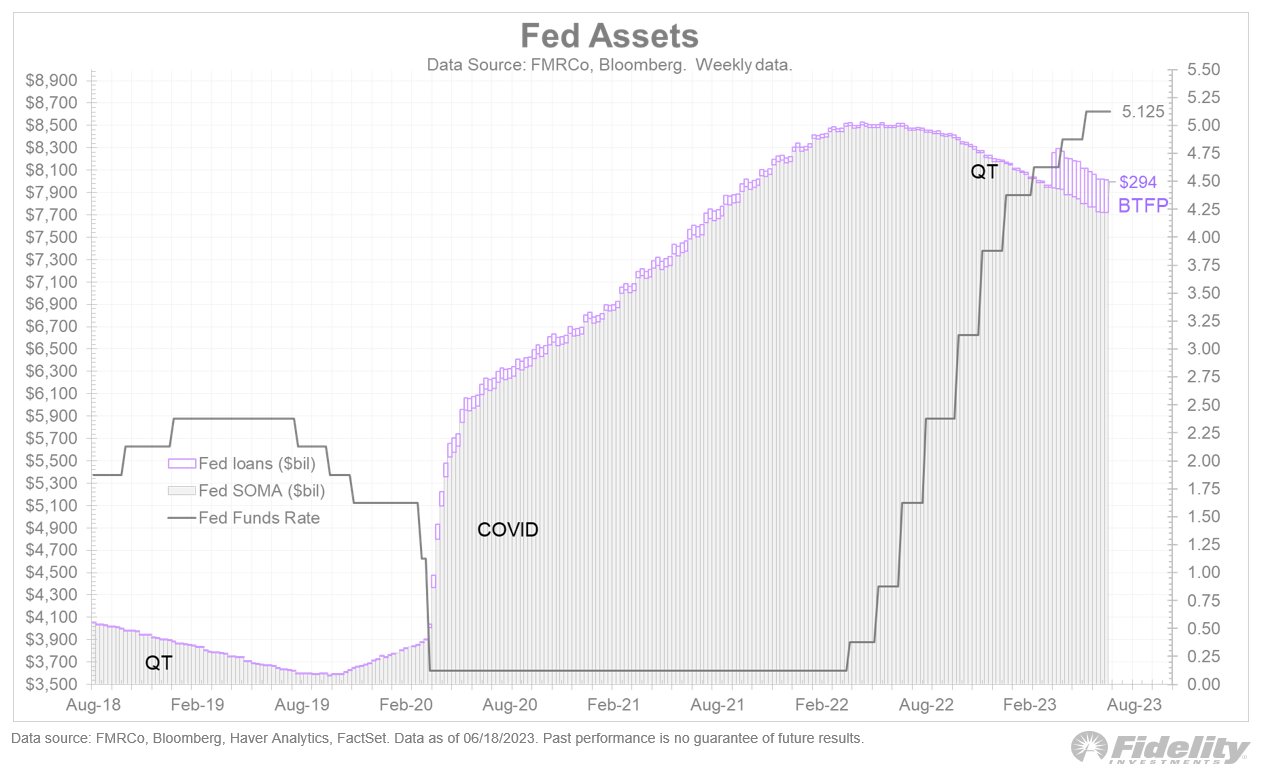
Fed Assets, as of June 22nd, 2023. Source: Fidelity
Following its latest FOMC meeting on June 14th, the US central bank, for the first time since mid-March 2022, did not raise interest rates but announced a pause. Thus, the most aggressive interest rate hiking cycle in history has come to a temporary halt. Since the Fed first raised its benchmark interest rate by 25 basis points 14 months ago, it has now increased to 5.25%. Starting from the initial 0.25%, this represents a 2,000% increase in the US benchmark interest rate! Nonetheless, the Fed continues to affirm that interest rates will remain high for a longer period and the next rate hike is likely to take place in July.
However, the financial markets seem unfazed by the “Peak Fed” and are looking beyond it. Instead, the futures curve consistently reflects an impending policy shift. Liquidity remains the pivotal piece of the puzzle, despite the substantial rescue packages implemented in March. While financial conditions have temporarily eased and stock market prices have skyrocketed in some cases, the underlying problem of excessively rapid interest rate hikes remains unresolved. Looking back to the 2008 financial crisis, the Fed had concluded its rate hiking cycle in mid-2006. However, the bloodbath occurred only 1.5 years later.
Overall liquidity is not (yet) hitting the headwind that was so widely expected.
For the gold price, this means that an immediate trend reversal and the start of the widely anticipated breakout rally are not yet assured. If the stock markets encounter significant problems, the bottom in the gold market could persist until September, October, or even longer. However, once the Fed announces a reversal in its monetary policy, the gold price should take off.
Conclusion: Gold – No clear turning point yet
Precious metal prices have corrected as expected in recent weeks. Our first price target zone between USD 1,900 and USD 1,920 has already been reached. However, our second price target zone still awaits between USD 1,850 and USD 1,875. Given the presence of the 200-day moving average in that range, along with the weekly chart that is not yet oversold, including a potential inverse head and shoulders formation, and the questionable overall liquidity in the financial system, there is no reason to declare the final bottom just yet.
However, if the gold price manages to establish a solid base for several weeks around and above USD 1,900, we would likely shift fully into the bullish camp by mid or late July. In the broader picture, the gold market is indeed primarily and correctly focused on when the breakout above USD 2,075 will finally occur.
“Gold – No turning point yet” – analysis initially published on June 25th, 2023, by www.celticgold.de. Translated into English and partially updated on June 26th, 2023.
Feel free to join us in our free Telegram channel for daily real time data and a great community. If you like to get regular updates on our gold model, precious metals and cryptocurrencies you can also subscribe to our free newsletter.
Disclosure:
This article and the content are for informational purposes only and do not contain investment advice or recommendations. Every investment and trading move involves risk, and readers should conduct their own research when making a decision. The views, thoughts and opinions expressed here are the author’s alone. They do not necessarily reflect or represent the views and opinions of Midas Touch Consulting.

