


Silver’s fuse is about to be lit
The average investor is news-driven. As much as the Federals Reserve (the Fed) might be criticized, this large investor group is not commonly doubting news. In other words, it has generally believed the Fed’s narrative that inflation is transitory. The bad news is rarely released shortly before Christmas. However, it would not surprise if tapering started in early 2022. And maybe not just begin but be more aggressive throughout the year as expected. With this, the narrative will change from a “we are not worried, it is transitory” to a “we need to deal with” regarding inflation. Therefore, this could easily be the fire to the fuse of the Silver rocket. We now see early signs of such a lift-off in price in recent silver price movements. Silver’s fuse is about to be lit.
Silver in US-Dollar, daily chart, low-risk entry points:
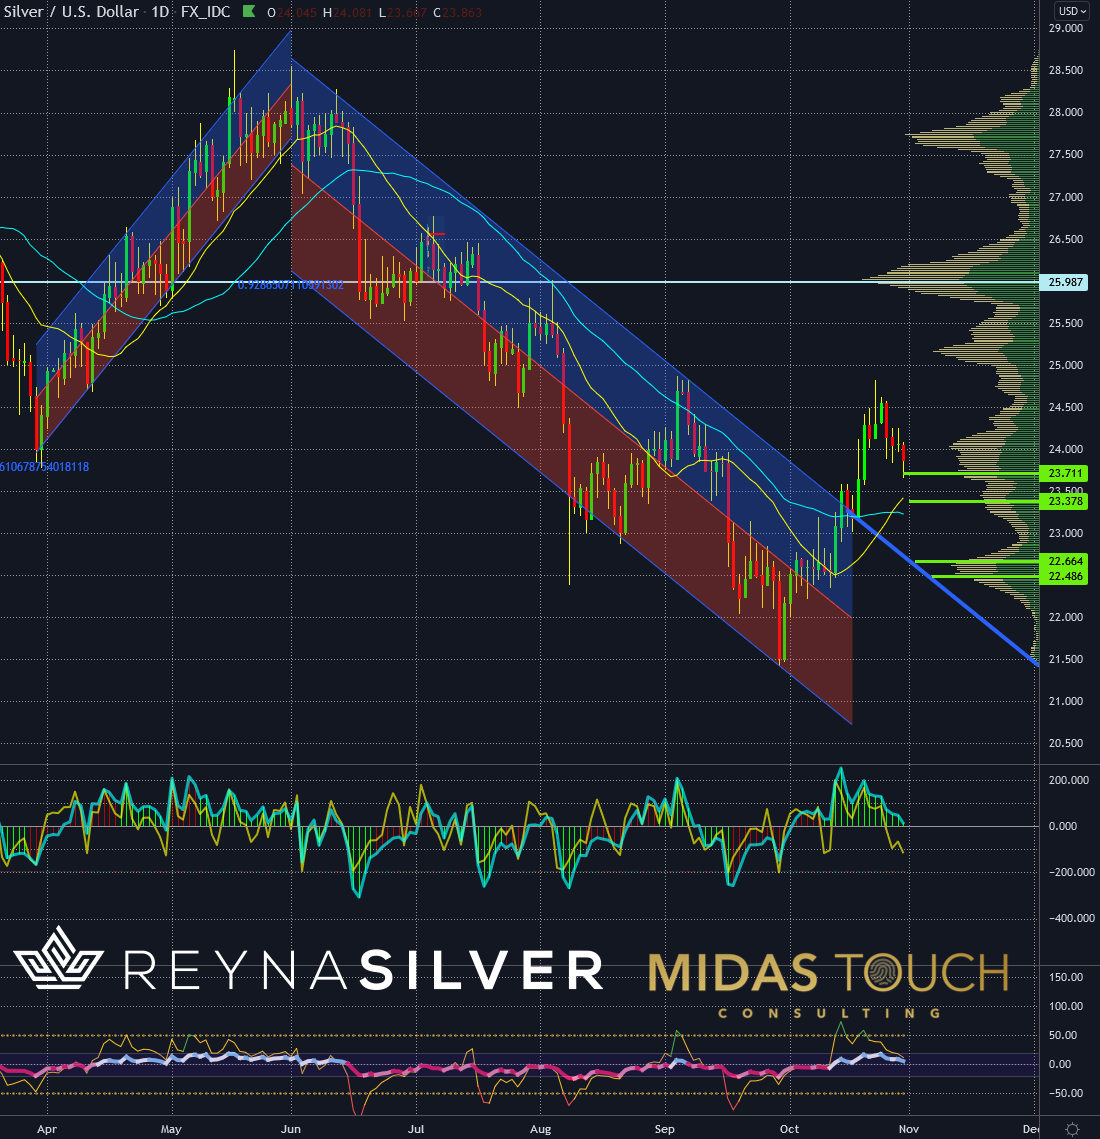
Silver in US-Dollar, daily chart as of October 30th, 2021.
It isn’t only that the overall narrative on transitory inflation is starting to get holes. We like the silver play, for instance because gold is somewhat in the limelight in battle with bitcoin. Consequently, allowing for silver to shine while it is typically in the shadow. On top of it all, we find clear evidence that commodities with industrial use are likely in a long term bull market.
This is a play where everything is coming together. A multi stream both in fundamental and technical edges stack upon each other. As of right now, we have identified four low-risk entry points on the daily silver chart, which are marked in bright green horizontal lines. We would take off 50% of the position near the US$26 mark to mitigate risk (see our quad exit strategy).
Silver in US-Dollar, weekly chart, good risk reward ratio:
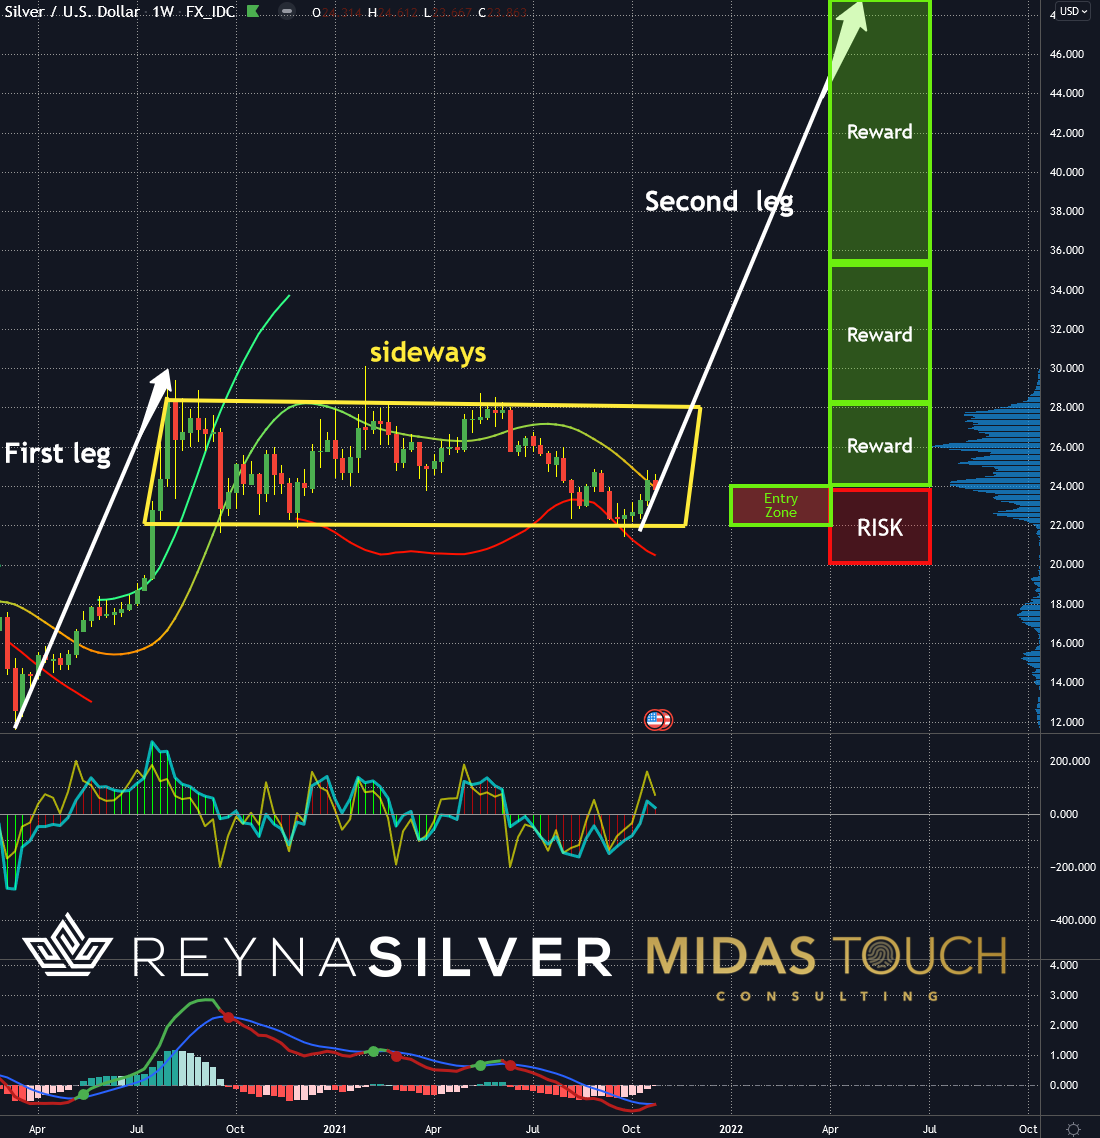
Silver in US-Dollar, weekly chart as of October 30th, 2021.
The weekly chart offers a low-risk opportunity as well. We illustrated above a play that assumes an entry point in the lower third quadrant of the yellow marked sideways zone. It would provide for a risk/reward-ratio between 1:1 and 1:2 towards the financing point. As well we assume an exit of half of the position at the top near US$28 of the yellow sideways channel (see our quad exit strategy).
With two more exits of each 25% of total trade equity at targets US$34.83 and US$48.72, we find the weekly play to be conducive to our low-risk policy.
Silver in US-Dollar, monthly chart, favorable probabilities:
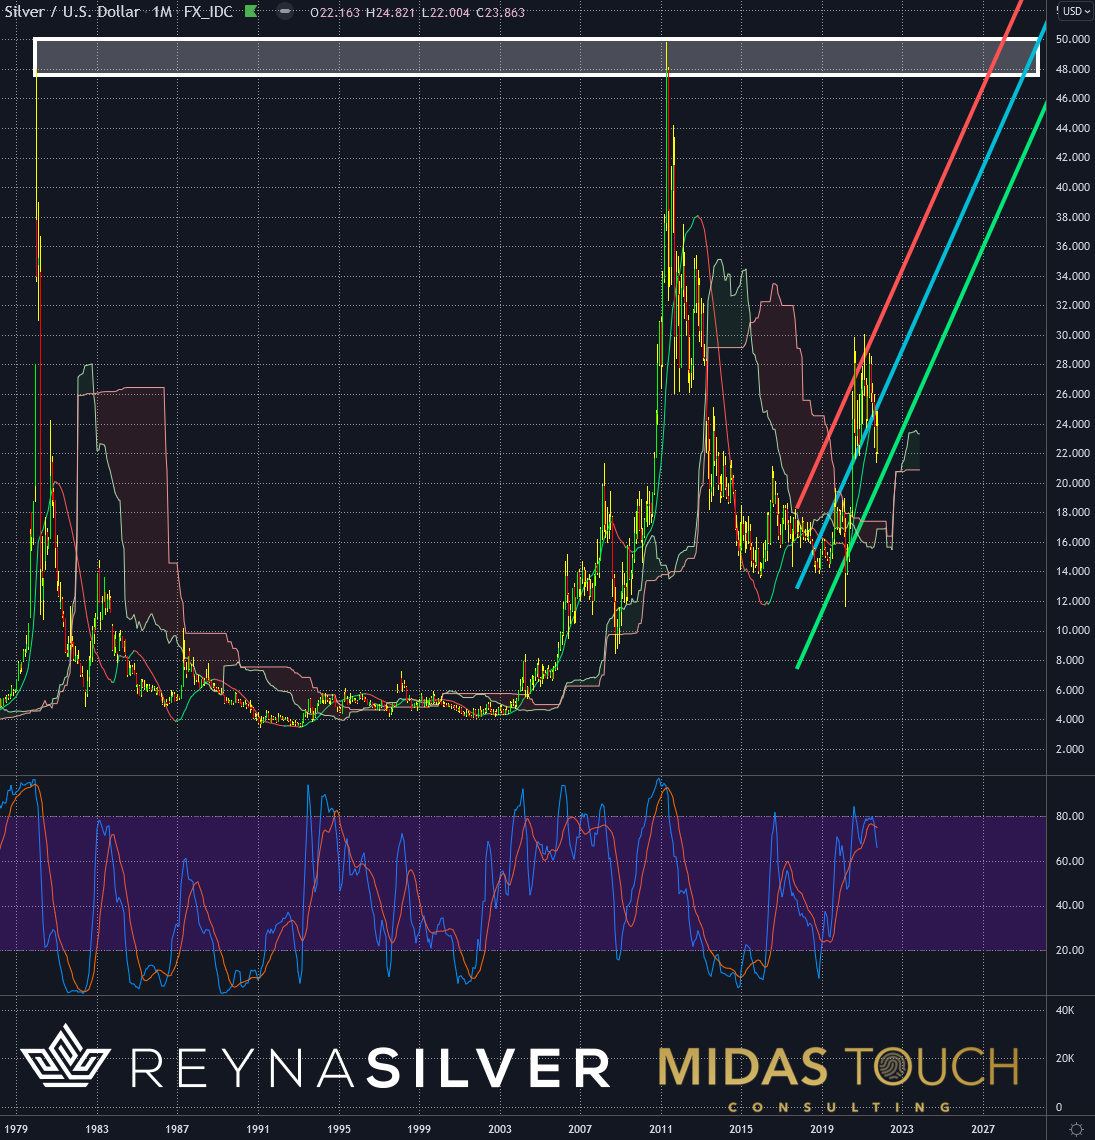
Silver in US-Dollar, monthly chart as of October 30th, 2021.
With its most considerable weight, the monthly chart provides the necessary overview. It shows how likely a success rate to a long-term play outcome is. We find three dominant aspects supporting our aim for a bullish long-term play.
Trend: The linear regression channel is marked in diagonal lines (red, blue, green). It shows a clearly bullish trend with a high likelihood of continuation.
Support: The Ichimoku cloud analysis provides solid evidence of support to the recently established bullish tone in silver.
Probabilities: Price highs from 1980 to 2011 built a double top price formation. As a result, it prevented prices from getting higher than the price zone marked with a white box. The third attempt of price reaching this price zone nevertheless has a much higher statistical probability of penetrating this distribution zone and allowing the price to go higher.
Silver’s fuse is about to be lit:
We find ourselves in challenging times. Certainly, not only in market play. One of the essential pillars to come out ahead is bending in the wind and staying flexible. Should the FED indeed raise interest rates to a degree non-reflected in the anticipated market price of speculators and come as a surprise, we might see a stock market decline next year of a substantial percentage. Consequently, this would temporarily drag silver prices down as well. We share methods in our free Telegram channel to build low-risk positions within the market that reduce risk through partial profit-taking. Our quad exit strategy allows us to hedge physical acquisitions by trading around these positions on smaller time frames in the silver paper market. Our approach provides a way to maneuver through a delicate environment to hedge against inflation and preserve wealth.
Feel free to join us in our free Telegram channel for daily real time data and a great community. If you like to get regular updates on our gold model, precious metals and cryptocurrencies you can also subscribe to our free newsletter.
This article does not contain investment advice or recommendations. Every investment and trading move involves risk, and readers should conduct their own research when making a decision. The views, thoughts and opinions expressed here are the author’s alone. They do not necessarily reflect or represent the views and opinions of Midas Touch Consulting.

