


Silver, time is on your side
Since we gave up on the Gold Standard in 1971, Gold was almost shunned by financial institutions. Holding Gold represented questioning the monetary system. We find an impressive acceleration of exposure to Gold by funds, financial institutions, and even pension funds in recent times to gain credibility. A confirmation for the inflationary weakening of the Dollar. The yearly Gold mining production is around 200 billion US-Dollars, while we see the demand outpacing this by an extreme factor. With Gold rising to the forefront, Silver will follow closely. Silver, time is on your side.
Daily Chart, Silver in US-Dollar, Income producing:
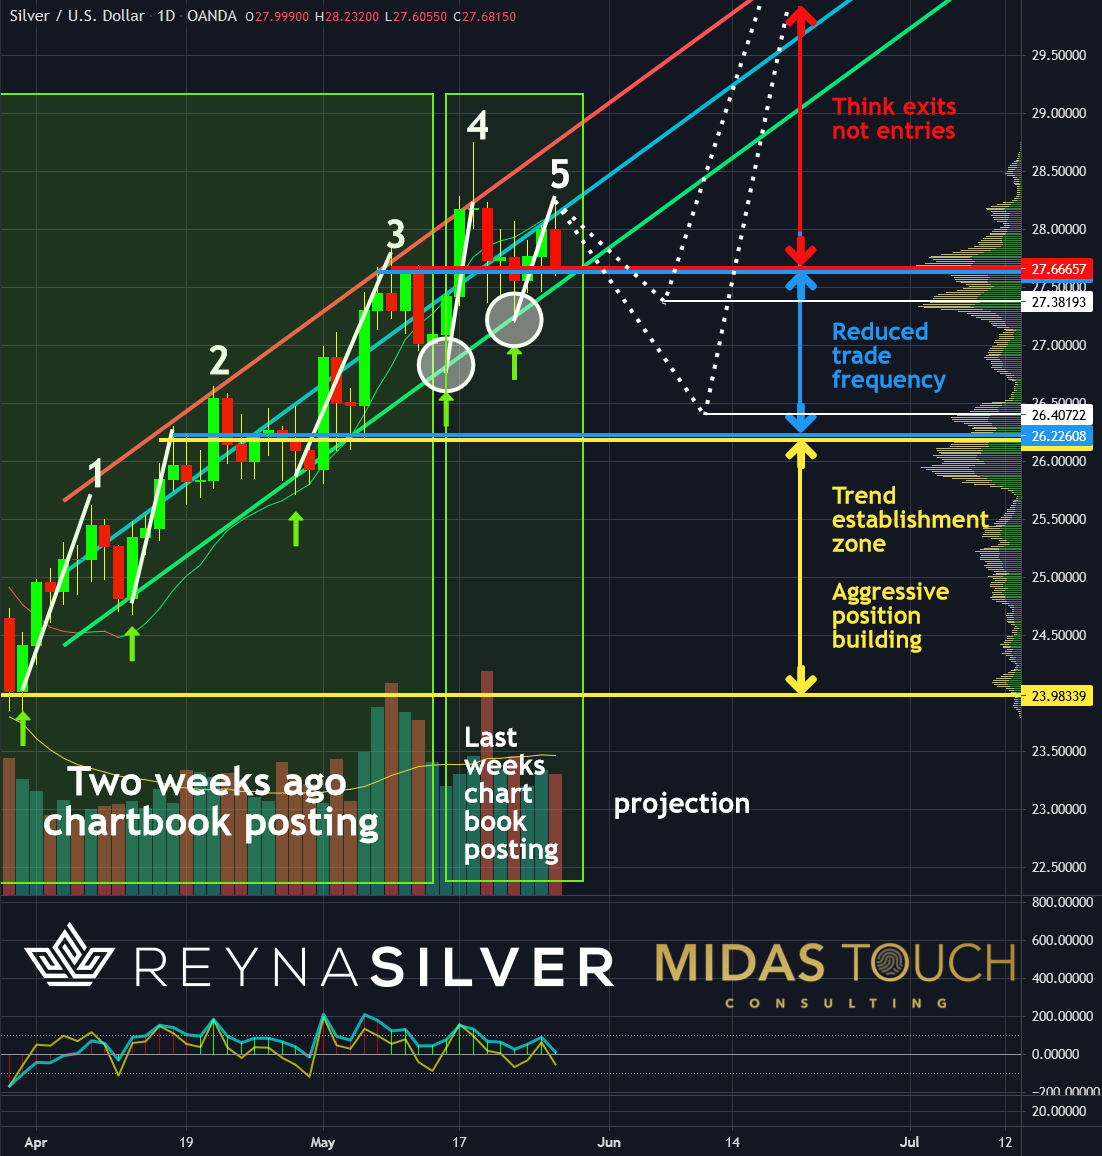
Silver in US-Dollar, daily chart as of May 27th, 2021.
We were again able to profit last week from lower trendline entry trades by taking half off after the initial price moves in our favor. (see our quad exit strategy). We overall lightened up on our positions near options expiry (5), since a possible more significant retracement is likely. Our reentry projections are US$27.38 and US$26.41.
From a daily trading perspective, we are now stepping away from aggressive short-term reloading. Think exits versus entries! The above daily chart shows that principle-based entry density should be in the establishment zone of a trend and not when the world wakes up to Silvers directional run.

Silver in US-Dollar, Weekly Chart, Just getting started:
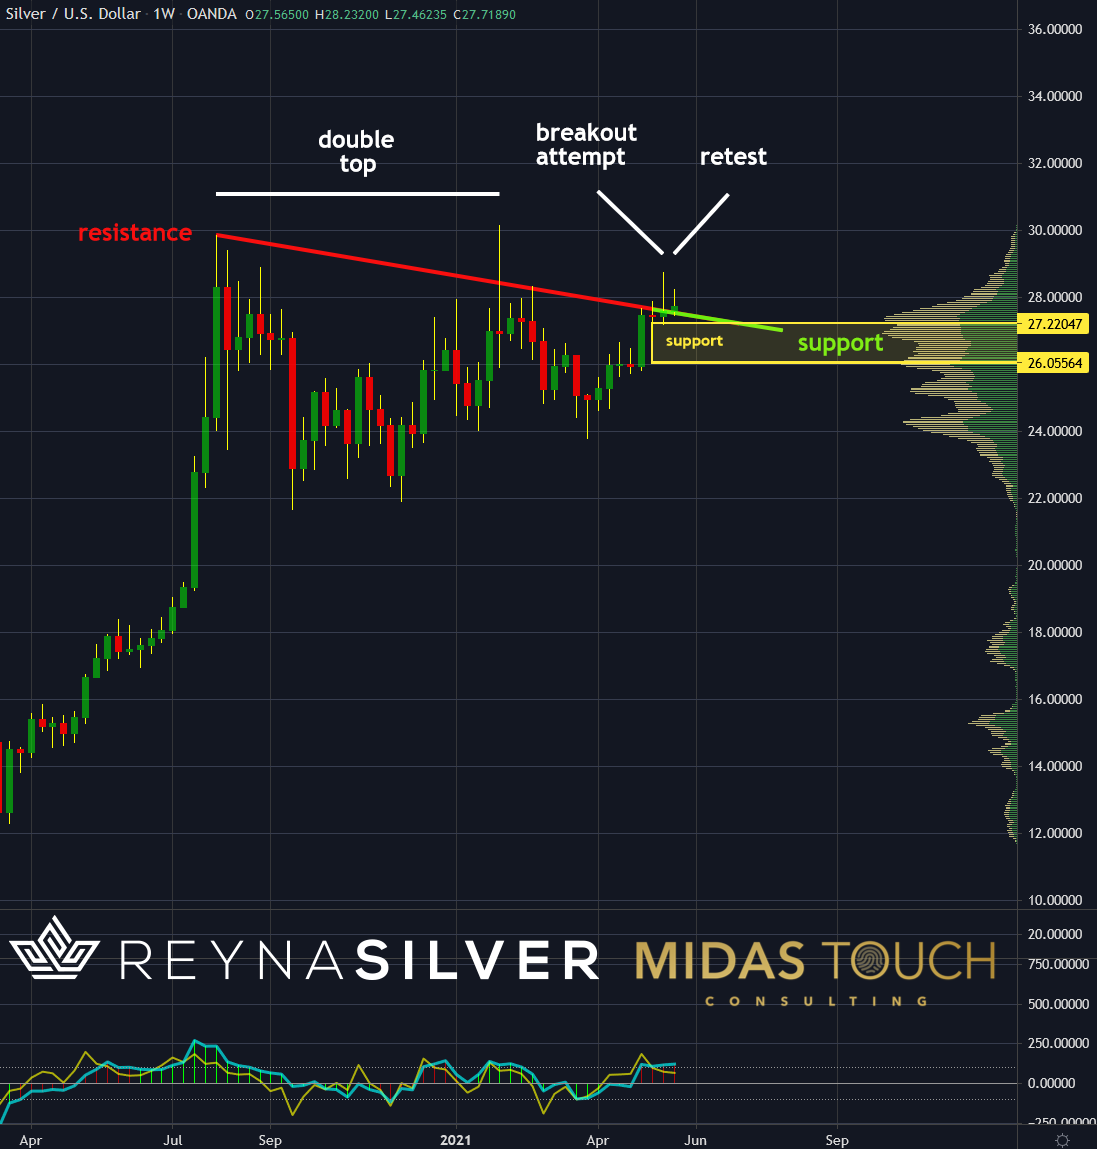
Silver in US-Dollar, weekly chart as of May 27th, 2021.
While it is sensible to get modest with aggressive trade frequency on daily timeframe, the weekly chart is still bullish. At the beginning of this year, a double top in price was firmly rejected, and prices were forced back into range. Over the last two months, Silver has advanced enormously from US$24 to US$28. Two weeks ago, we had a failed breakout through a significant resistance trendline. This week prices managed to trade above what was previously resistance and has now become support. No need to cash in the chips just now! We see a bullish consensus confirmed.
Silver in US-Dollar, Monthly Chart, Persistent strength:
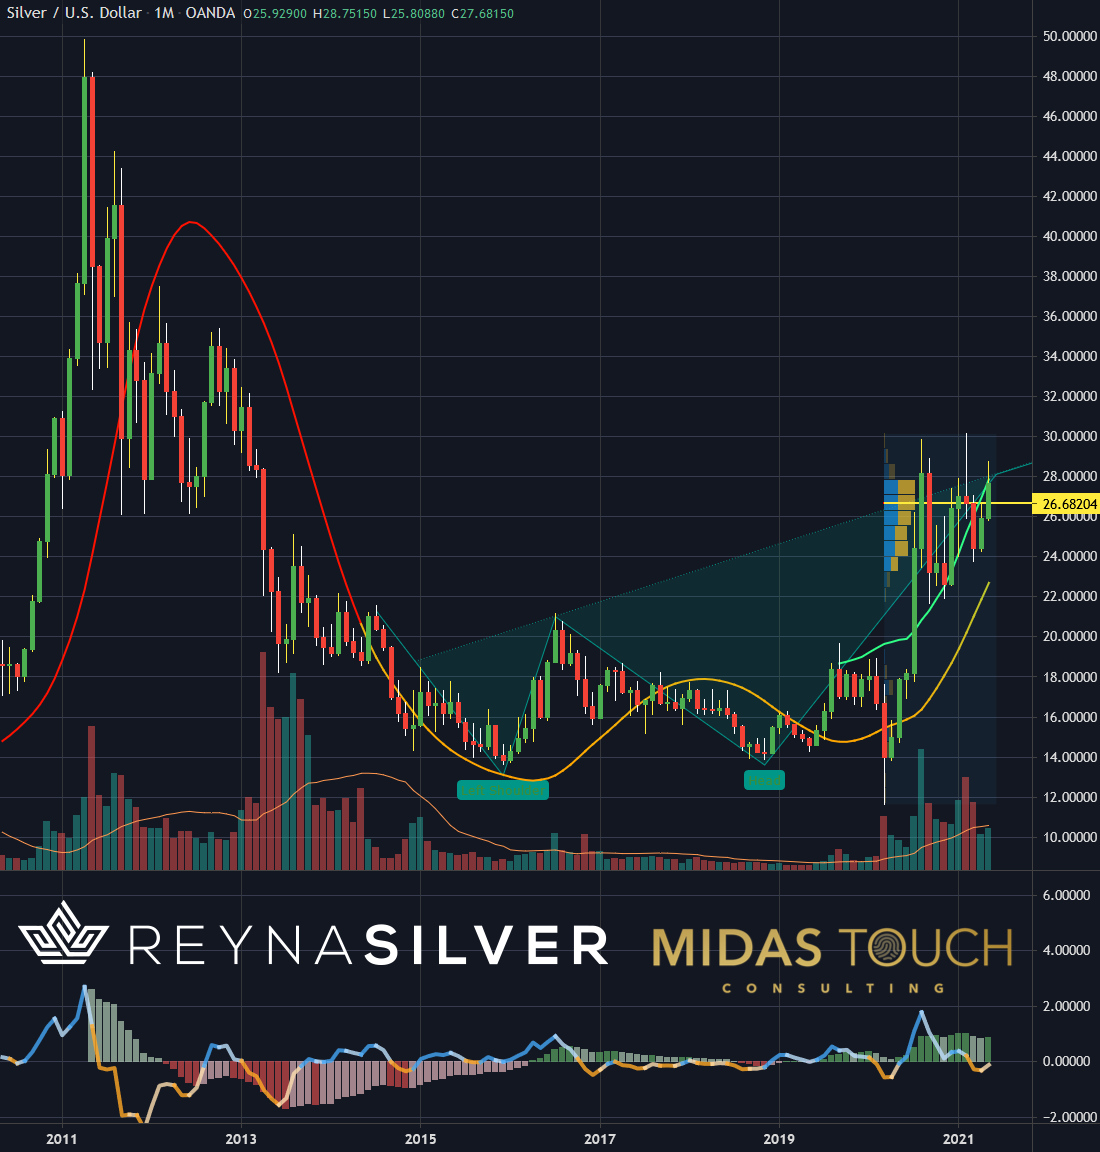
Silver in US-Dollar, monthly chart as of May 27th, 2021.
Trustworthy guidance needs to be taken by the more significant player participation represented on the larger time frame charts. A look at the monthly chart shows volume supported buying. We can also see a strong supply zone below actual trading prices based on our fractional volume analysis at US$26.68 (yellow line). With this much focus on the precious metal sector and Gold coming to the forefront, we see Silver to rise into a stellar future in tech mid- to longer-term.
Silver, time is on your side:
We use a hybrid model of income-producing trading and long-term investing. We take partially initial profits quickly to mitigate risk. And we leave small portions of each winning trade exposed to the market and do not trail stops. Why no stops? The further one stretches a rubber band, the more extreme it snaps back. As such, in principle, trailing stops are a flawed methodology to protect profits. By taking partial profits early instead but leaving remainder positions exposed with only a break-even stop, the likelihood is that these runners survive significant retracements and end up in a trending environment to outpace any other profit-taking methodology.
Result:” If you catch a long-term trend, the rewards are enormous.” In the case of Silver, this long-term trend has a very high probability. With the intent of wealth preservation and long-term investments, we find the Quad exit strategy contrarian to hodling, Martingale strategies, pyramiding, and any other high-risk approach the one to surpass typical expectations.
Feel free to join us in our free Telegram channel for daily real time data and a great community.
If you like to get regular updates on our gold model, precious metals and cryptocurrencies you can subscribe to our free newsletter.

