


Bitcoin, change of mind required
It is a principle, that those market participants who are highly flexible in their market interpretation have a higher degree of likelihood to walk away consistently profiting than those who hold on to a rigid belief for too long. In the case of Bitcoin, insisting on simple pattern recognition, which worked a hundred years ago, is futile. Markets have evolved and, along with it, technical analysis. A much closer look is required at what works on an individual trading object. With the participation of different players, institutions as of late, a close review is necessary. Bitcoin, change of mind required.
Too many players try to make the markets fit into their cookie-cutter technical analysis beliefs versus looking at the specific trading vehicles’ intricacies. While chart patterns could be blindly traded for the more significant part of the last century, many edges have dissipated. It is critical to accept that certain edges work for some time and then vanish. With the rapid changes of Bitcoin´s main trading and investing groups, a frequent change of mind is necessary. Only then will you be able to profit from Bitcoin’s stellar rise.
BTC-USD, Daily Chart, Directional trendlines work:
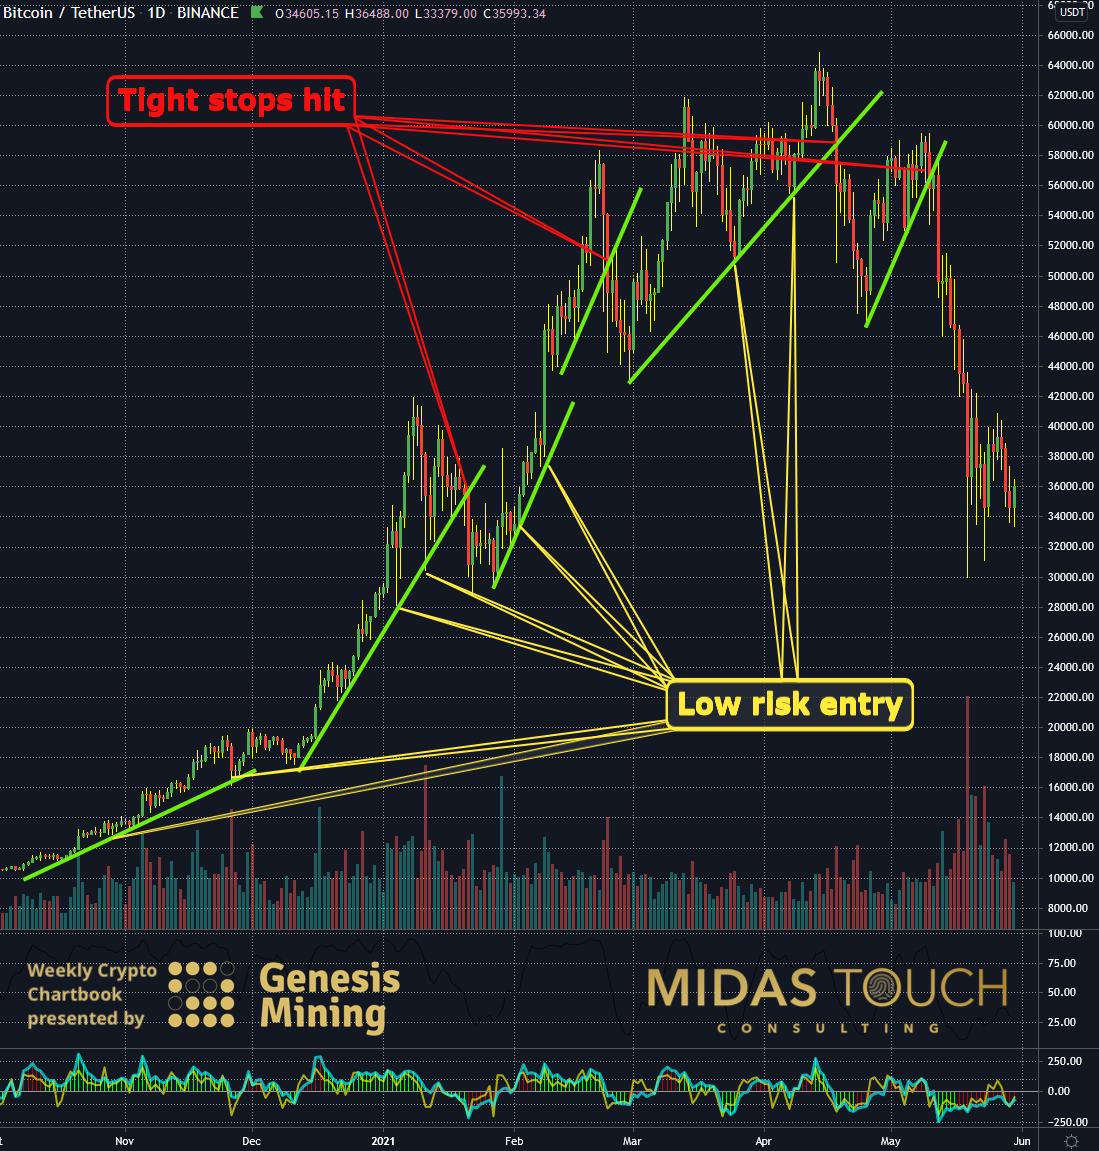
Bitcoin in US-Dollar, daily chart as of May 31st, 2021.
When backtesting which elements of technical analysis are valid, it is essential to pin the findings to their specific time frames.
The above daily chart shows that directional trend-lines for entries and stops are suitable.
While typical, a top-down approach is essential, in this case, the daily time frame supersedes importance. It holds significance for shorter-term trades as setups and is an entry time frame tool for larger time frame players. Clearly an excellent time frame to start one’s investigations.
BTC-USD, Daily Chart, High volume transactions as support and resistance:
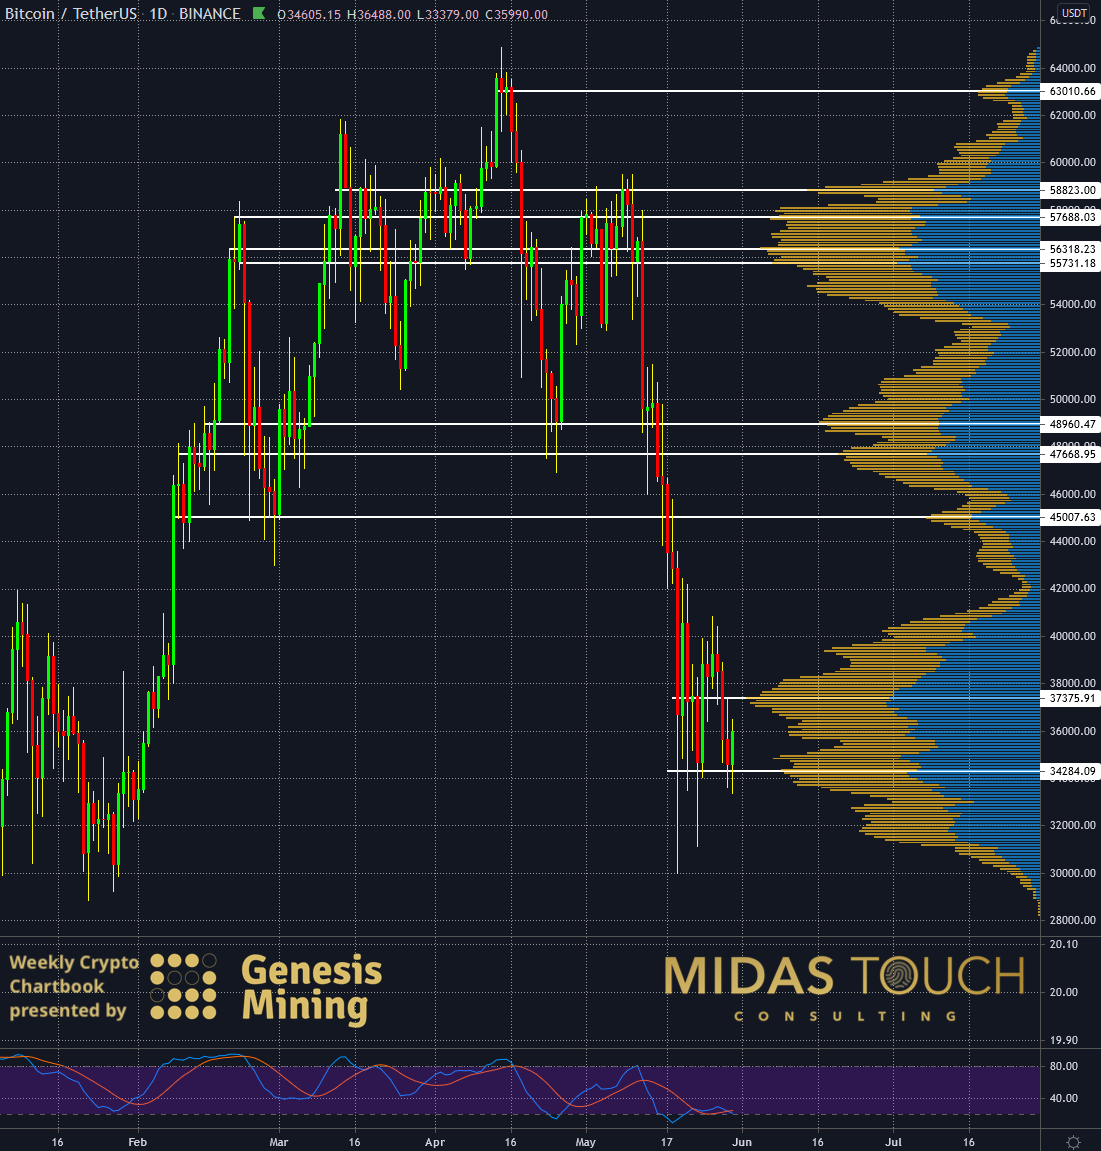
Bitcoin in US-Dollar, daily chart as of May 31st, 2021. b
Bitcoin eludes old-school technical analysis suggesting to draw horizontal support and resistance lines. Mainly due to the degree of volatility inherent from Bitcoin, amongst other factors.
What suits this trading vehicle very well, though, is transactional volume-based supply and demand zones. As the daily chart above shows clearly, Bitcoin abides high volume nodes pointed out by the fractional volume analysis diagram to the right side where high transaction volume points are represented through horizontal white lines.
BTC-USD, Daily Chart, First signs of life:
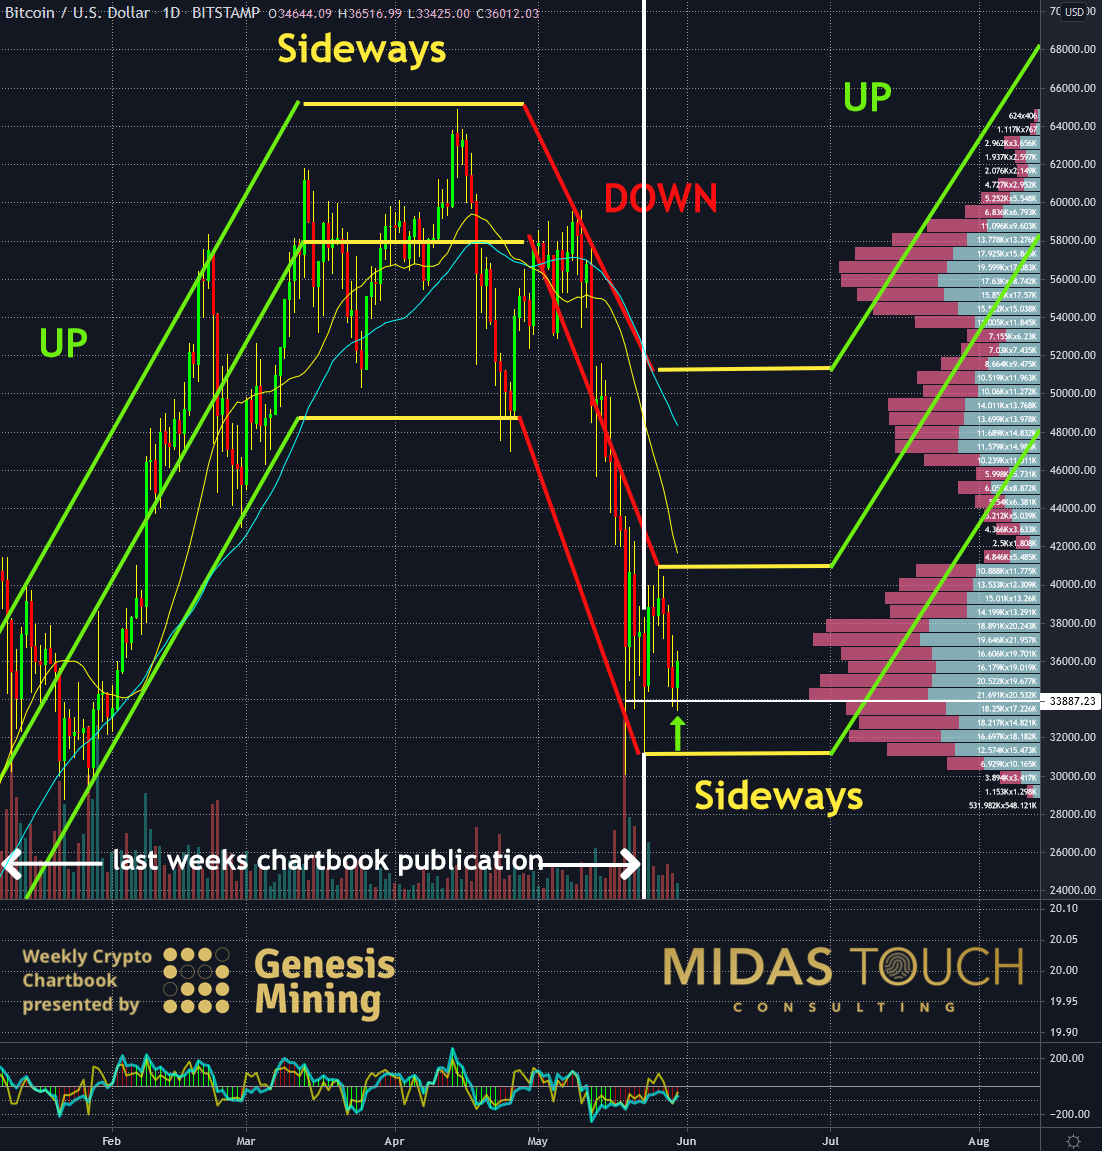
Bitcoin in US-Dollar, daily chart as of May 31st, 2021. c
Looking at last week’s chartbook publication, we find that prices have adhered to our expectations. After the double bottom near US$32,000 at the time, prices now moved upwards and touched precisely our upper bound sideways channel line marked in yellow near the US$41,000 price mark. An excellent point to take partial profits for those who established early entries. This represents roughly a US$9,000 advance or a 28% move).
Since then, the price has declined to its high volume node supply zone near US$34,000. There we took low-risk entries in the hopes of further price advances. All trades are posted in real-time in our free Telegram channel.
We eliminated risk out of all entries by taking 50% of position size out after initial price movements in our favor. Again, we will take some profits off the table once the upper range boundary is touched near US$41,000.
Bitcoin, change of mind required:
Even more important than knowing what works is knowing what doesn’t work. Classical chartists will find Bitcoin´s behavior on breakouts, upper directional trendlines in smaller time frames, and Fibonacci extension targets on larger time frames to be performing poorly, to name just a few.
We follow the principle of “never assume.” Never assume just because it has worked for a hundred years that it still does. Instead, do your homework. Make sure to check what still provides an edge and what doesn’t. You will be amazed how much of classical technical analysis has vanished. Getting these kinks out of one’s stacking odds tools and instead replace with true odds of newly found edges will make all the difference between a performing system and a frustrating journey of consistent losses.
Feel free to join us in our free Telegram channel for daily real time data and a great community.
If you like to get regular updates on our gold model, precious metals and cryptocurrencies you can subscribe to our free newsletter.

