


Silver, the waiting game
One of the most challenging tasks in market play lies in determining market tops and bottoms from a timing perspective. The most obvious reason for that is the complexity of the function of time itself, and other aspects are rooted in the degree of variables that markets are comprised of. When left alone, markets have a natural rhythm like breath, but it becomes substantially more difficult to predict troughs and peaks when the market is meddled with. Unfortunately, meddling peaks in crisis. Meaning an economy distressed receives more focus from politicians (often motivated by fear of losing their jobs), which influences the natural resolve of markets. Such interpretations and ultimate interference with the marketplace can have a massive effect on the harmonious timing of cycle highs and lows: silver, the waiting game.
Luckily, it is not necessary to time market entry and exit precisely. What is essential is calculating risk itself and that risk to expected returns. In addition, strict management of the trade itself is required.
Gold versus Silver in US-Dollar, monthly chart, risk versus reward:
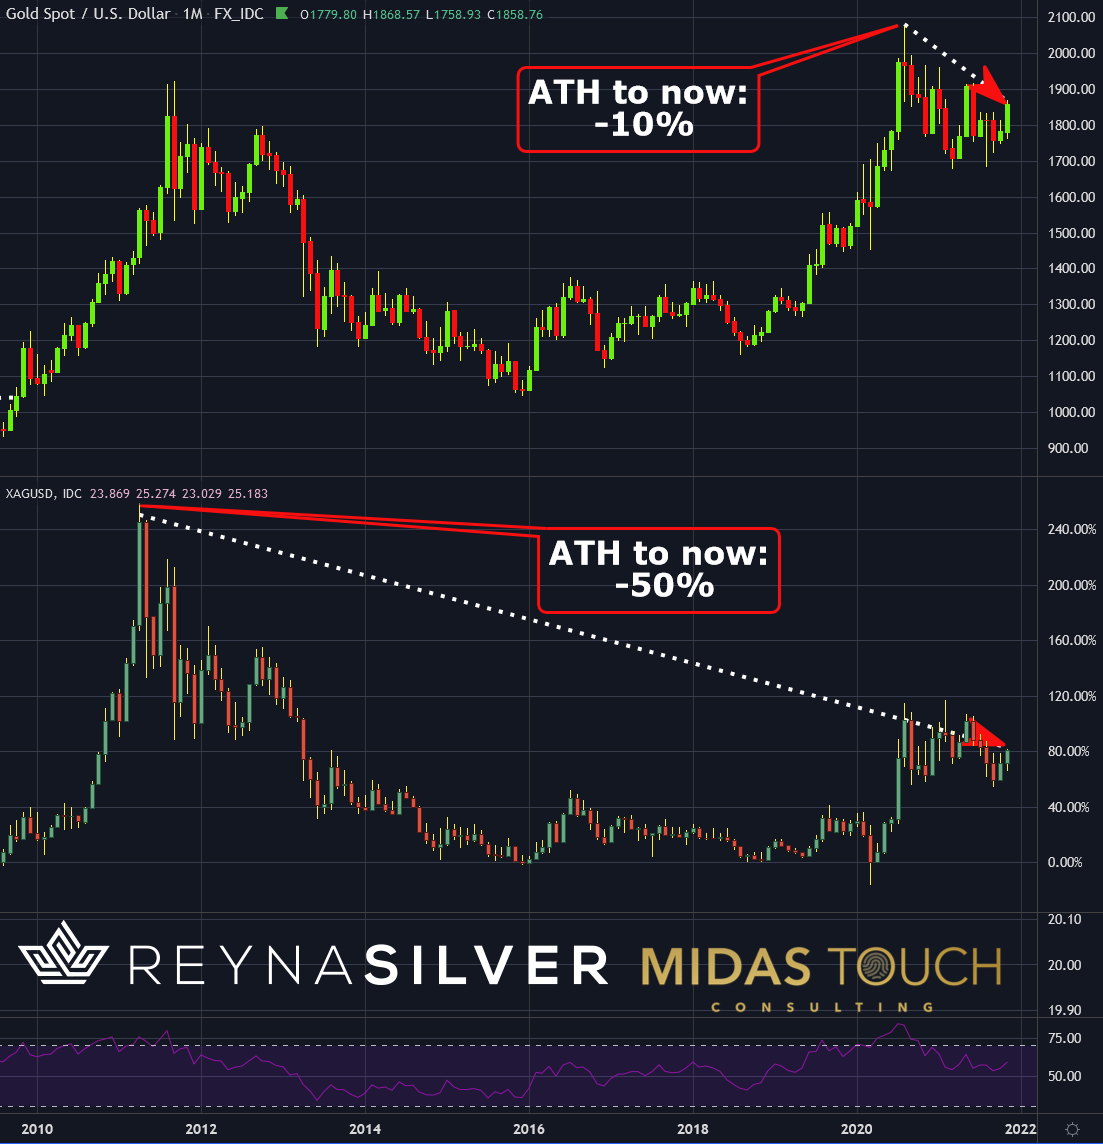
Gold versus Silver in US-Dollar, monthly chart as of November 12th, 2021.
That being said, instead of getting distracted by a narrative of policymakers who might prolong the inevitable even for years possibly, we focus on the technical aspects that cannot be “rationalized” away and will be unaffected by market influencers.
One such fact is the market relationship between silver’s more giant brother gold. The chart above tries to illustrate that gold is trading 10% below its all-time high. On the other hand, silver is trading 50% below its all-time high.
This discrepancy makes silver the more desirable play (better risk/reward-ratio). The difference will work like a loaded spring, and once released, silver will outperform gold by a multiple.
Gold in US-Dollar, monthly chart, gold leading strongly:
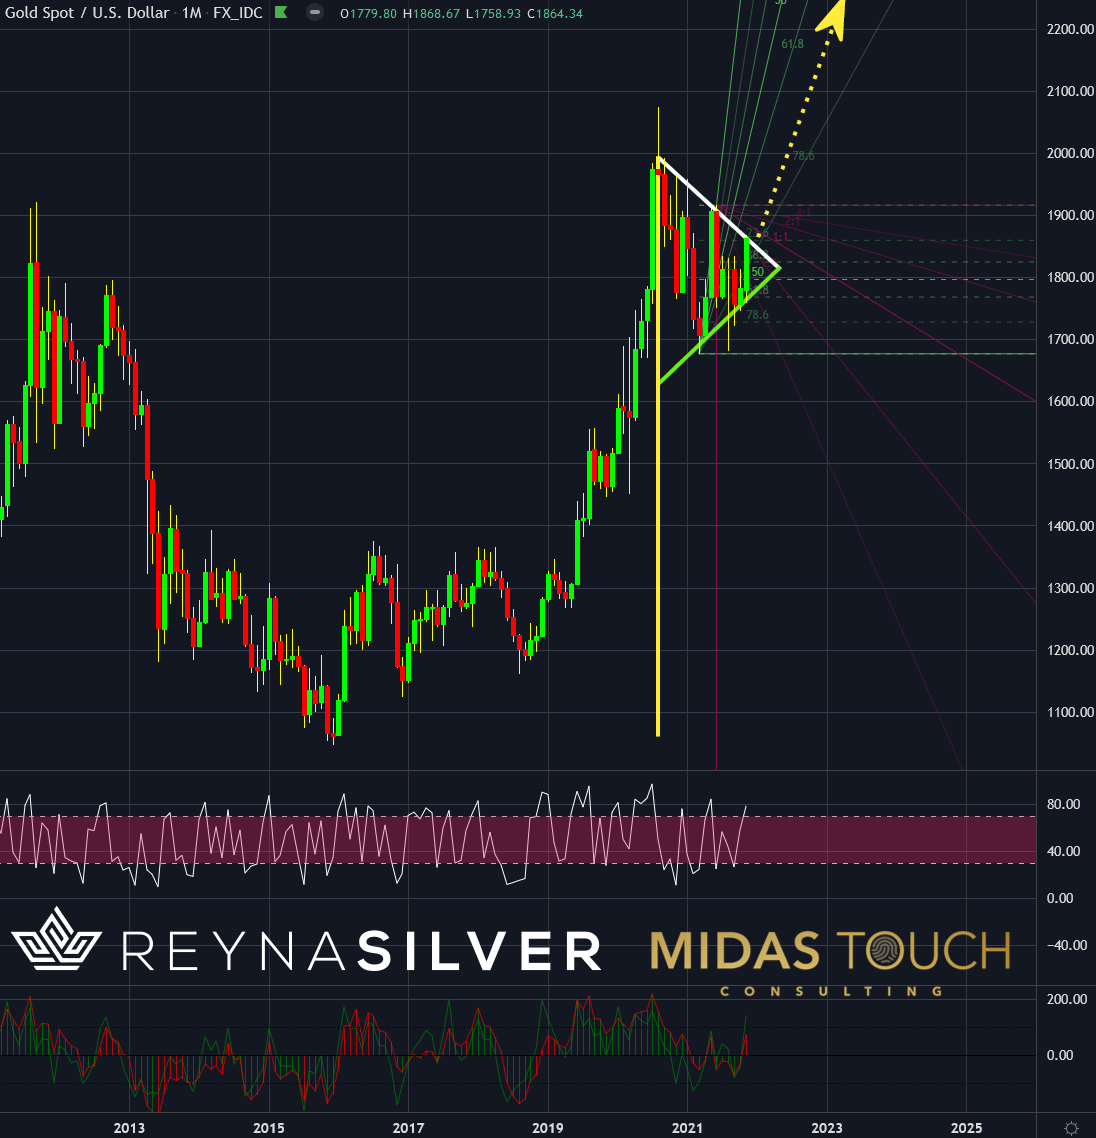
Gold in US-Dollar, monthly chart as of November 13th, 2021.
Now that we have found the right vehicle for a wealth preservation insurance play, we are looking for additional factors. Physical acquisition is a clear prosperous choice. It protects against inflation and the risk possibilities inherent to fiat currency, with much historical evidence.
That leaves us the question of entry timing. Especially since the physical purchase has a broader spread and a reactionary lag over spot price trading, which is pretty much instant. The chart above clarifies why we see there to be leeway regarding being “right.” It is less critical to pinpoint the absolute lows versus overall participation. Especially since a lack of physical silver availability, which is a possibility, would erase the whole play.
The monthly gold chart above is a strong indication that precious metals might be breaking to the upside. With this month’s strength, price pushing against the upper resistance line (white line) of a bullish triangle, silver prices mutually trailing higher is likely.
Silver in US-Dollar, monthly chart, closely following gold:
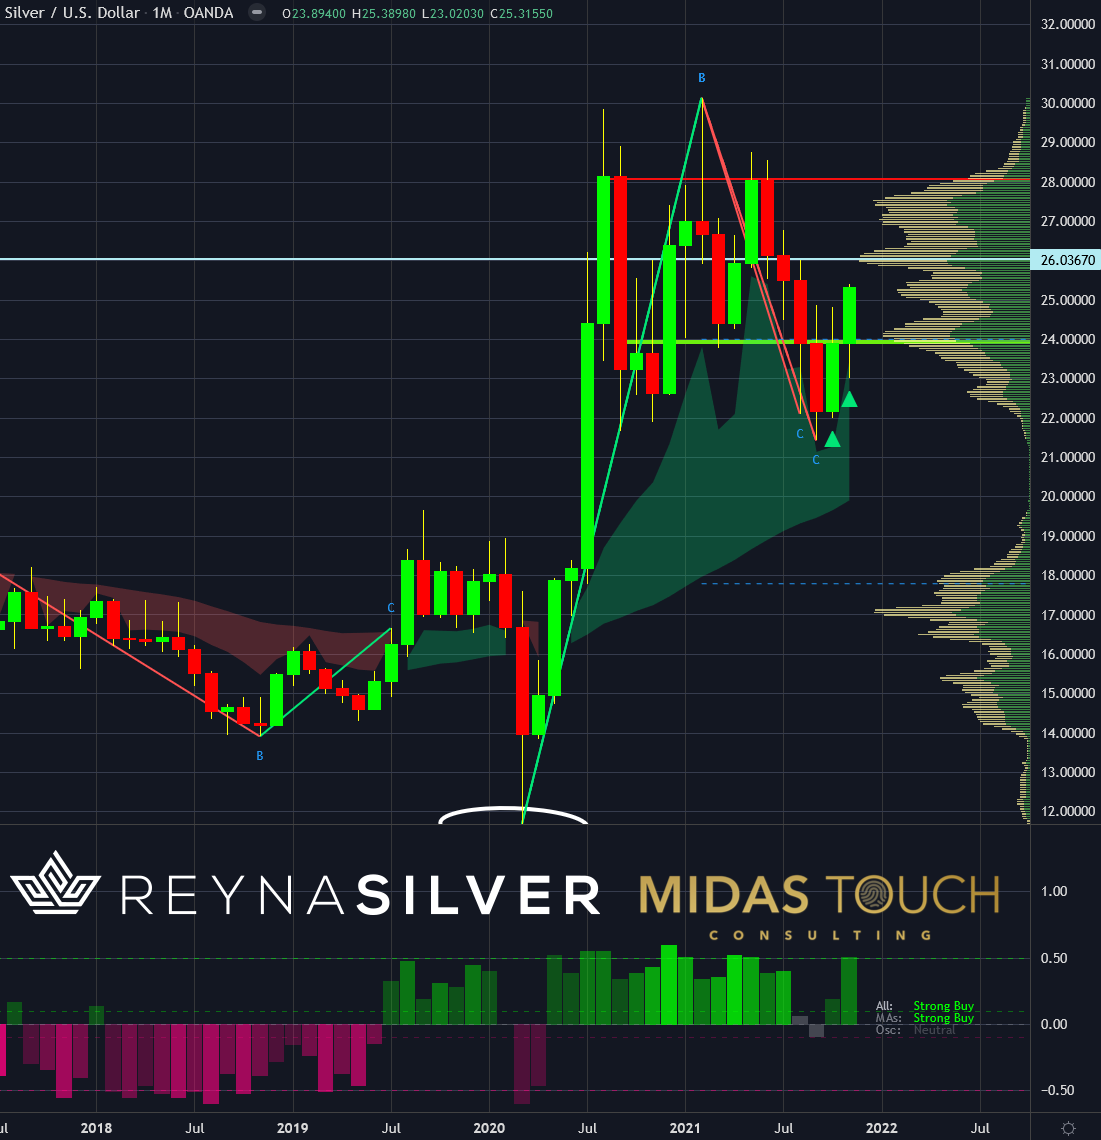
Silver in US-Dollar, monthly chart as of November 13th, 2021.
With these necessary positive edges in play, we can now look at silver itself and look for possible low-risk entry points.
The monthly chart shows mutual strength over the previous gold chart. Silver has pushed successfully through the problematic distribution zone around the US$24 price level. It still faces POC (point of control), the highest volume node of our fractal analysis, looming above US$26.03.
With this many edges in our favor, we find this an excellent spot to add to physical silver holdings from a long-term holding perspective.
Silver in US-Dollar, weekly chart, spot price play:
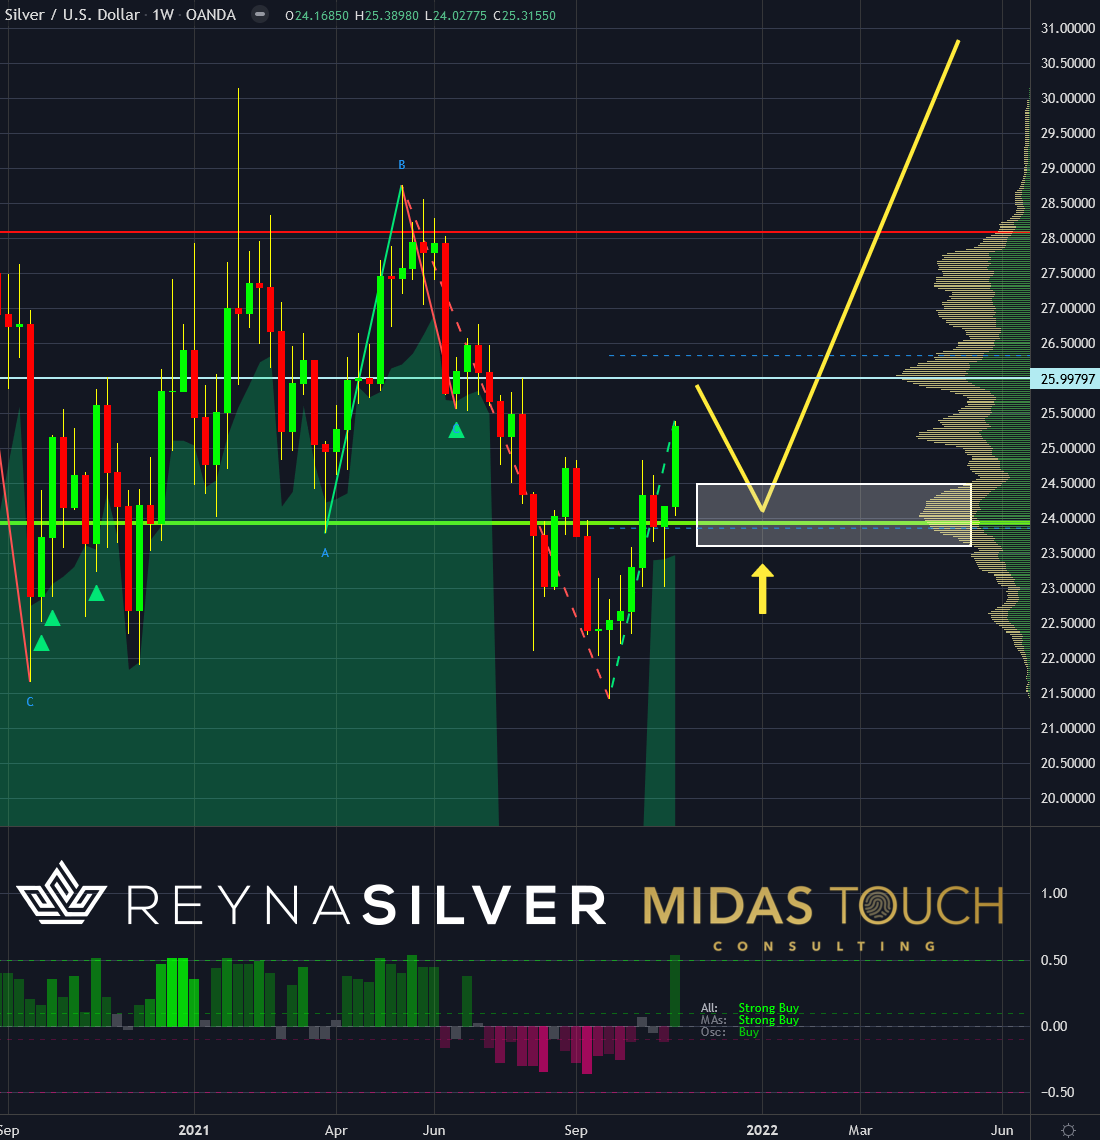
Silver in US-Dollar, weekly chart as of November 13th, 2021.
For a spot price play in the midterm time horizon, we are instead waiting for a possible price bounce of POC. A low-risk entry would be granted once the price retraces back into the US$24 to US$24.50 zone.

Silver, the waiting game:
In market movement, we see expansion and compression, much like an oscillator. At certain times though, may it be a natural or man-made disaster, we can find ourselves in a stretched or amplified move. These times of abnormality from a time perspective require being well-prepared. Swift, disciplined actions following a clear planned roadmap are advised. An anticipated roadmap strictly followed. It is first a waiting game followed by quick action, both psychologically challenging environments.
With physical acquisitions of metals, perfectionism in timing is paralysis. Not necessary to come out ahead. We find silver accumulation at this time to be a prudent measure to protect your wealth. Like buying insurance against an anticipated market turn.
Feel free to join us in our free Telegram channel for daily real time data and a great community. If you like to get regular updates on our gold model, precious metals and cryptocurrencies you can also subscribe to our free newsletter.
This article does not contain investment advice or recommendations. Every investment and trading move involves risk, and readers should conduct their own research when making a decision. The views, thoughts and opinions expressed here are the author’s alone. They do not necessarily reflect or represent the views and opinions of Midas Touch Consulting.

