


Silver is moving up
But when? We keep hearing silver is soon to explode for over a year now! Obviously, no one has a crystal ball. And hence, no one really knows. Everybody involved in the silver market is asking: when? Patience is stretched, and a lot of doubt has been creeping in, questioning whether the whole silver idea is correct? Psychology is the most crucial aspect of trading. One needs to reevaluate at least once a week for the larger time frame plays one’s thesis, and most of all, the probability of success of one’s game plan. Only then does one stay ahead of the game and is ready to push the button if and when action is required with the necessary confidence and conviction. Silver is moving up.
So, what are the facts:
Monthly chart, Silver in US-Dollar, probabilities:
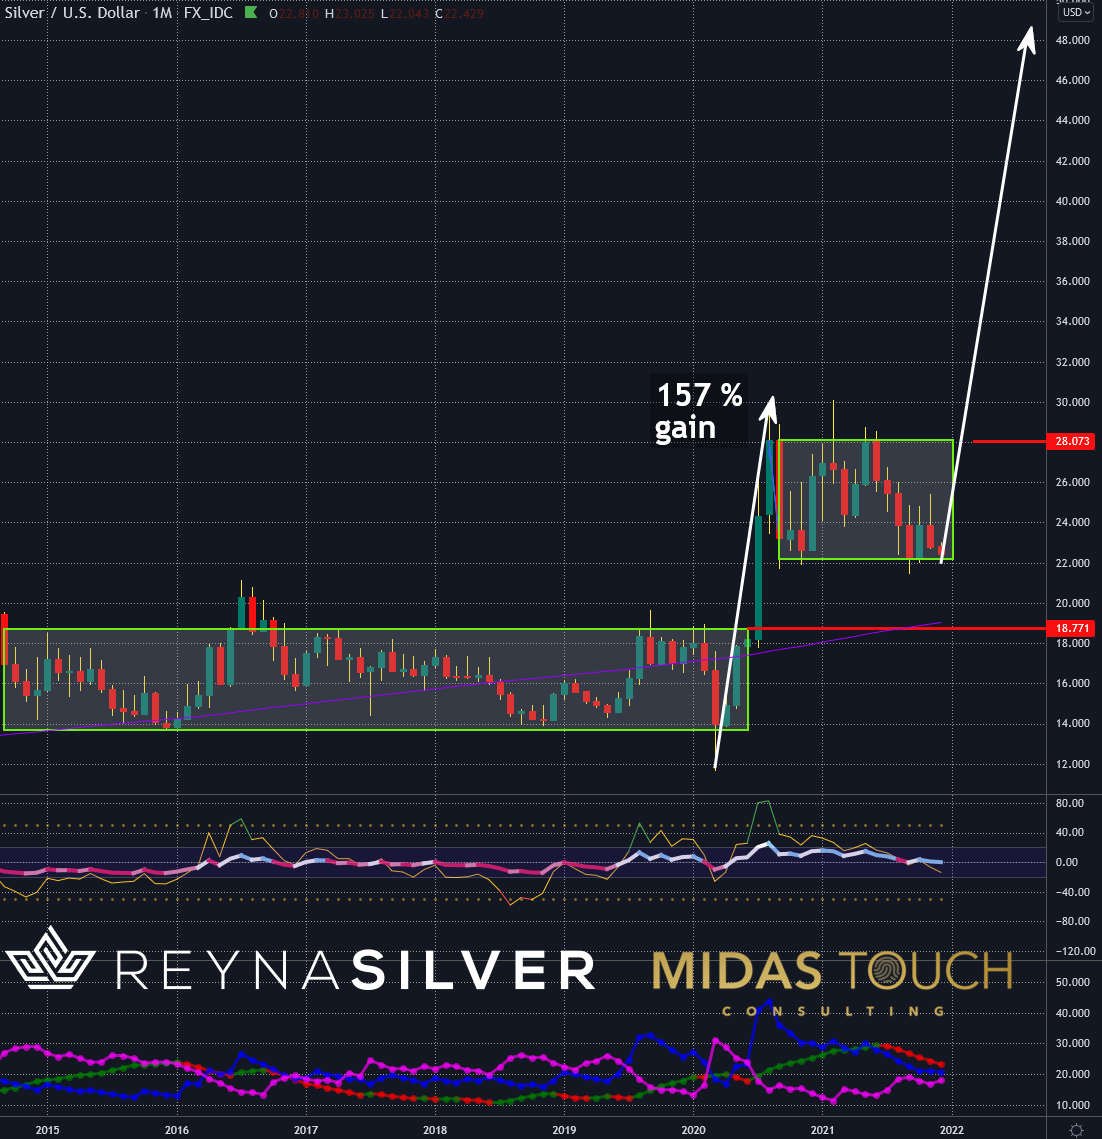
Silver in US-Dollar, monthly chart as of December 10th, 2021.
In 2020, silver broke a multiyear sideways range and moved strongly up. It has now consolidated for over a year in a sideways range again.
This is a bullish setup! As much as emotions might be weary, from a probability perspective, a general rule is that the longer a congestion is from a time perspective, the more significant will be the subsequent breakout from that range. Statistical probabilities are also clearly pointing to the upside rather than returning into the prior range.
Not to forget, buying near the lows of such a range box guarantees the lowest entry risk and highest risk/reward-ratio play to be taken for the long side, even if emotions might tell you otherwise.
2021 silver trades performance:
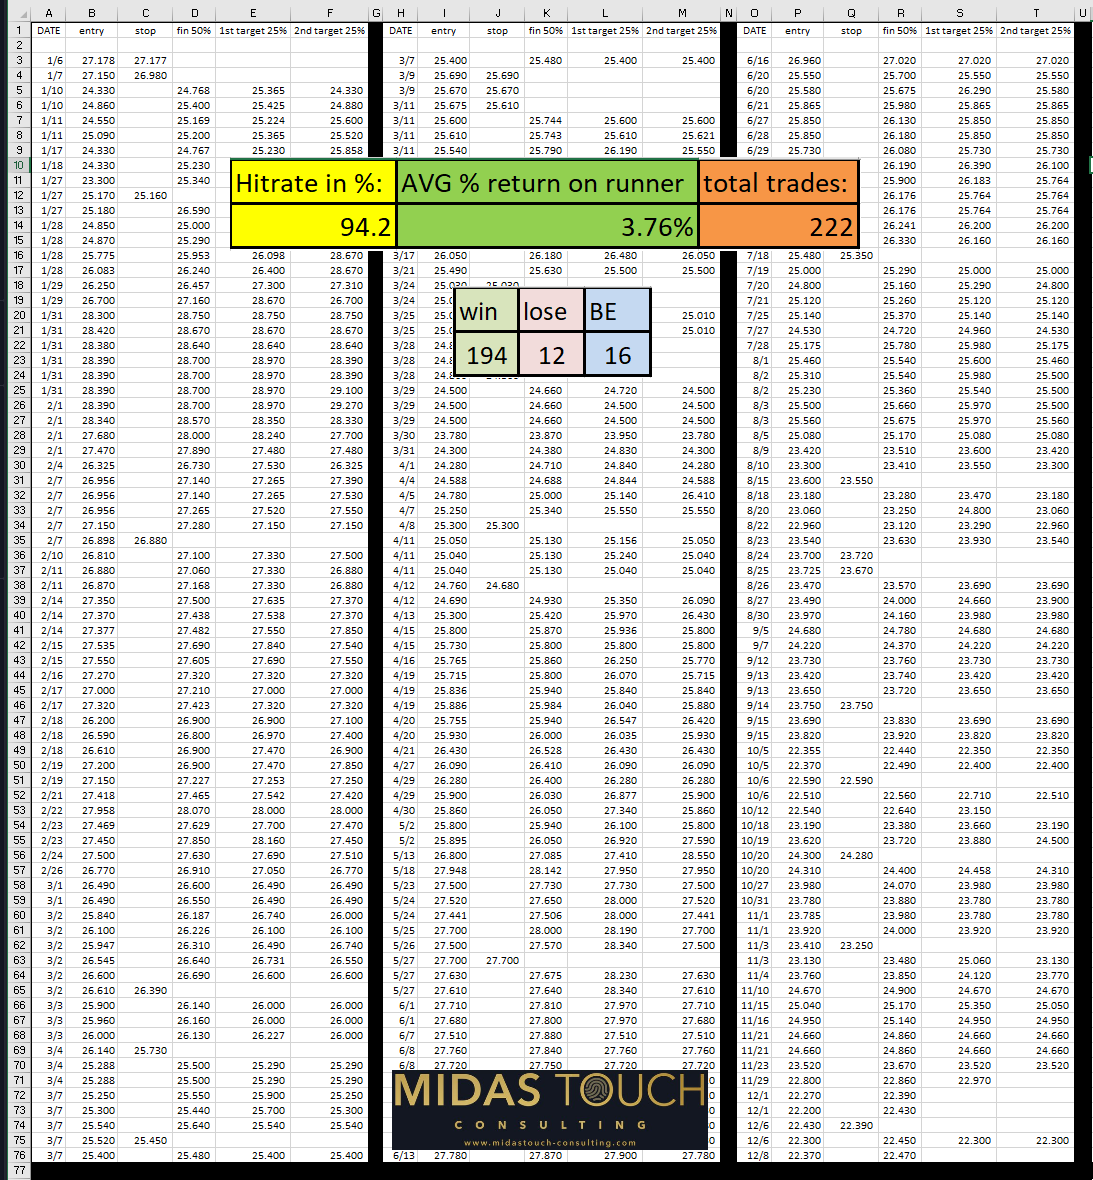
2021 silver trades performance.
Another fact is that one does not need to know when and if a breakout is happening to extract money from the markets consistently.
The above chart is this year’s silver trades that we posted in real-time in our free Telegram channel. The systematic approach focuses on low-risk entry points with a risk reduction method through our quad exit strategy. Sideways markets provide an income-producing aspect of one’s trading, and a possible breakout of a range would give a significant bonus.
An approach like this keeps emotions in check since one’s labor gets rewarded and allows for significantly higher rewards once ranges do break.
Silver in US-Dollar, quarterly chart, silver is moving up:
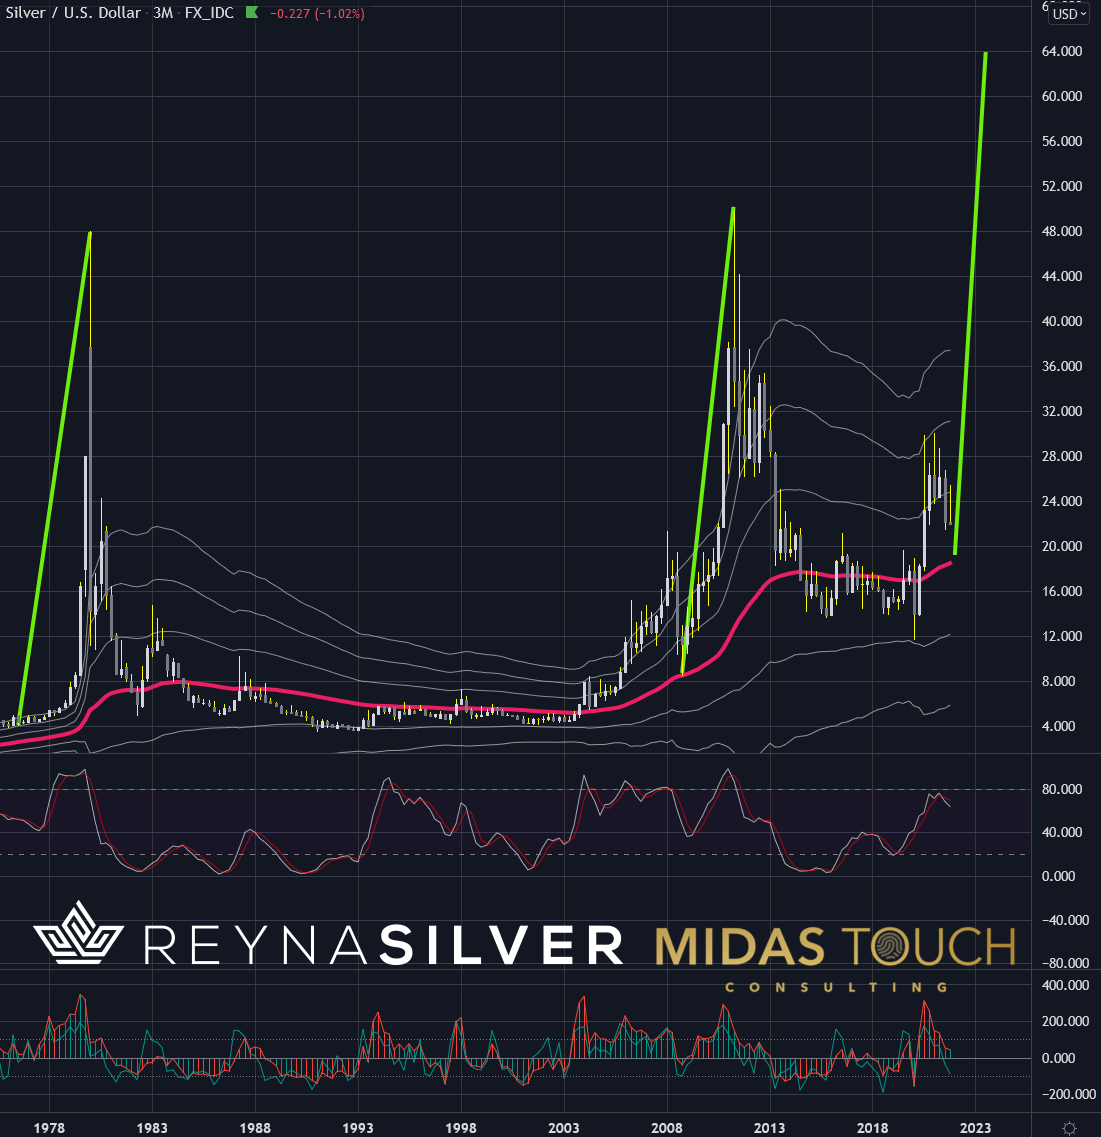
Silver in US-Dollar, quarterly chart as of December 10th, 2021.
In short, while waiting is strenuous, and one might feel doubtful, from a probability perspective, silver is an even likelier success story now than it has been six months or a year ago.
What should also not be underestimated is the fundamental situation of this wealth preservation play. The extensions of governments playing the inflation game to such length are like adding fuel to the silver play.
Widespread problems that are the pillars to this insurance play have, if anything, increased. Consequently, supporting a good likelihood that silver prices go up. When? Well, that is hard to say since no one knows the future, but maybe this question gets proportionally in weight too much attention since insurance isn’t just bought for the next storm to come but in principle acquired to make one feel good and to protect one’s wealth long term.
The quarterly chart above shows how silvers inherent volatility can sustain, in times of market turmoil, extended phases of extreme standard deviation levels. Price moves far away from the mean (red line). We are trading near the mean as of now, and the very right green line is a projection of a possible price move up.

S&P 500 in US-Dollar, quarterly chart, Quod erat demonstrandum:
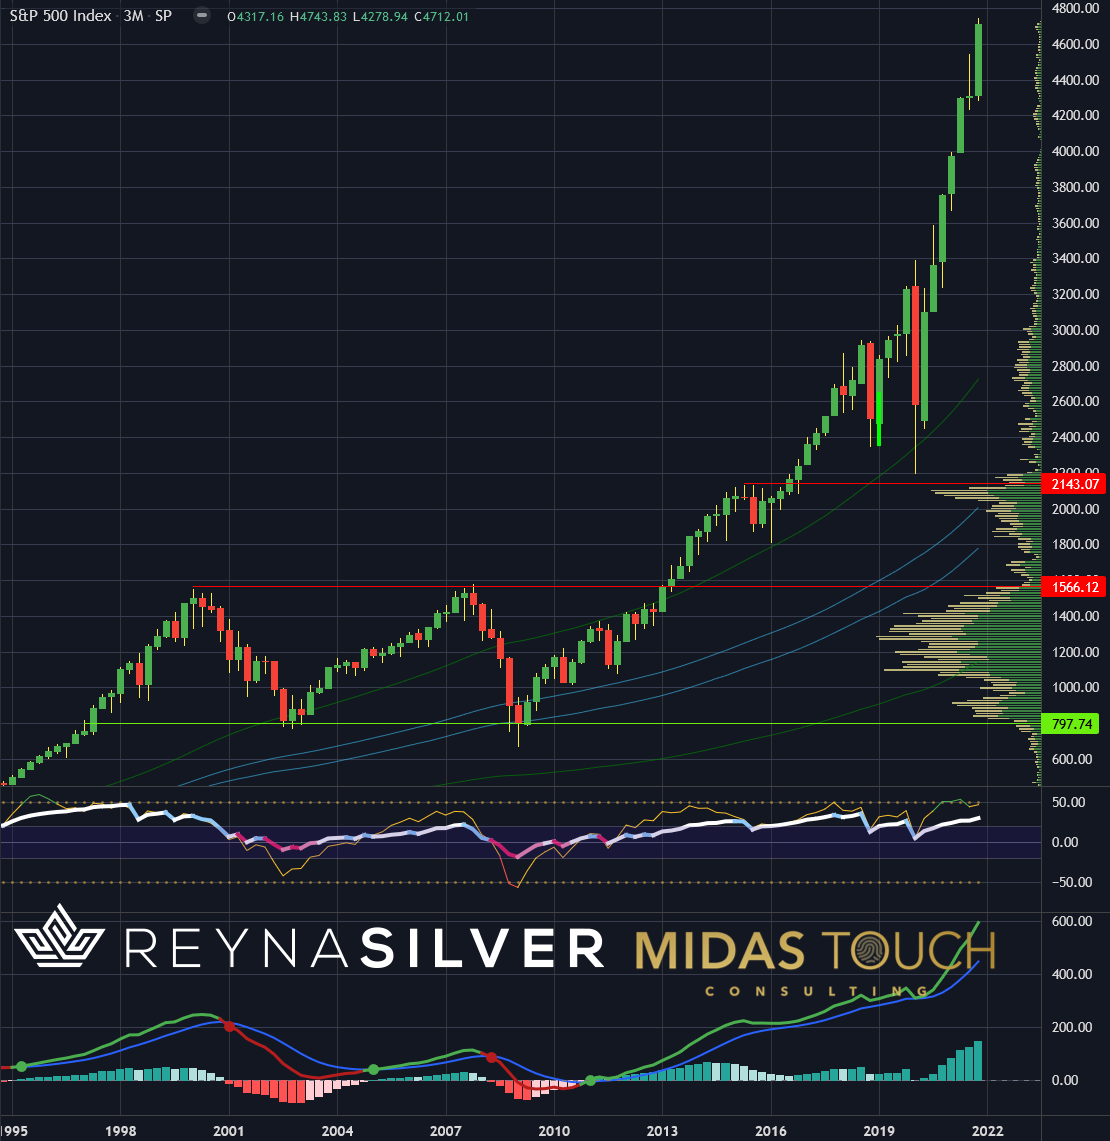
S&P 500 in US-Dollar, quarterly chart as of December 10th, 2021.
Still, some doubt left? Have a look at the above S&P500 chart, representing the broad market. Does that look like a healthy chart? Baby boomers and general stock-market participants might be in for a rude awakening once they realize how little their fiat currency is still worth when they cash in those stock portfolio investments.
Just compare your total living cost from 2020 with 2021. All positions from food to health insurance, from car gas to electricity bills. Calculate the percentage difference from those two numbers and add this percentage to the average acquisition cost of your physical silver, and you have the real value of your silver already now.
How does homelessness double to a half million people per day sleeping roofless factor in? Does this chart represent great times when we face supply chain disruptions? Or is it all smoke and mirrors, and once the music stops, there will be countless chairs missing for everyone to sit down?
Silver is moving up:
The essential principle in play is that markets are counterintuitive. Meaning your feelings might have switched from enthusiasm to uncertainty, even frustration, but probability facts are in direct opposition to one’s feelings. This principle is the underlying reason why moves out of extended congestion zones can result in substantial moves. Once emotionally weak hands are washed out, these breakouts come from an emotional perspective surprising. Bears step aside and bulls chase prices.
Feel free to join us in our free Telegram channel for daily real time data and a great community. If you like to get regular updates on our gold model, precious metals and cryptocurrencies you can also subscribe to our free newsletter.
This article does not contain investment advice or recommendations. Every investment and trading move involves risk, and readers should conduct their own research when making a decision. The views, thoughts and opinions expressed here are the author’s alone. They do not necessarily reflect or represent the views and opinions of Midas Touch Consulting.

