


Gold – Recovery ahead
The gold market is nearing the end of a difficult and very challenging year. Most precious metal investors must have been severely disappointed. Gold – Recovery ahead.
Review
2021 started quite bullish, as the gold price climbed rapidly towards US$1,960 at the beginning of the year. In retrospect, however, this peak on January 6th also represented the high for the year! In the following 11.5 months, gold did not even come close to reaching these prices again.
Instead, prices came under considerable pressure and only bottomed out at the beginning and then again at the end of March around US$1,680 with a double low. Interestingly, the low on March 8th at US$1,676 did hold until today. The subsequent recovery brought gold prices back above the round mark of US$1,900 within two months. But already on June 1st, another violent wave of selling started, which pushed gold prices down by US$150 within just four weeks.
Subsequently, gold bulls attempted a major recovery in the seasonally favorable early summer phase. However, they failed three times in this endeavor at the strong resistance zone around US$1,830 to US$1,835. As a result, sufficient bearish pressure had built up again, which was then unleashed in the flash crash on August 9th with a brutal sell-off within a few minutes and a renewed test of the US$1,677 mark.
Despite this complete washout, gold bulls were only able to recover from this shock with difficulty. Hence, gold traded sideways mainly between US$1,760 and US$1,815 for the following three months. It was not until the beginning of November that prices quickly broke out of this tenacious sideways phase and thus also broke above the 15-month downtrend-line. This was quickly followed by another rise towards US$1,877. However, and this is quite indicative of the ongoing corrective cycle since the all-time high in August 2020, gold prices made another hard U-turn within a few days and sold off even faster than they had risen before.
Since this last sell-off from US$1,877 down to US$1,762, gold has been stuck and kind of paralyzed for three weeks, primarily trading in a narrow range between US$1,775 and US$1,785. Obviously, the market seems to be waiting for the upcoming FOMC meeting.
Overall, gold has not been able to do much in 2021. Most of the time it has gone sideways and did everything to confuse participants. These treacherous market phases are the very most dangerous ones. Physical investors can easily sit through such a sideways shuffling. But leveraged traders had nothing to laugh about. Either the movements in gold changed quickly and abruptly or almost nothing happened for days and sometimes even weeks while the trading ranges were shrinking.
Technical Analysis: Gold in US-Dollar
Weekly Chart – Bottoming out around US$1,780?
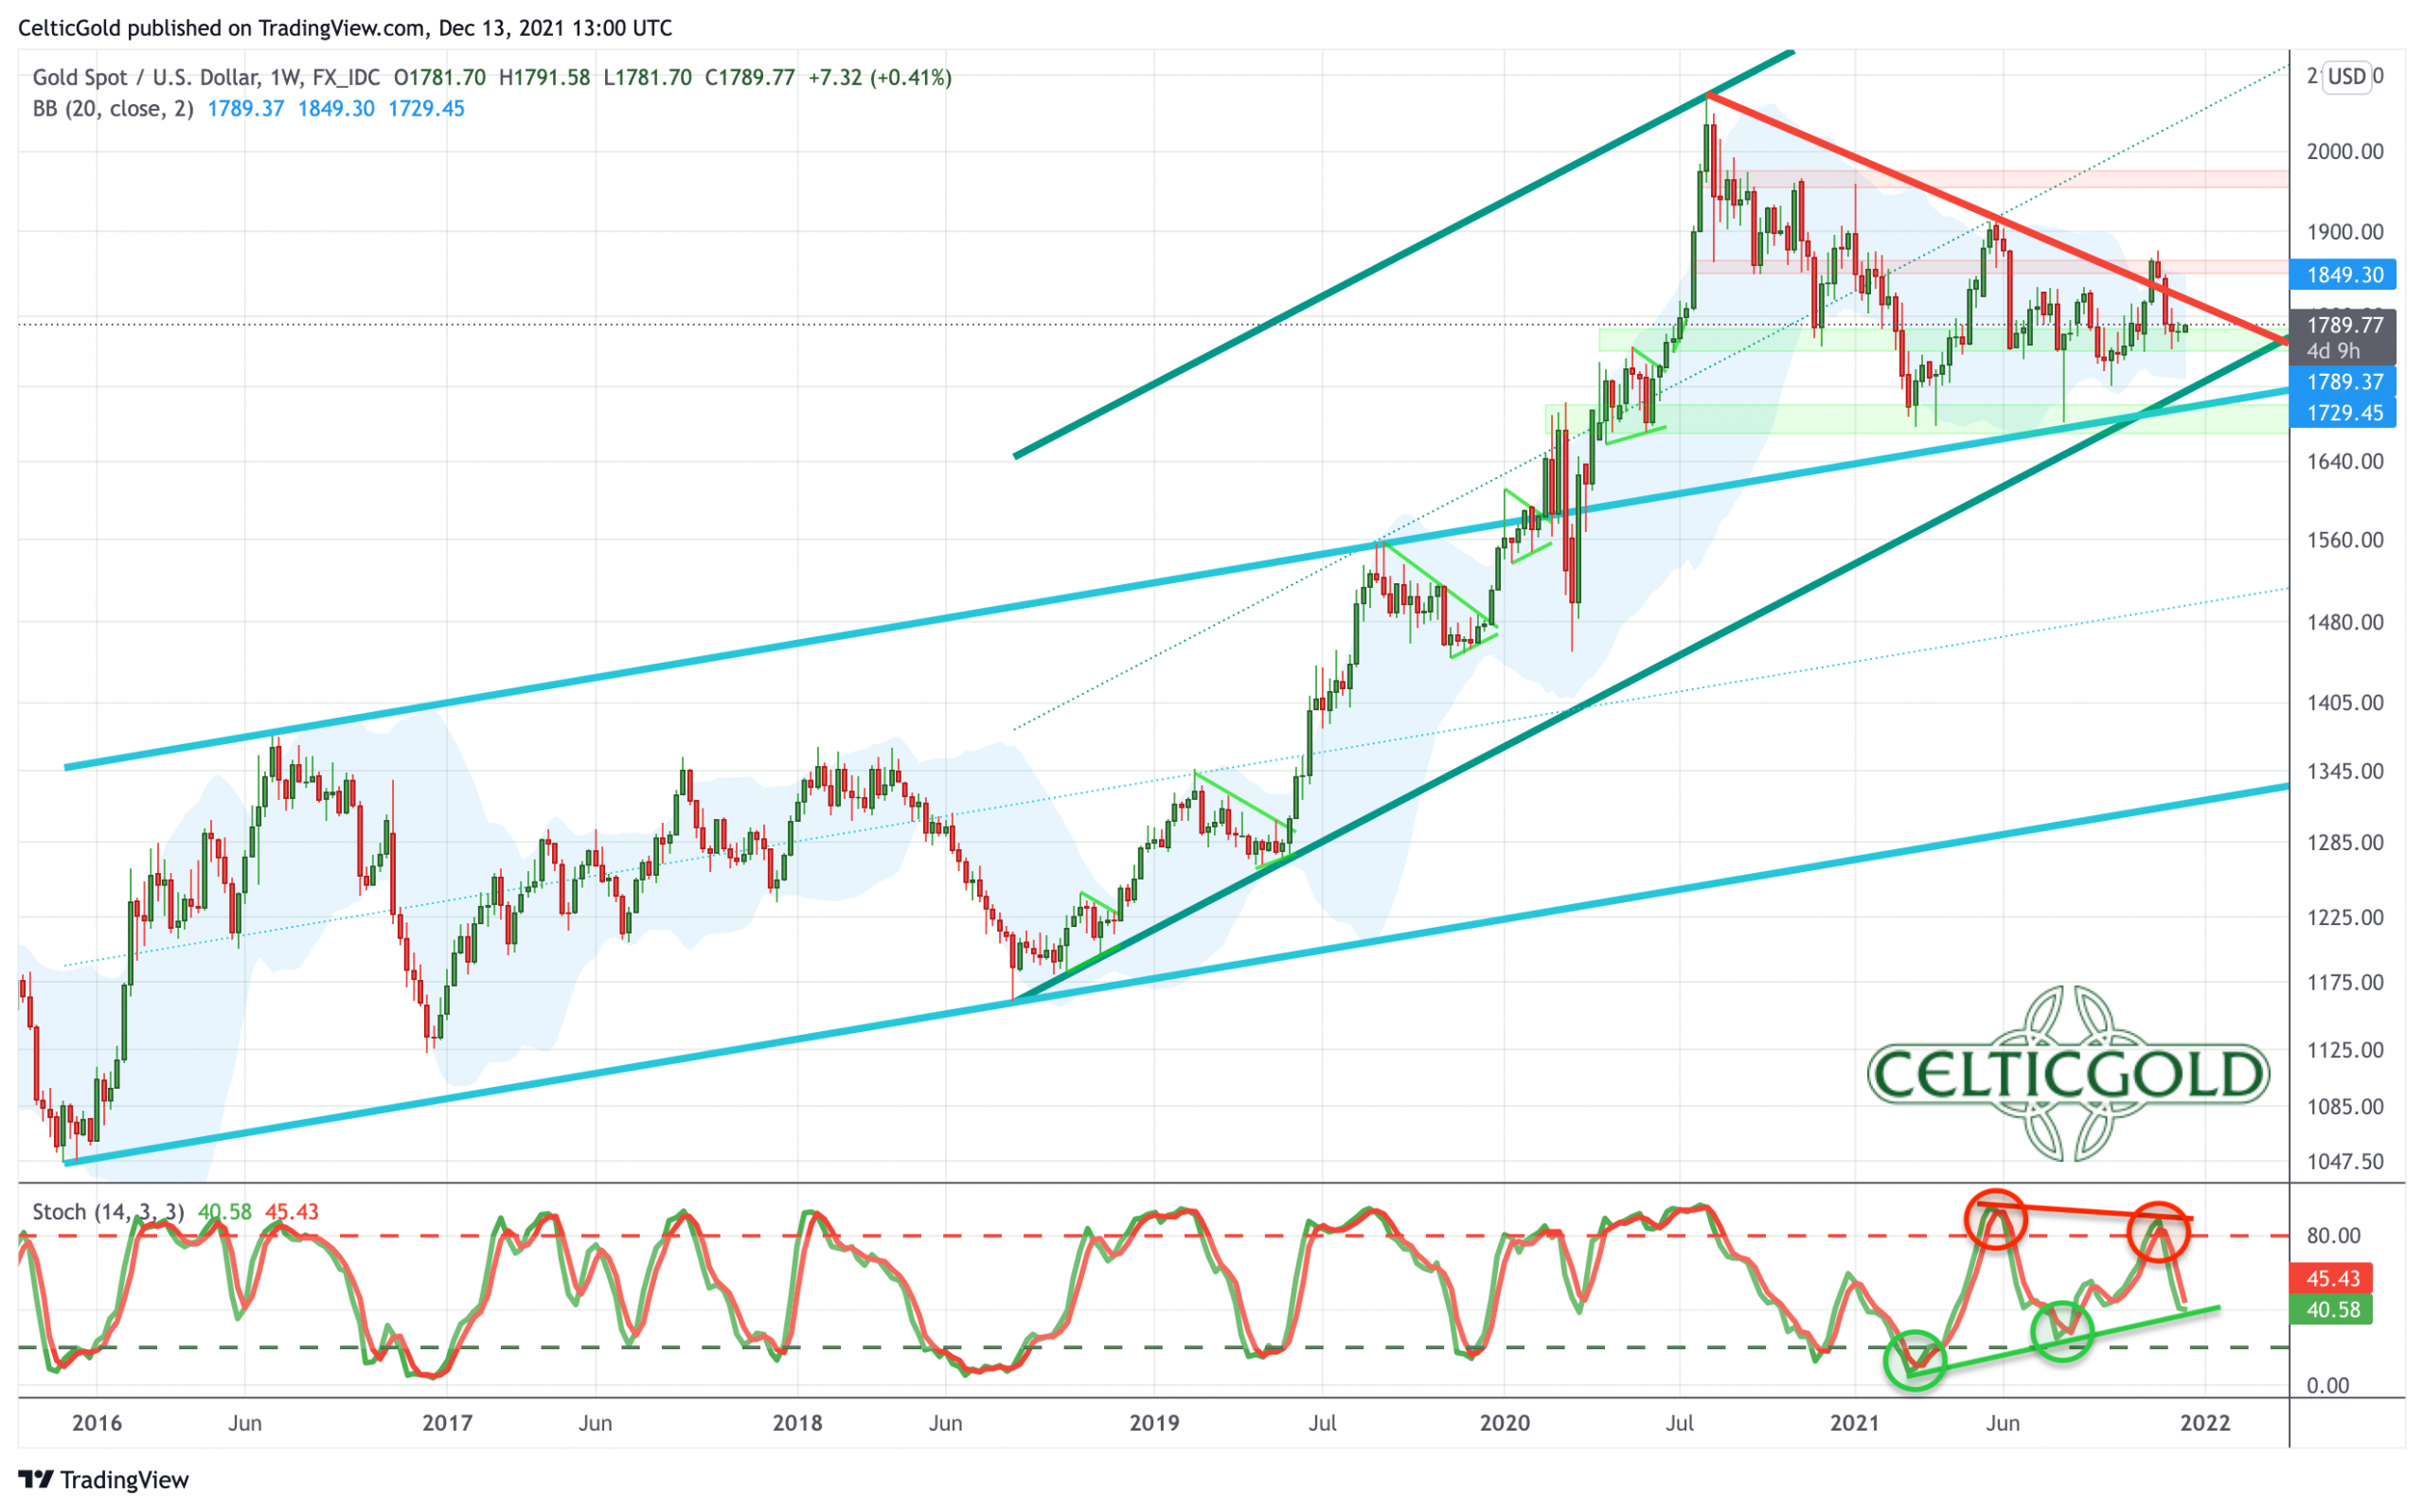
Gold in US-Dollars, weekly chart as of December 13th, 2021. Source: Tradingview
Despite the 15-month correction, gold has been able to easily hold above the uptrend channel, which goes back to December 2015. The steeper uptrend channel that began in the summer of 2018 is also still intact and would only be broken if prices would fall below US$1,700. Support between US$1,760 and US$1,780 has held over the last three weeks too. The weekly stochastic oscillator is currently neutral but has been slowly tightening for months.
Overall, gold is currently trading right in the middle of its two Bollinger bands on the weekly chart. Thus, the setup is neutral. However, bottoming out around US$1,780 has a slightly increased probability.
Daily Chart – New buying signal
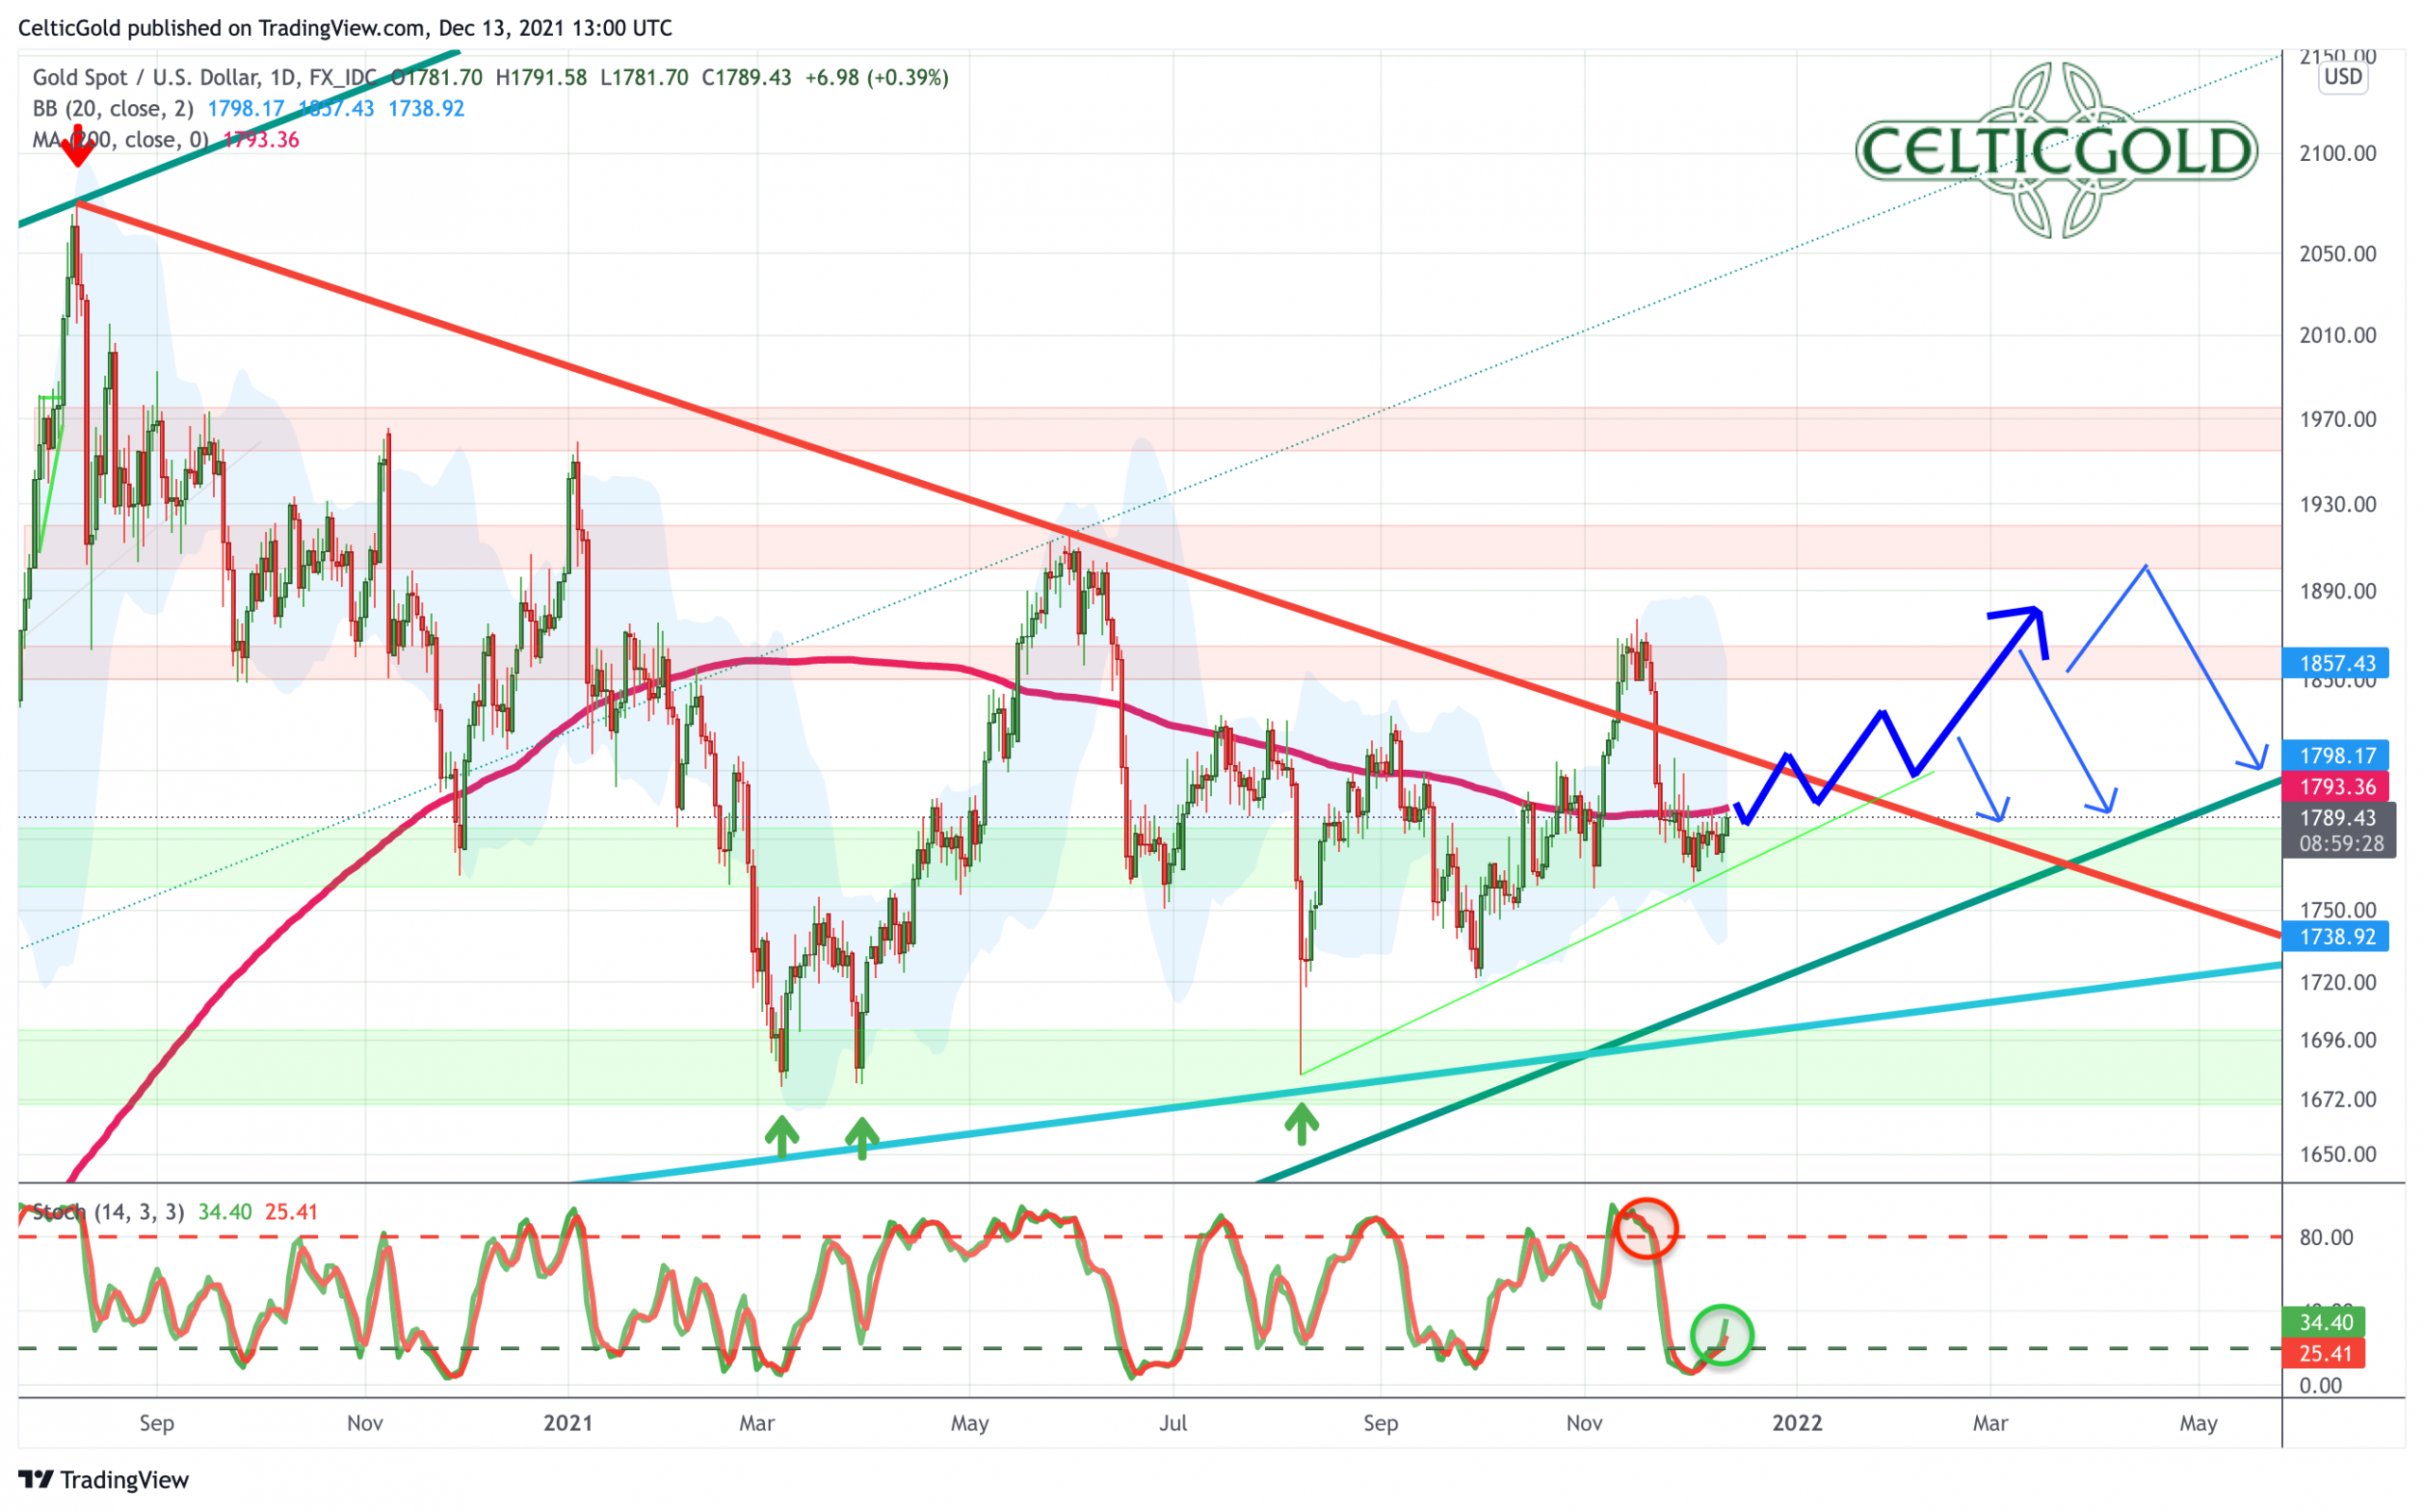
Gold in US-Dollars, daily chart as of December 13th, 2021. Source: Tradingview
On the daily chart, gold has been searching for support around its slightly rising 200-day moving average (US$1,793) over the last three weeks. However, eye contact has been maintained, hence a recapturing of this important moving average is still quite possible. Despite the failed breakout in November, the current price action has not moved away from the downtrend-line. A further attack on this resistance thus appears likely. Encouragingly, the daily stochastic has turned up from its oversold zone and provides a new buy signal.
In summary, the chances of a renewed recovery starting in the near future predominate on the daily chart. In the first step, such a bounce could run to around US$1,815. Secondly, the bulls would then have to clear the downtrend-line, which would release further upward potential towards US$1,830 and US$1,870. The very best case scenario might see gold being able to rise to the psychological number of US$1,900 in the next two to four months. On the downside however, the support between US$1,760 and US$1,780 must be held at all costs. Otherwise, the threat of further downward pressure towards US$1,720 and US$1,680 intensifies.
Commitments of Traders for Gold – Recovery ahead
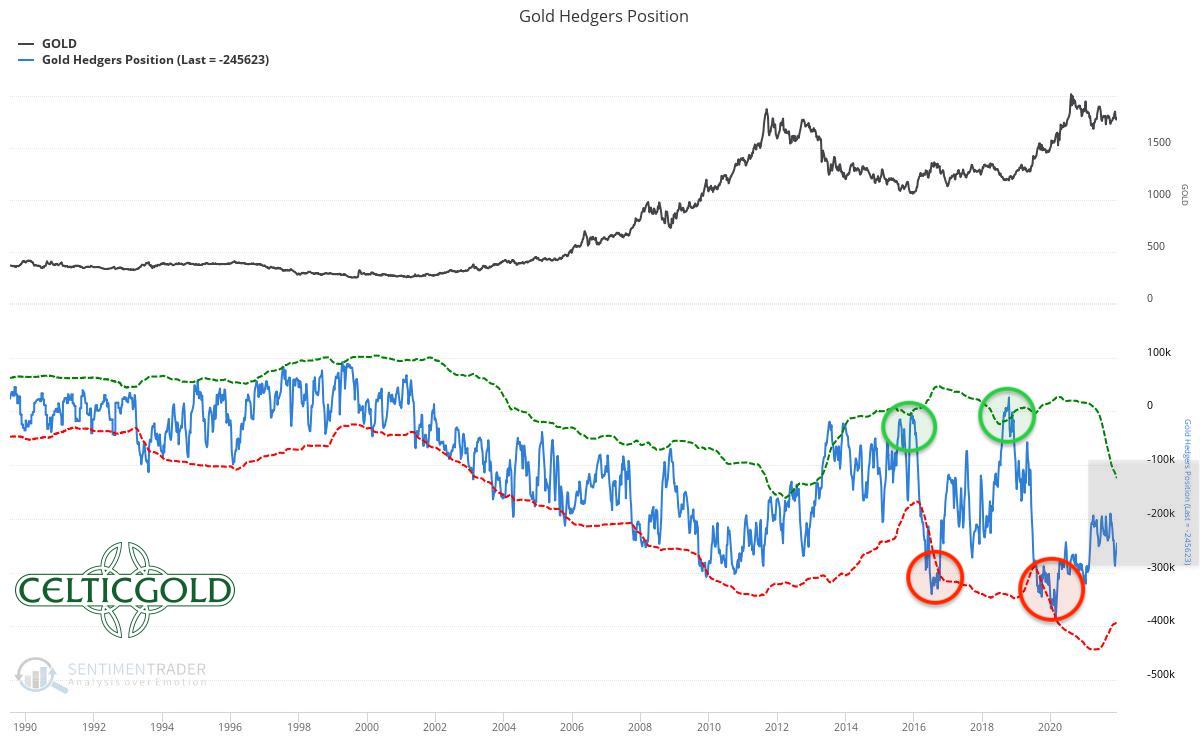
Commitments of Traders for Gold as of December 12th, 2021. Source: Sentimentrader
The commercial net short position in the gold futures market was last reported at 245,623 contracts sold short. Although the setup has somewhat improved due to the significant price decline in recent weeks, the overall constellation continues to move in neutral waters.
There is still no clear contrarian bottleneck in the futures market, where professional traders should have reduced their net short positions to below 100,000 contracts at least. Until then, it would still be a long way from current levels, which could probably only happen with a price drop towards US$1,625. As long as this does not happen, any larger move up will probably have a hard time.
In summary, the CoT report provides a neutral signal and thus stands in the way of a sustainable new uptrend. However, given the current futures market data, temporary recoveries over a period of about one to three months are currently possible.
Sentiment for Gold – Recovery ahead
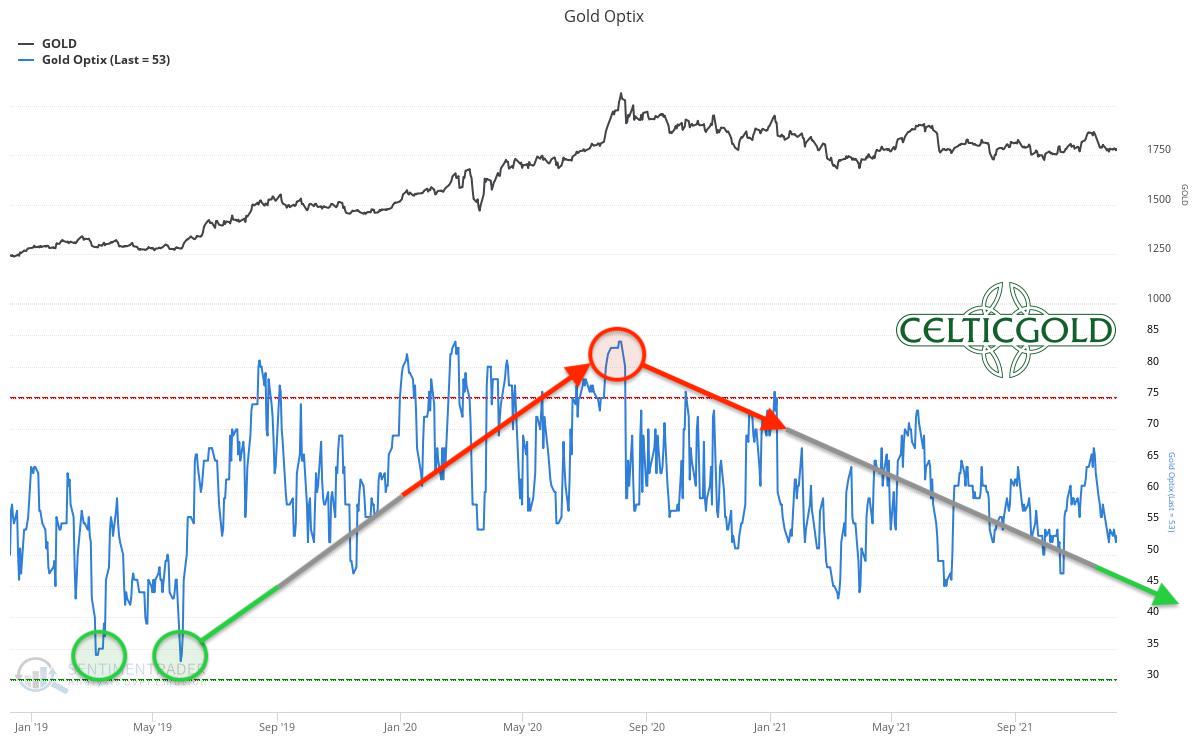
Sentiment Optix for Gold as of December 12th, 2021. Source: Sentimentrader
Sentiment for gold has been meandering in the neutral and not very meaningful middle zone for more than a year. Furthermore, a complete capitulation or at least very high pessimism levels are still missing to end the ongoing correction. Such a high pessimism was last seen in spring of 2019, whereupon gold was able to rise more than US$800 from the lows at US$1,265 to US$2,075 within 15 months.
This means that in the big picture, sentiment analysis continues to lack total capitulation. This can only be achieved with deeply fallen prices.
In the short term, however, the Optix for gold has almost reached its lows for the year. At the same time, german mainstream press is currently asking, appropriately enough, “Why doesn’t gold protect against inflation?
This gives us a short-term contrarian buy signal, which should enable a recovery rally over coming one to three months.
Seasonality for Gold – Recovery ahead
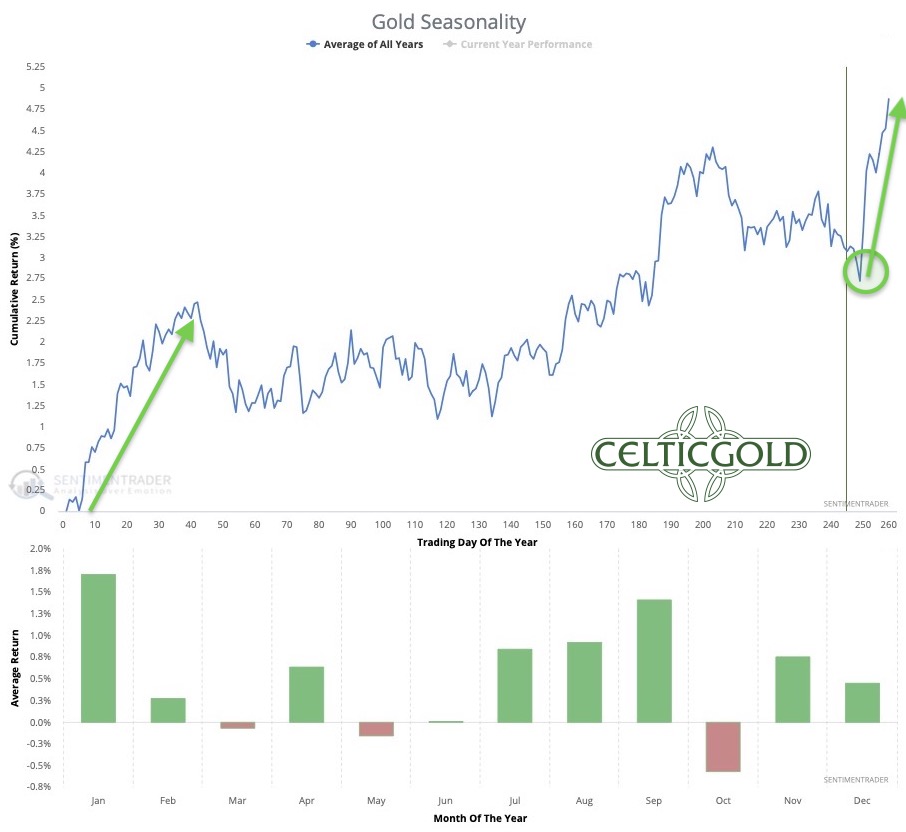
Seasonality for Gold over the last 53-years as of December 12th, 2021. Source: Sentimentrader
As so often in recent years, precious metal investors are being put to the test in the fourth quarter of 2021. In the past, however, there was almost always a final sell-off around the last FOMC meeting between mid-November and mid-December. And this was always followed by an important low and a trend reversal. This year, everything points to December 15th or 16th. Following the FOMC interest rate decision and the FOMC press conference, the start of a recovery would be extremely typical.
Statistically, gold prices usually finish the last two weeks of the year with higher prices, because trading volume in the west world is very low over the holidays, while in Asia, and especially in China and India, trading is more or less normal. Also, the “tax loss selling” in mining stocks should be over by now.
Overall, the seasonal component turns “very bullish” in a few days, supporting precious metal prices from mid-December onwards. Typically, January in particular is a very positive month for gold, but the favorable seasonal period lasts until the end of February.
Macro update and Crack-up-Boom:
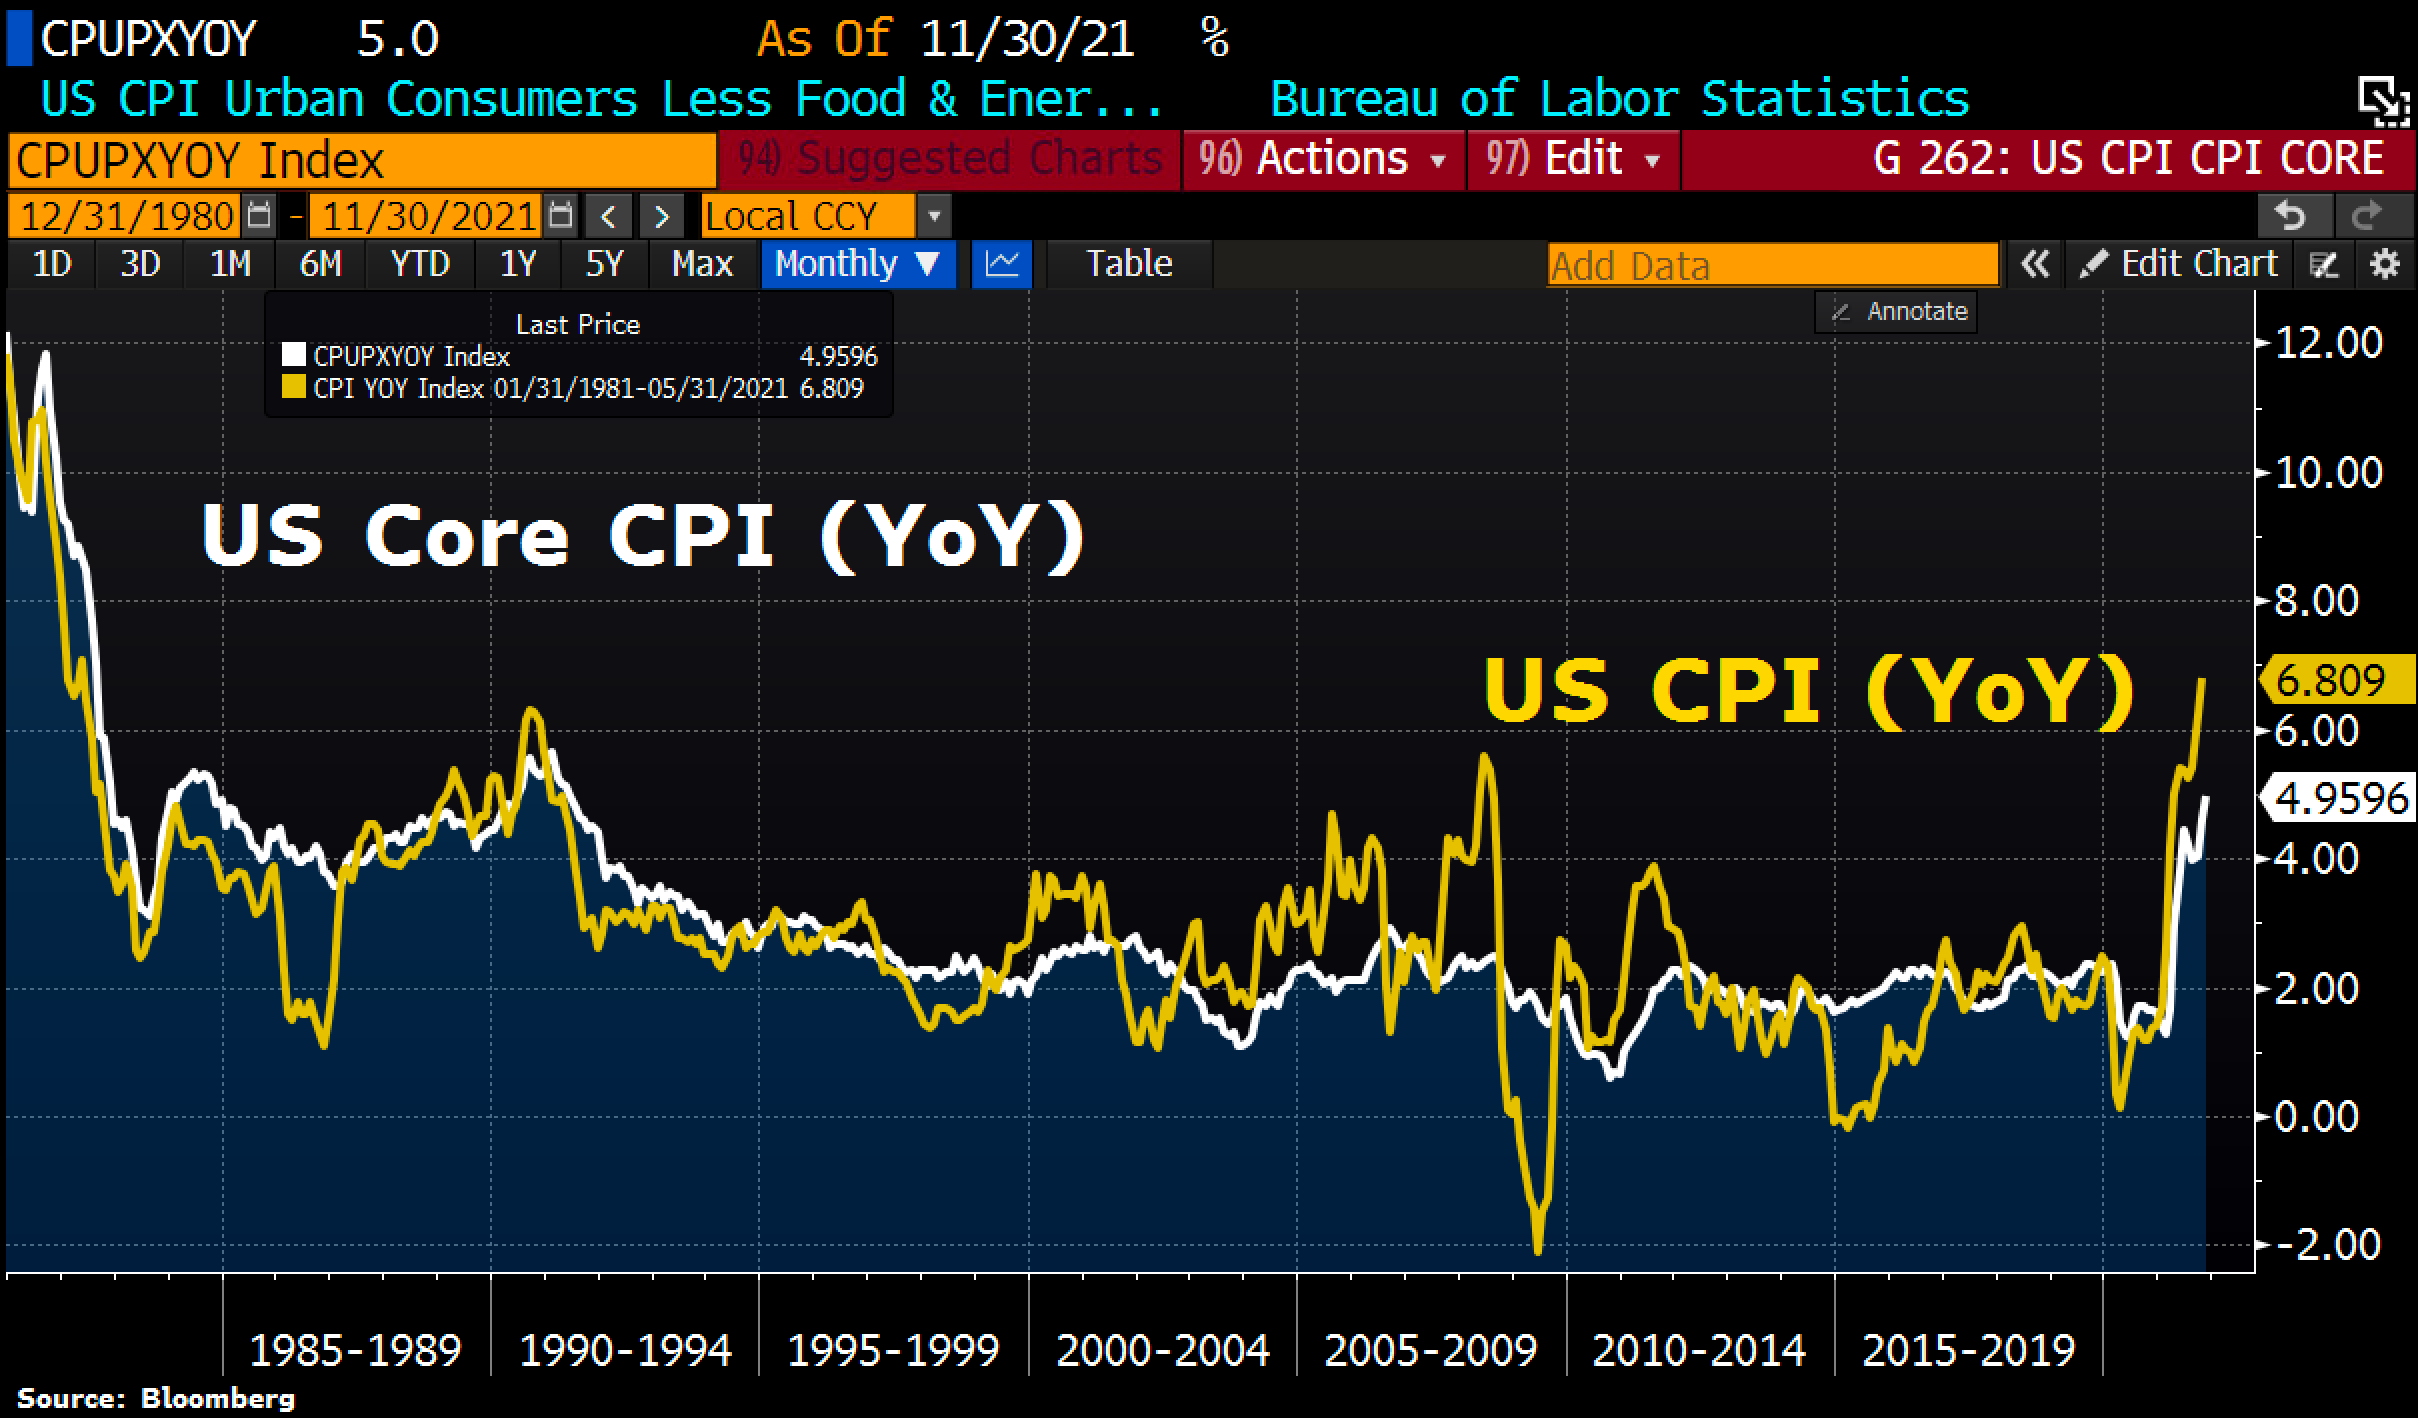
US-Inflation as of November 30th, 2021 ©Holger Zschaepitz
Last Friday, inflation in the U.S. was reported to have risen to 6.8% for the month of November. This is the fastest price increase since 1982, when Ronald Reagan was US president, and the US stock markets had started a new bull market after a 16-year consolidation phase. Today, by contrast, the financial markets have been on the central banks’ drip for more than a decade, if not more than two. The dependence is enormous and a turn away from the money glut is unthinkable.
Nevertheless, the vast majority of market participants still allow themselves to be bluffed by the Fed and the other central banks and blindly believe the fairy tales of these clowns.
The Global US-Dollar Short Squeeze
However, while inflation figures worldwide are going through the roof due to the gigantic expansion of the money supply and the supply bottlenecks, the US-Dollar continues to rise at the same time. A nasty US-Dollar short squeeze has been building up since early summer.
The mechanism behind this is not easy to understand and gold bugs in particular often have a hard time with it. From a global perspective, the US-Dollar is still the most important reserve currency and thus also the most important international medium of exchange as well as the most important store of value for almost all major countries. Completely independently of this, many of these countries still use their own currency domestically. International oil trade and numerous other commodities are also invoiced and settled in US-Dollar. For example, when France buys oil from Saudi Arabia, it does not pay in its own currency, EUR, but in USD. Through this mechanism, there has been a solid demand for US-Dollar practically non-stop for decades.
The US-Dollar system
The big risk of this “US-Dollar system”, however, is that many foreign governments and companies borrow in US-Dollar, even though most of their revenue is generated in the respective national currency. The lenders of these US-Dollar are often not even US institutions. Foreign lenders also often lend to foreign borrowers in dollars. This creates a currency risk for the borrower, a mismatch between the currency of their income and the currency of their debt. Borrowers do this because they have to pay lower interest rates for a loan in US-Dollar than in their own national currency. Sometimes dollar-denominated bonds and loans are also the only way to get liquidity at all.
Thus, it is not the lender who bears the currency risk, but the borrower. In this way, the borrower is basically taking a short position against the US-Dollar, whether he wants to or not. Now, if the dollar strengthens, this becomes a disadvantage for him, because his debt increases in relation to his income in the local currency. If, on the other hand, the US-Dollar weakens, the borrower is partially relieved of debt because his debt falls in relation to his income in the local currency.
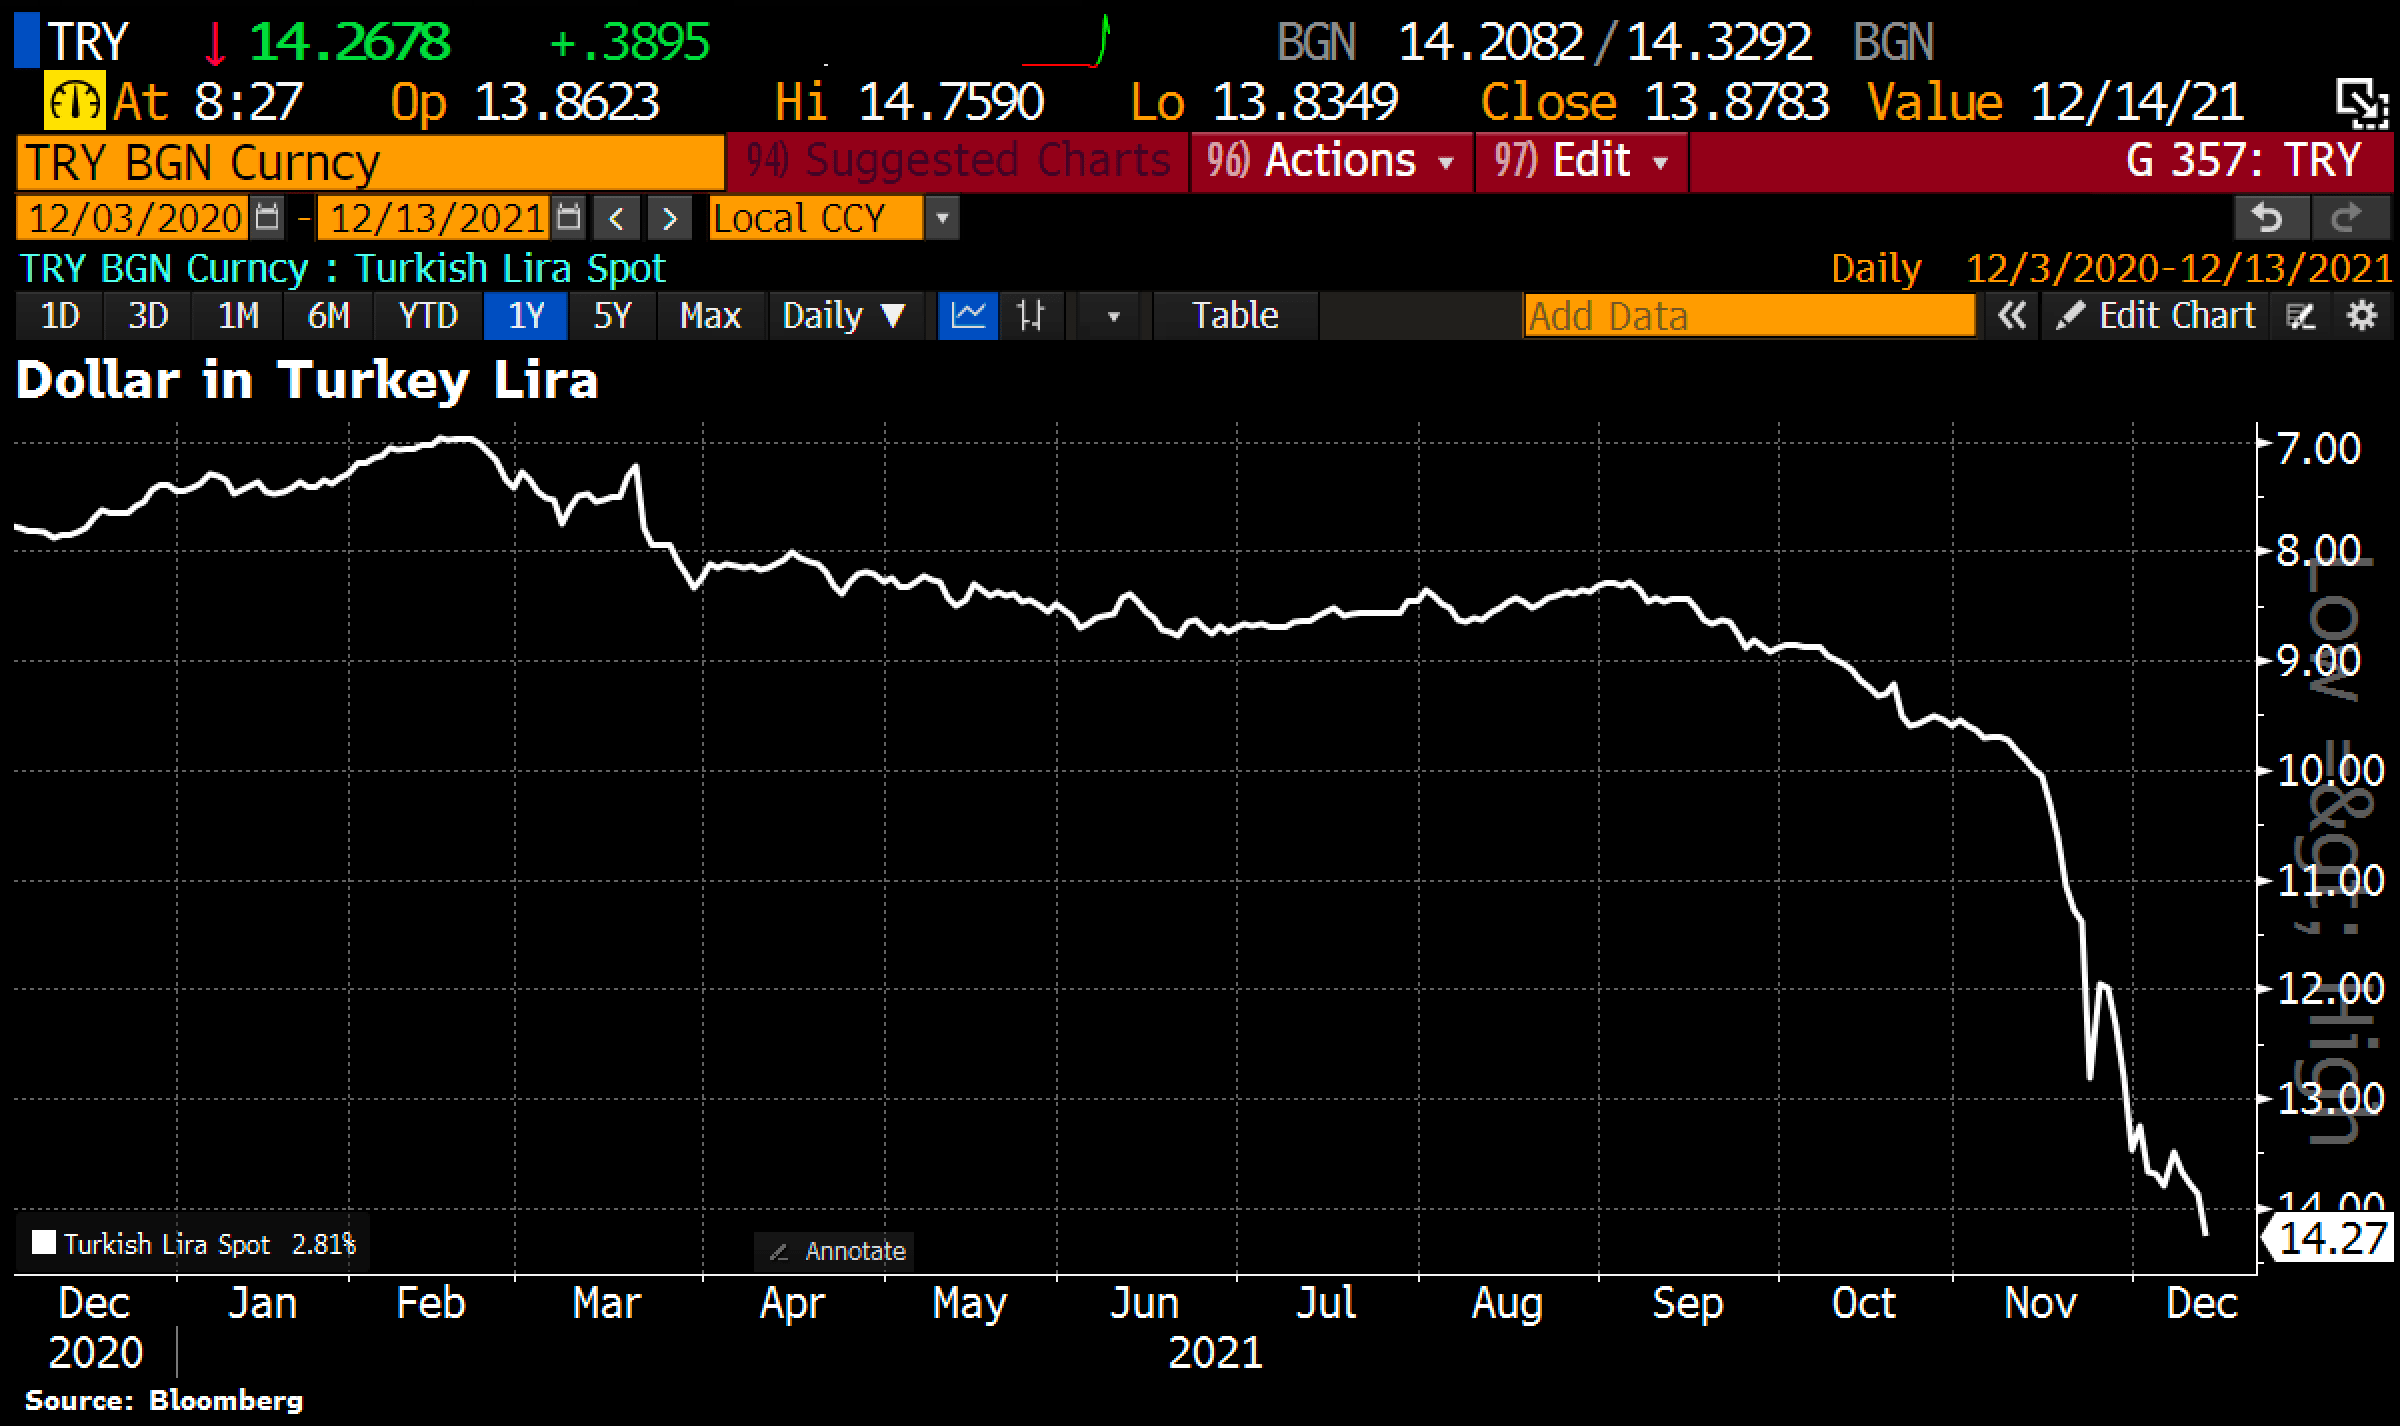
Turkish Lira since December 2020 as of December 13th, 2021.©Holger Zschaepitz
Looking, for example, at the dramatic fall of the Turkish lira, one can well imagine the escalating flight from emerging market currencies into the US-Dollar. Since the beginning of the year, Turks have lost almost 50% of their purchasing power against the US-Dollar. A true nightmare. Other emerging market currencies such as the Argentine peso, the Thai baht or even the Hungarian forint have also come under significant pressure this year. On top, the Evergrande bankruptcy and the collapse of the real estate bubble in China may also have contributed significantly to this smoldering wild fire. All in all, the “US-Dollar short squeeze” may well continue despite a technically heavily overbought situation.
Sooner or later, however, the Federal Reserve will have to react and row back again. Otherwise, the strength of the US-Dollar will suddenly threaten a deflationary implosion in worldwide stock markets and in the entire financial system. The global house of cards would not survive such shock waves.
The tapering is “nearish”
It is therefore highly likely that the Fed will soon postpone the so-called “tapering” and the “interest rate hikes” until further notice. To explain this, they will surely come up with some gibberish with complicated-sounding words. All in all, an end to loose monetary policy is completely unthinkable. Likewise, the supply bottlenecks will remain for the time being. This means that inflation will continue to be fueled by both monetary and scarcity factors and, on top of that, by the psychological inflationary spiral. In these crazy times, investors in all sectors will have to patiently endure temporary volatility and the accompanying sharp pullbacks.
Conclusion: Gold – Recovery ahead
With gold and silver, you can protect yourself well against any scenario. In the medium and long term, however, this does not necessarily mean that precious metal prices will always track inflation one-to-one and go through the roof in the coming years. Most likely, the exponential expansion of the money supply will continue and accelerate. Hence, significantly higher gold and silver prices can then be expected. If, on the other hand, the system should implode, gold and silver will be able to play out their monetary function to the fullest and one will be glad to own them when almost everything else has to be written down to zero.
In the bigger picture, however, gold and silver fans will have to remain patient for the time being, because the clear end of the months-long correction has not yet been sealed. Rather, the most important cycle in the gold market should deliver an important low approximately every 8 years. The last time this happened was in December 2015 at US$1,045. This means that the correction in the gold market could continue over the next one or even two years until the trend reverses and the secular bull market finally continues.
In the short term, however, the chances of a recovery in the coming weeks into the new year and possibly even into spring are quite good. But it should only gradually become clearer after the Fed’s interest rate decision on Wednesday what will happen next. A rally towards US$1,815 and US$1,830 has a clearly increased probability. Beyond that, US$1,870 and in the best case even US$1,910 could possibly be reached in February or March. For this to happen, however, the bulls would have to do a lot of work.
Analysis initially written and published on December 13th, 2021, by www.celticgold.eu. Translated into English and partially updated on December 13th, 2021.
Feel free to join us in our free Telegram channel for daily real time data and a great community.
If you like to get regular updates on our gold model, precious metals and cryptocurrencies you can subscribe to our free newsletter.

