Silver – Moving to the fast track.
Since February 14th, precious metal prices have been surging strongly and almost continuously. During this period, the price of gold has been setting new all-time highs almost daily until Friday 12th of April. Only since reaching a new peak at USD 2,340 per ounce, there has been a consolidation at a high levels, roughly speaking between USD 2,325 and USD 2,400 throughout last week. Even though, gold prices are down nearly USD 70 compared to Friday’s close, there are only little indications of an end to the uptrend yet. Instead, we continue to anticipate gold reaching our price target of around USD 2,535 in the coming weeks.
Silver – Moving to the fast track.
One of the reasons why we remain bullish despite the increasingly overbought conditions, growing euphoria and the sharp pullback today is the fact that silver has only recently started to show up on the dance floor of the ongoing party since early October. Typically, silver only kicks into high gear towards the end of a rally in the precious metals sector, and then significantly outpaces gold on the home stretch. Currently, this final sprint is still pending in our view.
With some strong trading days and an initial assault on the resistance zone around USD 30 per ounce, silver has already caught attention in the past three weeks. However, despite several days of consolidation at a high level, no clear reversal signals have emerged, indicating a strong likelihood of an imminent overtaking maneuver and significant outperformance in the next two to three weeks. A potential price target lies in the range of around USD 35 per ounce!
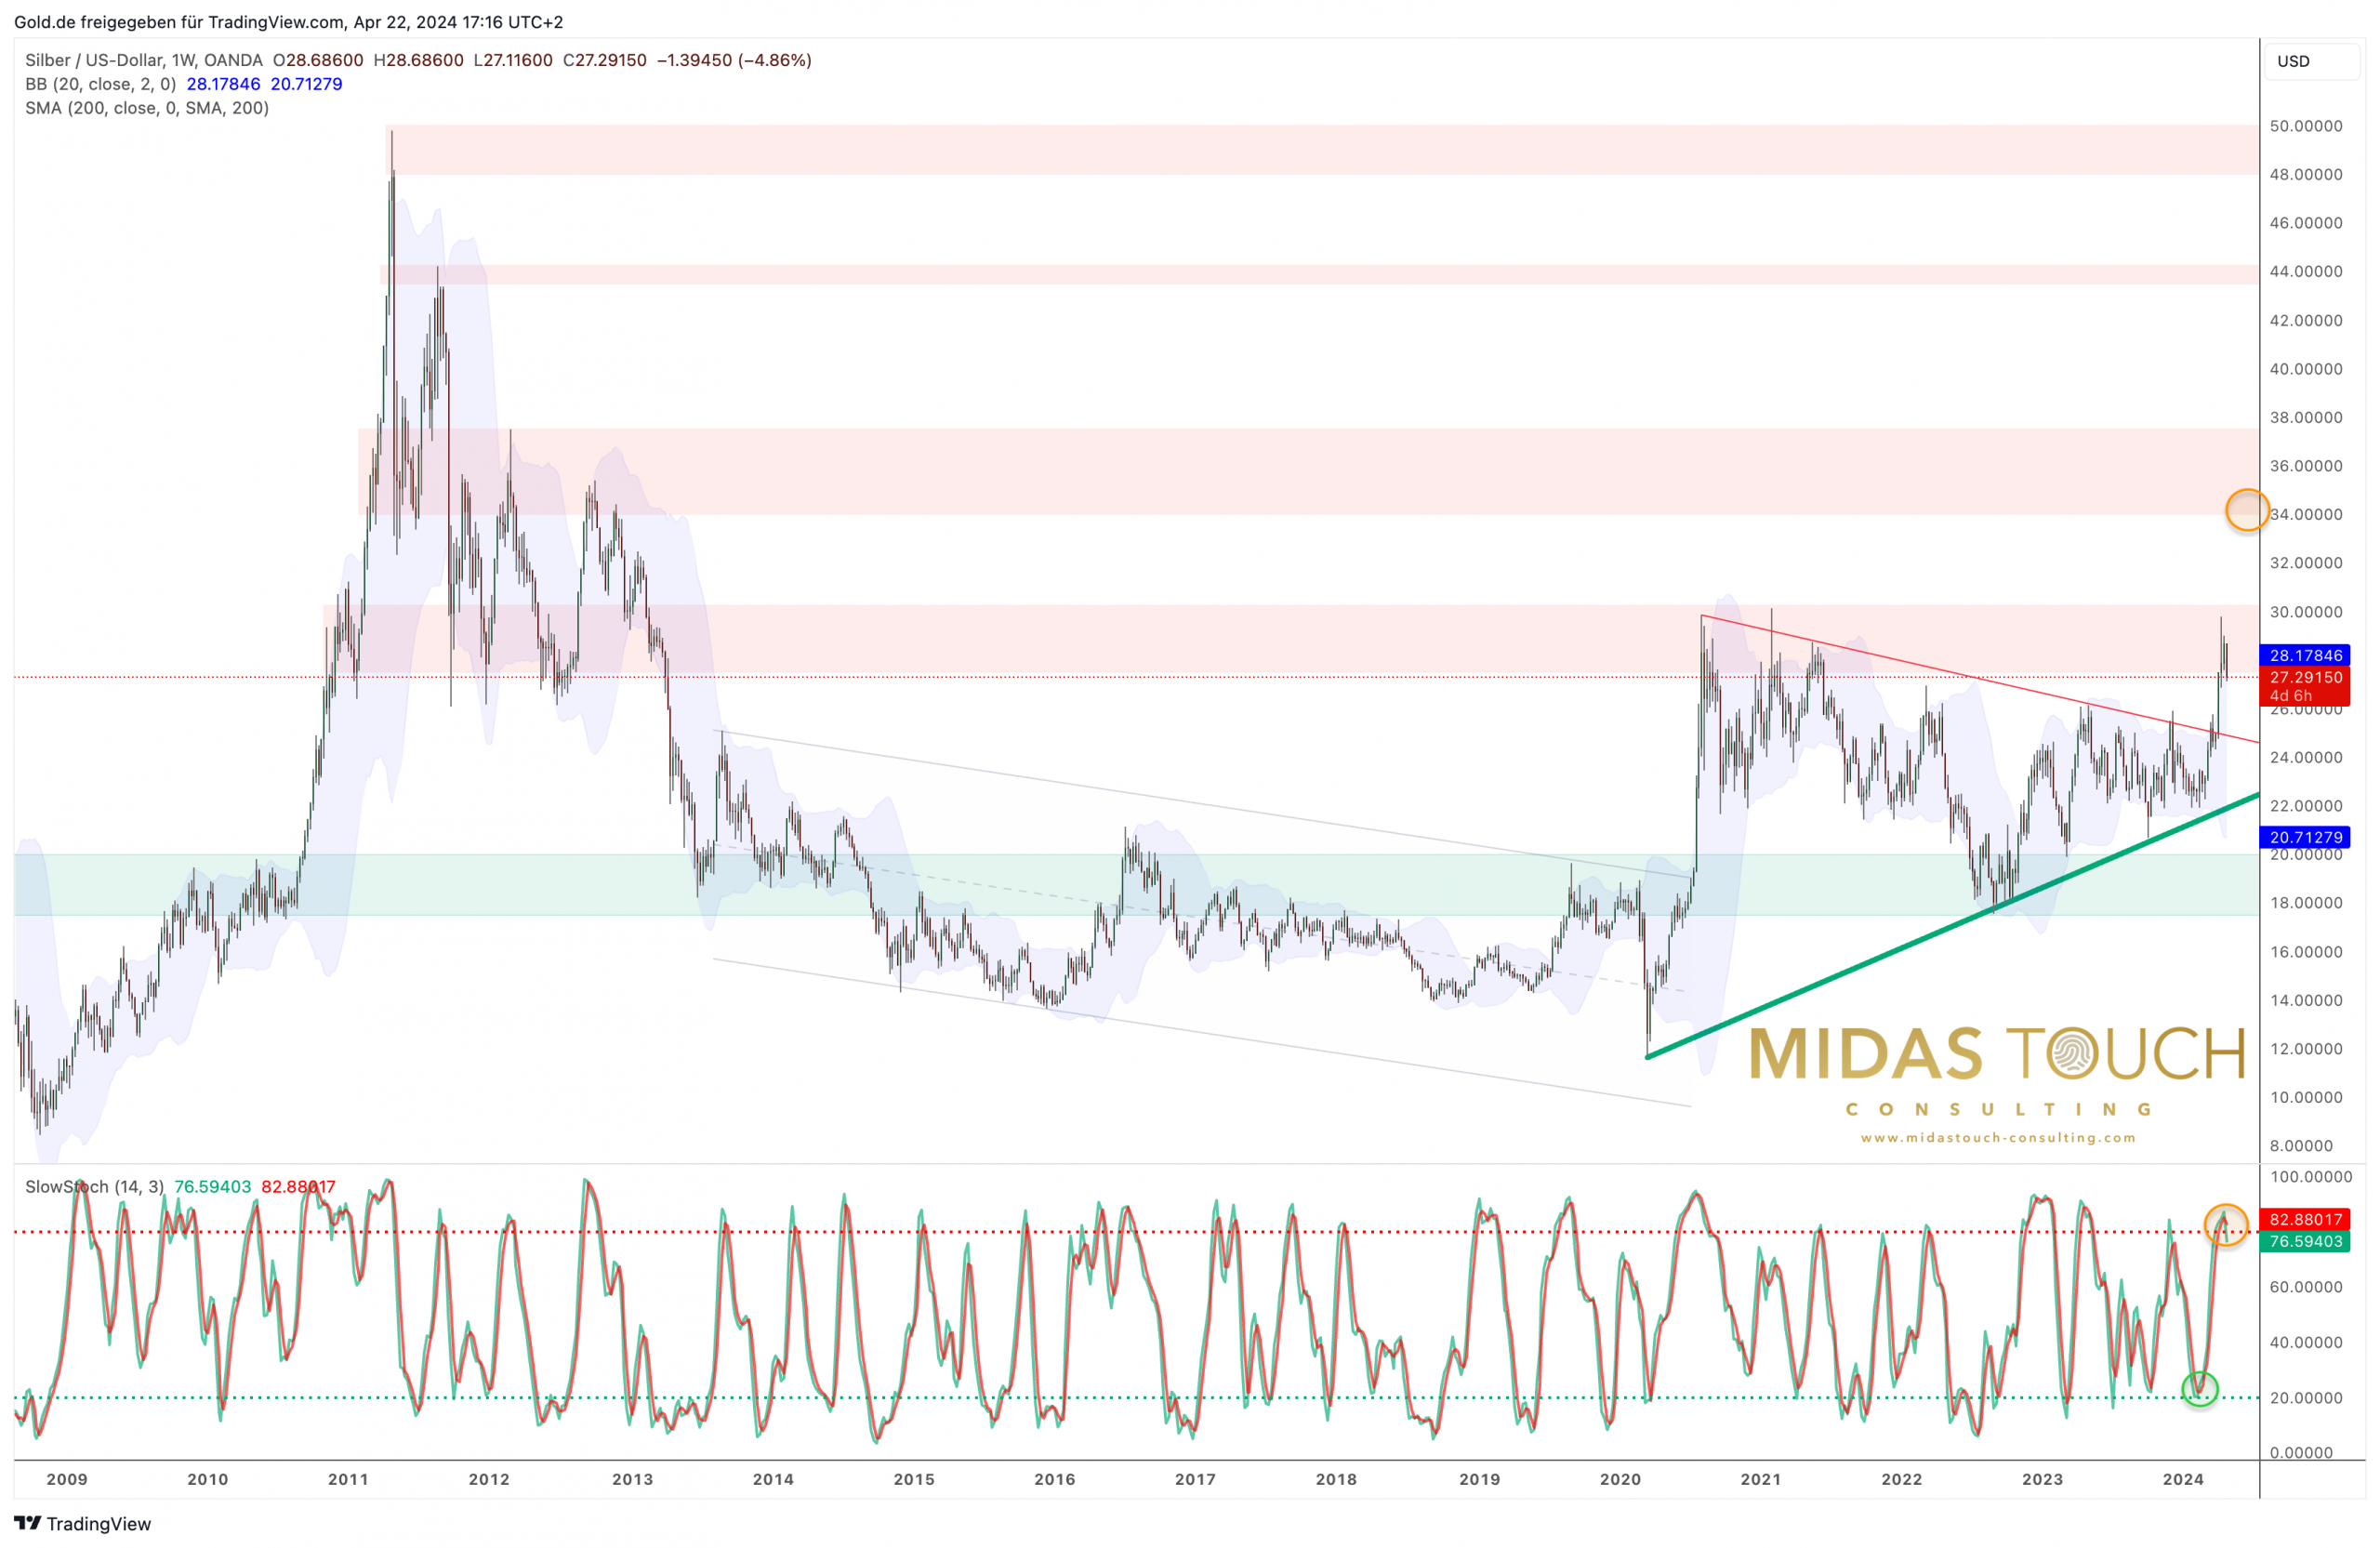
Silver in US-Dollar – Weekly Chart

Silver in US-Dollar, daily chart as of April 22nd 2024. Source: Midas Touch Consulting
In the grand scheme of things, since its peak in May 2011 at around USD 50 per ounce, the price of silver corrected its ten-year bull market with a long and persistent downward movement. It wasn’t until March 18th, 2020, when the final low was reached at USD 11.63 per ounce. From there, silver prices initially rebounded sharply to around USD 30 per ounce, only to then consolidate over the last four years within a large triangle pattern.
With the breakout from this triangle pattern, it appears that the long period of suffering for silver enthusiasts may finally be coming to an end. Since surpassing USD 25 per ounce about four weeks ago, a strong push higher has been underway. Although reaching the all-time high at USD 50 per ounce is still a long way off, if the breakthrough above the strong resistance zone around USD 30 per ounce is achieved soon, steep price increases up to the next resistance zone around USD 35 per ounce could become quickly feasible.
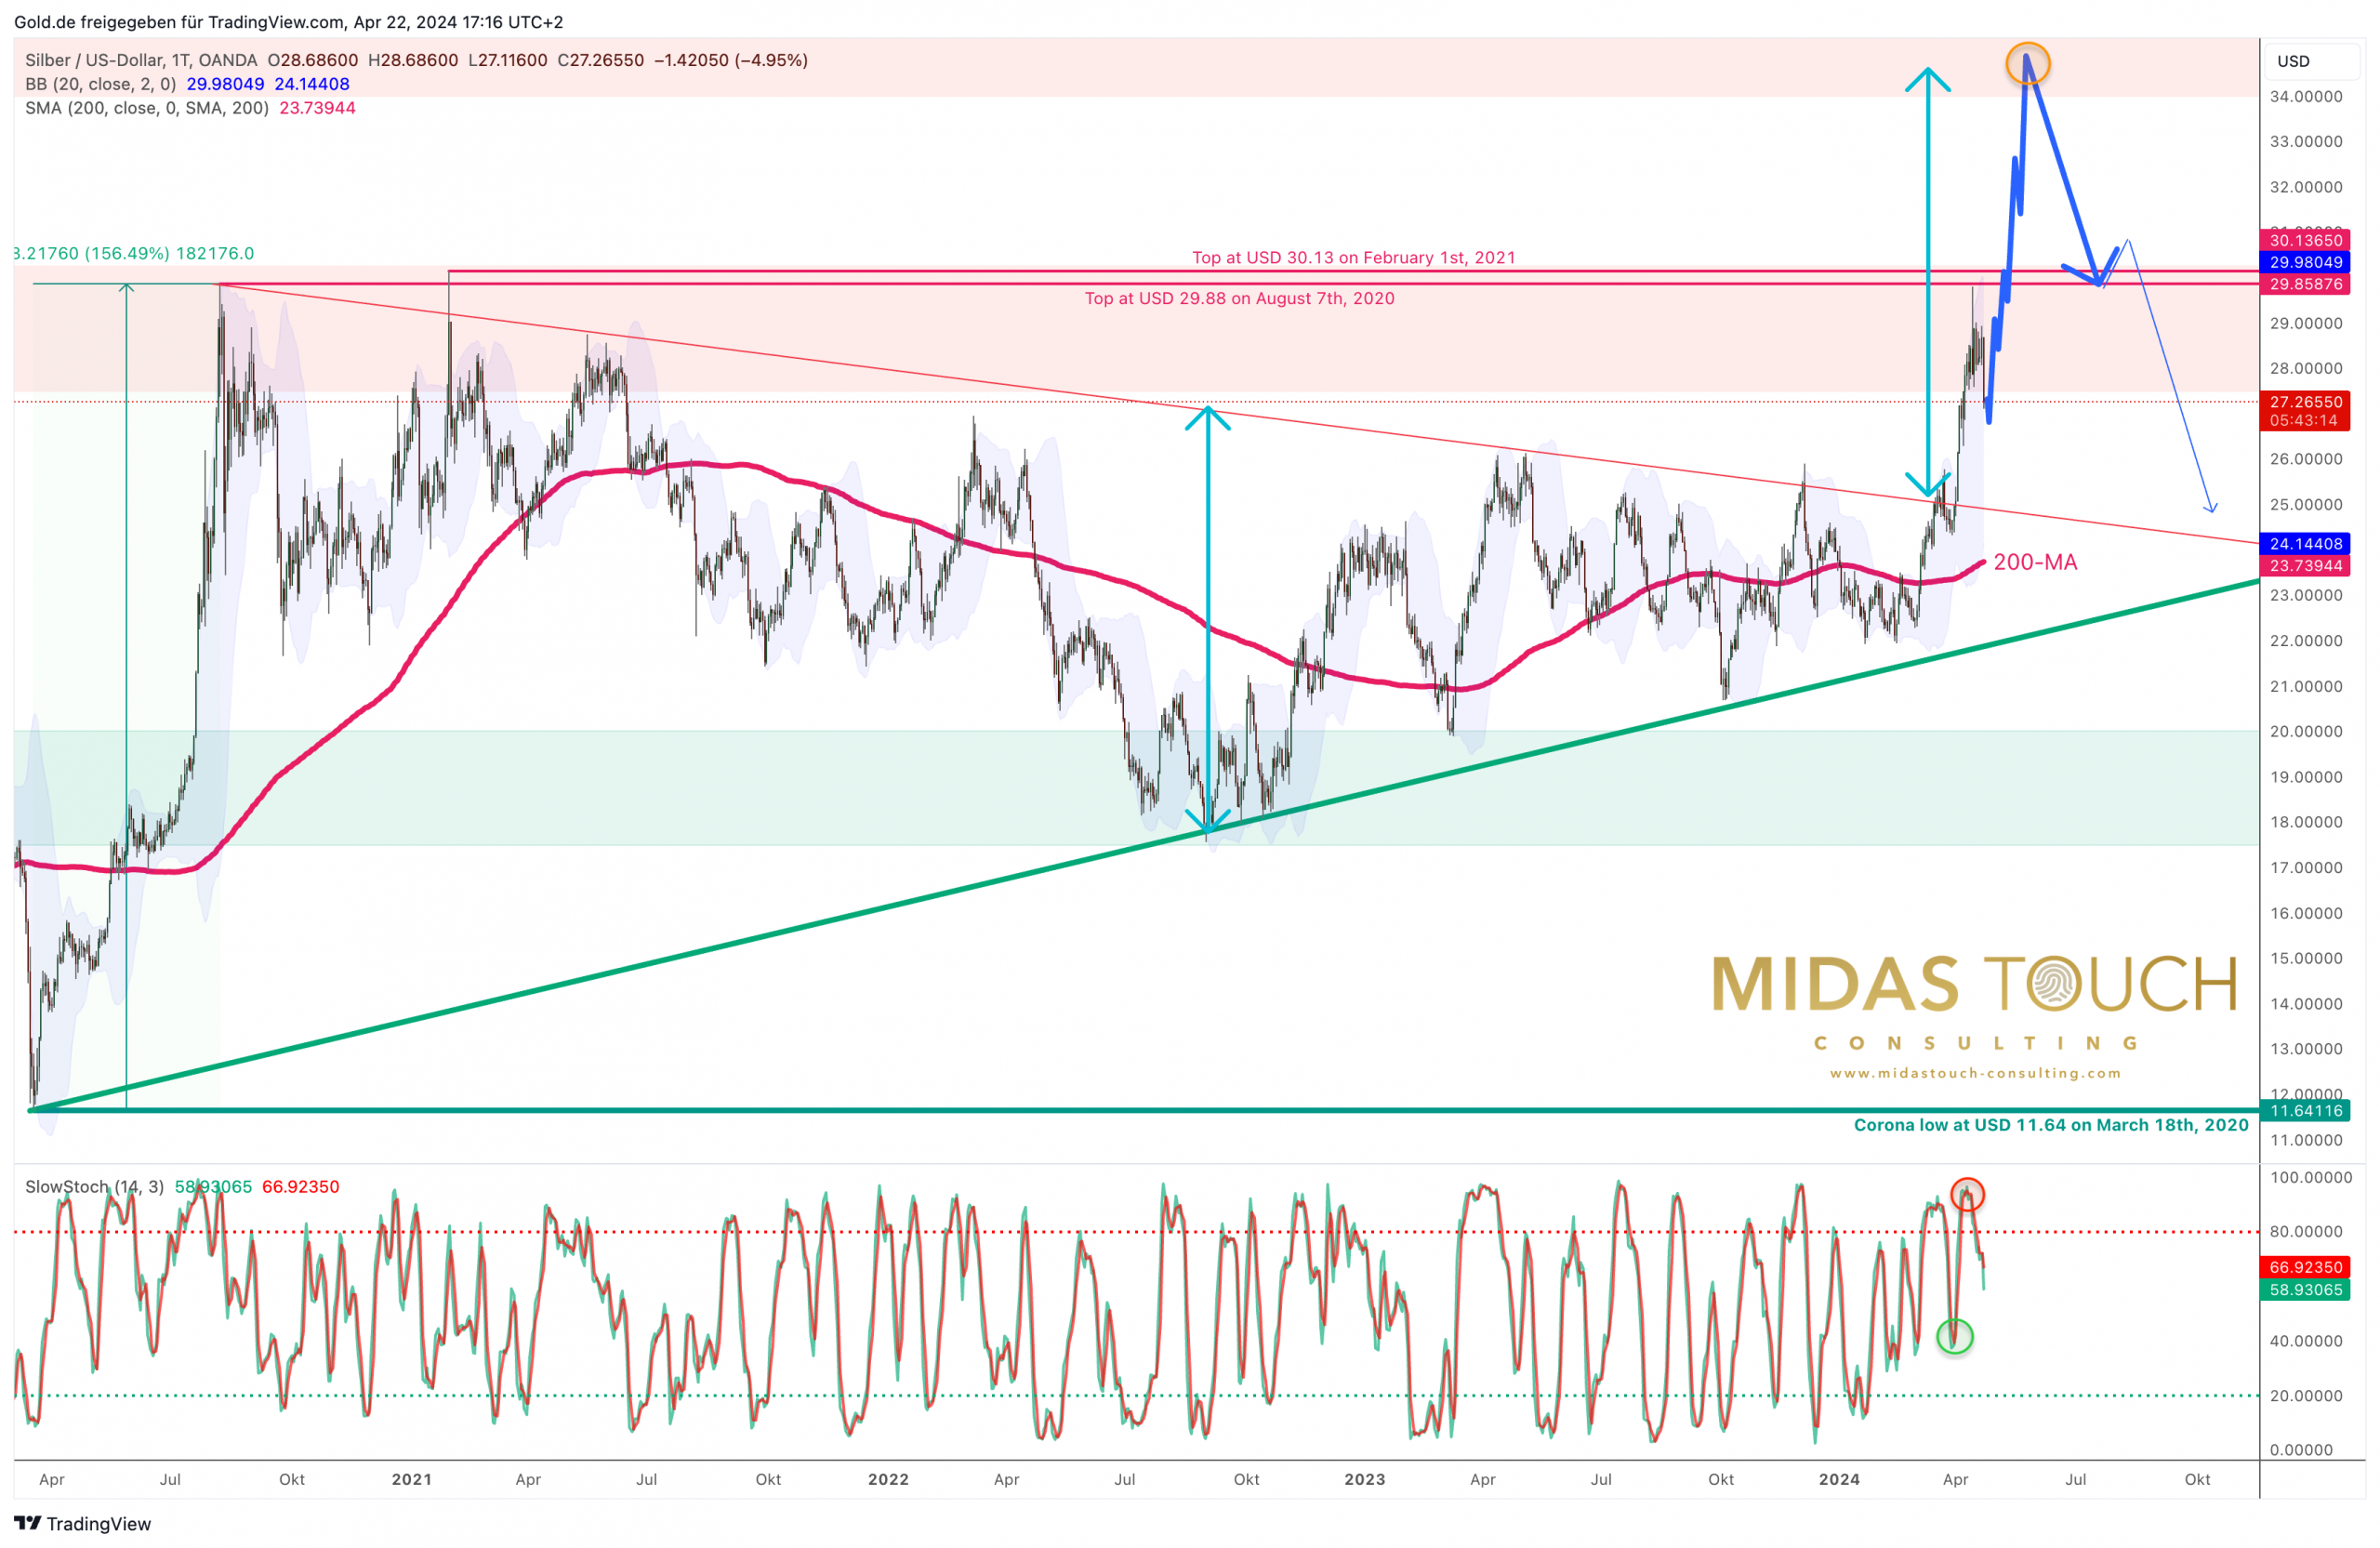
Silver in US-Dollar – Daily Chart

Silver in US-Dollar, daily chart as of April 22nd 2024. Source: Midas Touch Consulting
Four weeks ago, we were a bit too skeptical suspecting that silver might make a slight dip before breaking out upwards. However, this didn’t materialize. Instead, silver prices surged steeply from USD 24.32 over the past three and a half weeks. Thus, silver has clearly and unequivocally broken out of its 4-year triangle pattern.
If we apply the height of this triangle pattern to the breakout point around USD 25, we arrive at a price target of approximately USD 35. This target could indeed be achieved in a final exaggeration within just a few weeks. The month of May would be particularly suitable for a peak in precious metal prices, potentially leading to a sharp correction back to the USD 30 mark and lower by early summer.
Conclusion: Silver – Moving to the fast track.
The current rally in the precious metals sector has been ongoing since October 6th, 2023. Starting from USD 1,810, gold has surged by approximately USD 630 or 34.25% in the past six and a half months. In the silver market, the uptrend began with a low of USD 20.69, resulting in prices increasing by nearly 44% at its peak so far.
We assume that the rally is now entering the home stretch, with a final bout of exaggeration expected in the coming weeks. We maintain our price target of USD 2,535 for gold which we communicated back in October 2023. For silver, we anticipate a final sprint towards around USD 35. The first two weeks of May are potentially ideal for the final peak.
Expect a roller coaster
Following this, a sharp and healthy pullback is expected, likely testing the breakout above USD 2,100 in the gold market. For the volatile silver price, this would ideally mean a pullback back to around USD 30, though more realistic levels might be slightly lower, around USD 25 to USD 27. In an extreme scenario, testing the apex of the former triangle as well as the 4-year uptrend could lead to silver prices pulling back towards around USD 23 to 24.50.
In summary, we anticipate a final surge and steep exaggeration in prices in the coming weeks, followed by a sharp and deep pullback. Afterwards, the bull market in precious metals should continue from late summer or autumn onwards.
Analysis initially published on April 19th, 2024, by www.gold.de. Translated into English and partially updated on April 22nd, 2024.
Feel free to join us in our free Telegram channel for daily real time data and a great community. If you like to get regular updates on our gold model, precious metals, commodities, bitcoin and cryptocurrencies, you can also subscribe to our free newsletter.
Disclosure: This article and the content are for informational purposes only and do not contain investment advice or recommendations. Every investment and trading move involves risk, and readers should conduct their own research when making a decision. The views, thoughts, and opinions expressed here are the author’s alone. They do not necessarily reflect or represent the views and opinions of Midas Touch Consulting.


