


Taking a breath before the next surge
From its November 2022 low to its recent high, Bitcoin is up 145% within 12 months. But of course, it wasn’t easy to ride this rally if you didn’t have a good entry or are a long-term hodler. Until the summer top, Bitcoins recovery was primarily driven by three big weekly candles. If you were not invested, you missed those and were running behind the train. Only the most recent rally which started in mid of October made it a bit easier for trend-followers. However, Bitcoin is now consolidating this surge. Bitcoin – Taking a breath before the next surge.
Review
With a low at USD 24,920, the nine-and-a-half-week summer correction (-25%) for Bitcoin concluded on September 11th. Since then, the allure of all the to be approved Spot-ETFs has propelled Bitcoin prices gradually upwards, gaining momentum notably from mid-October. The pinnacle was reached at USD 37,978 on November 9th, surpassing our third target of USD 35,924 given back in January. However, over the past nine days, Bitcoin has become entrenched around the USD 38,000 resistance mark, with negative divergences intensifying on smaller timeframes.
Despite the overbought conditions, will a breakthrough towards our fourth target at USD 48,555 be achieved, or is a healthy yet larger retracement necessary following the robust rally in recent weeks?
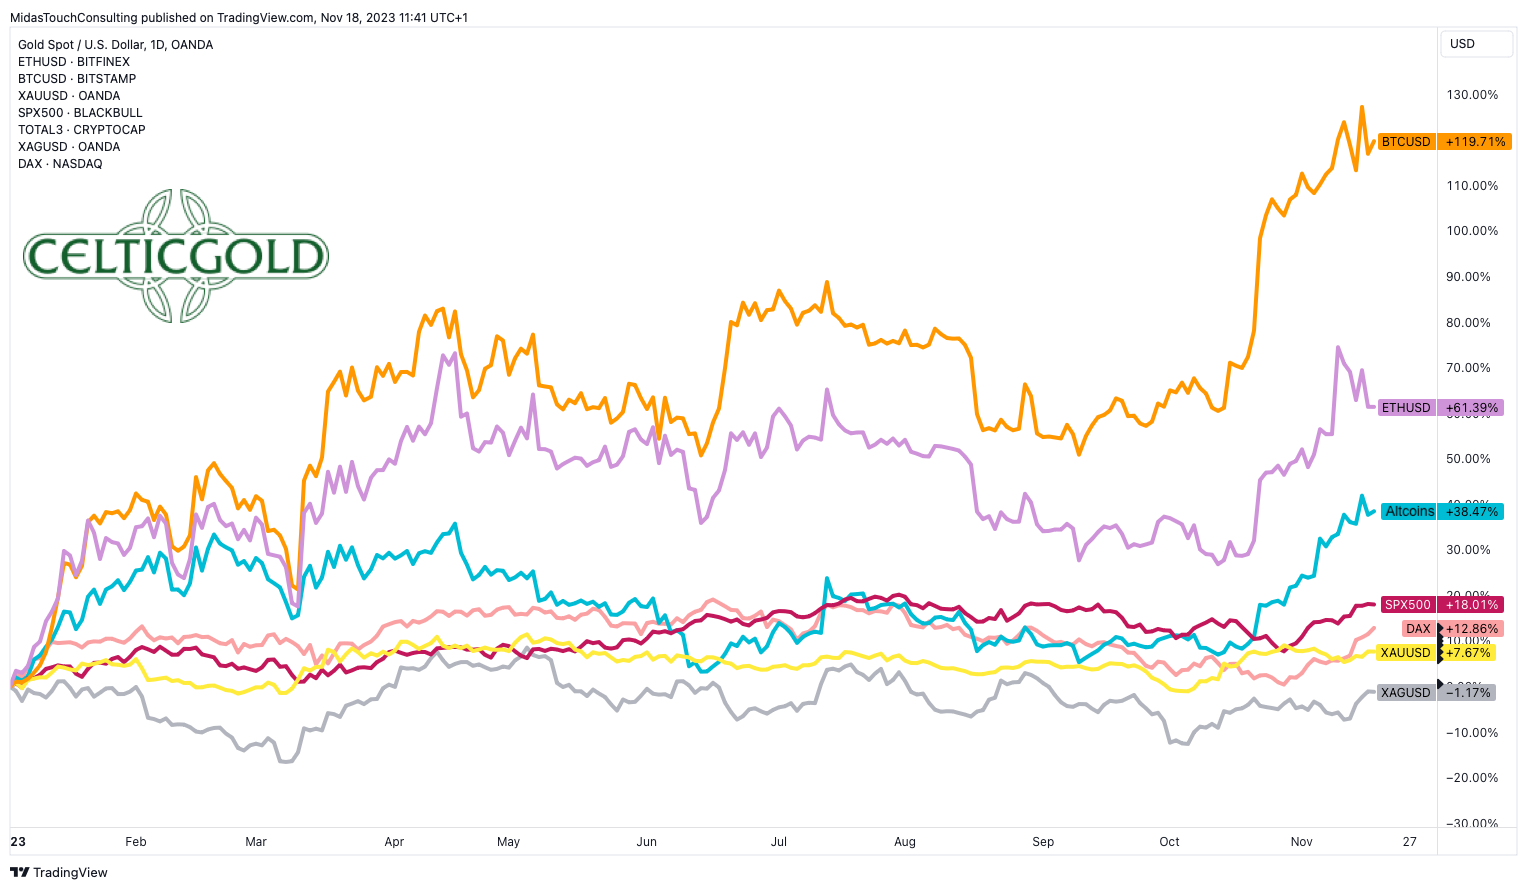
Performance in USD since the beginning of the year, as of November 18, 2023. Source: Tradingview
Regardless, Bitcoin remains significantly ahead on an annual basis, boasting a gain of 119.71%, making it by far the best performer. Ethereum has seen an increase of 61.39%, while the S&P500 and DAX lag far behind at 18% and 12.86%, respectively. Comparatively disappointing is the performance of precious metals. Although gold has posted a respectable gain of 7.67% since the start of the year, silver, in contrast, has slipped into negative territory at -1.17%.
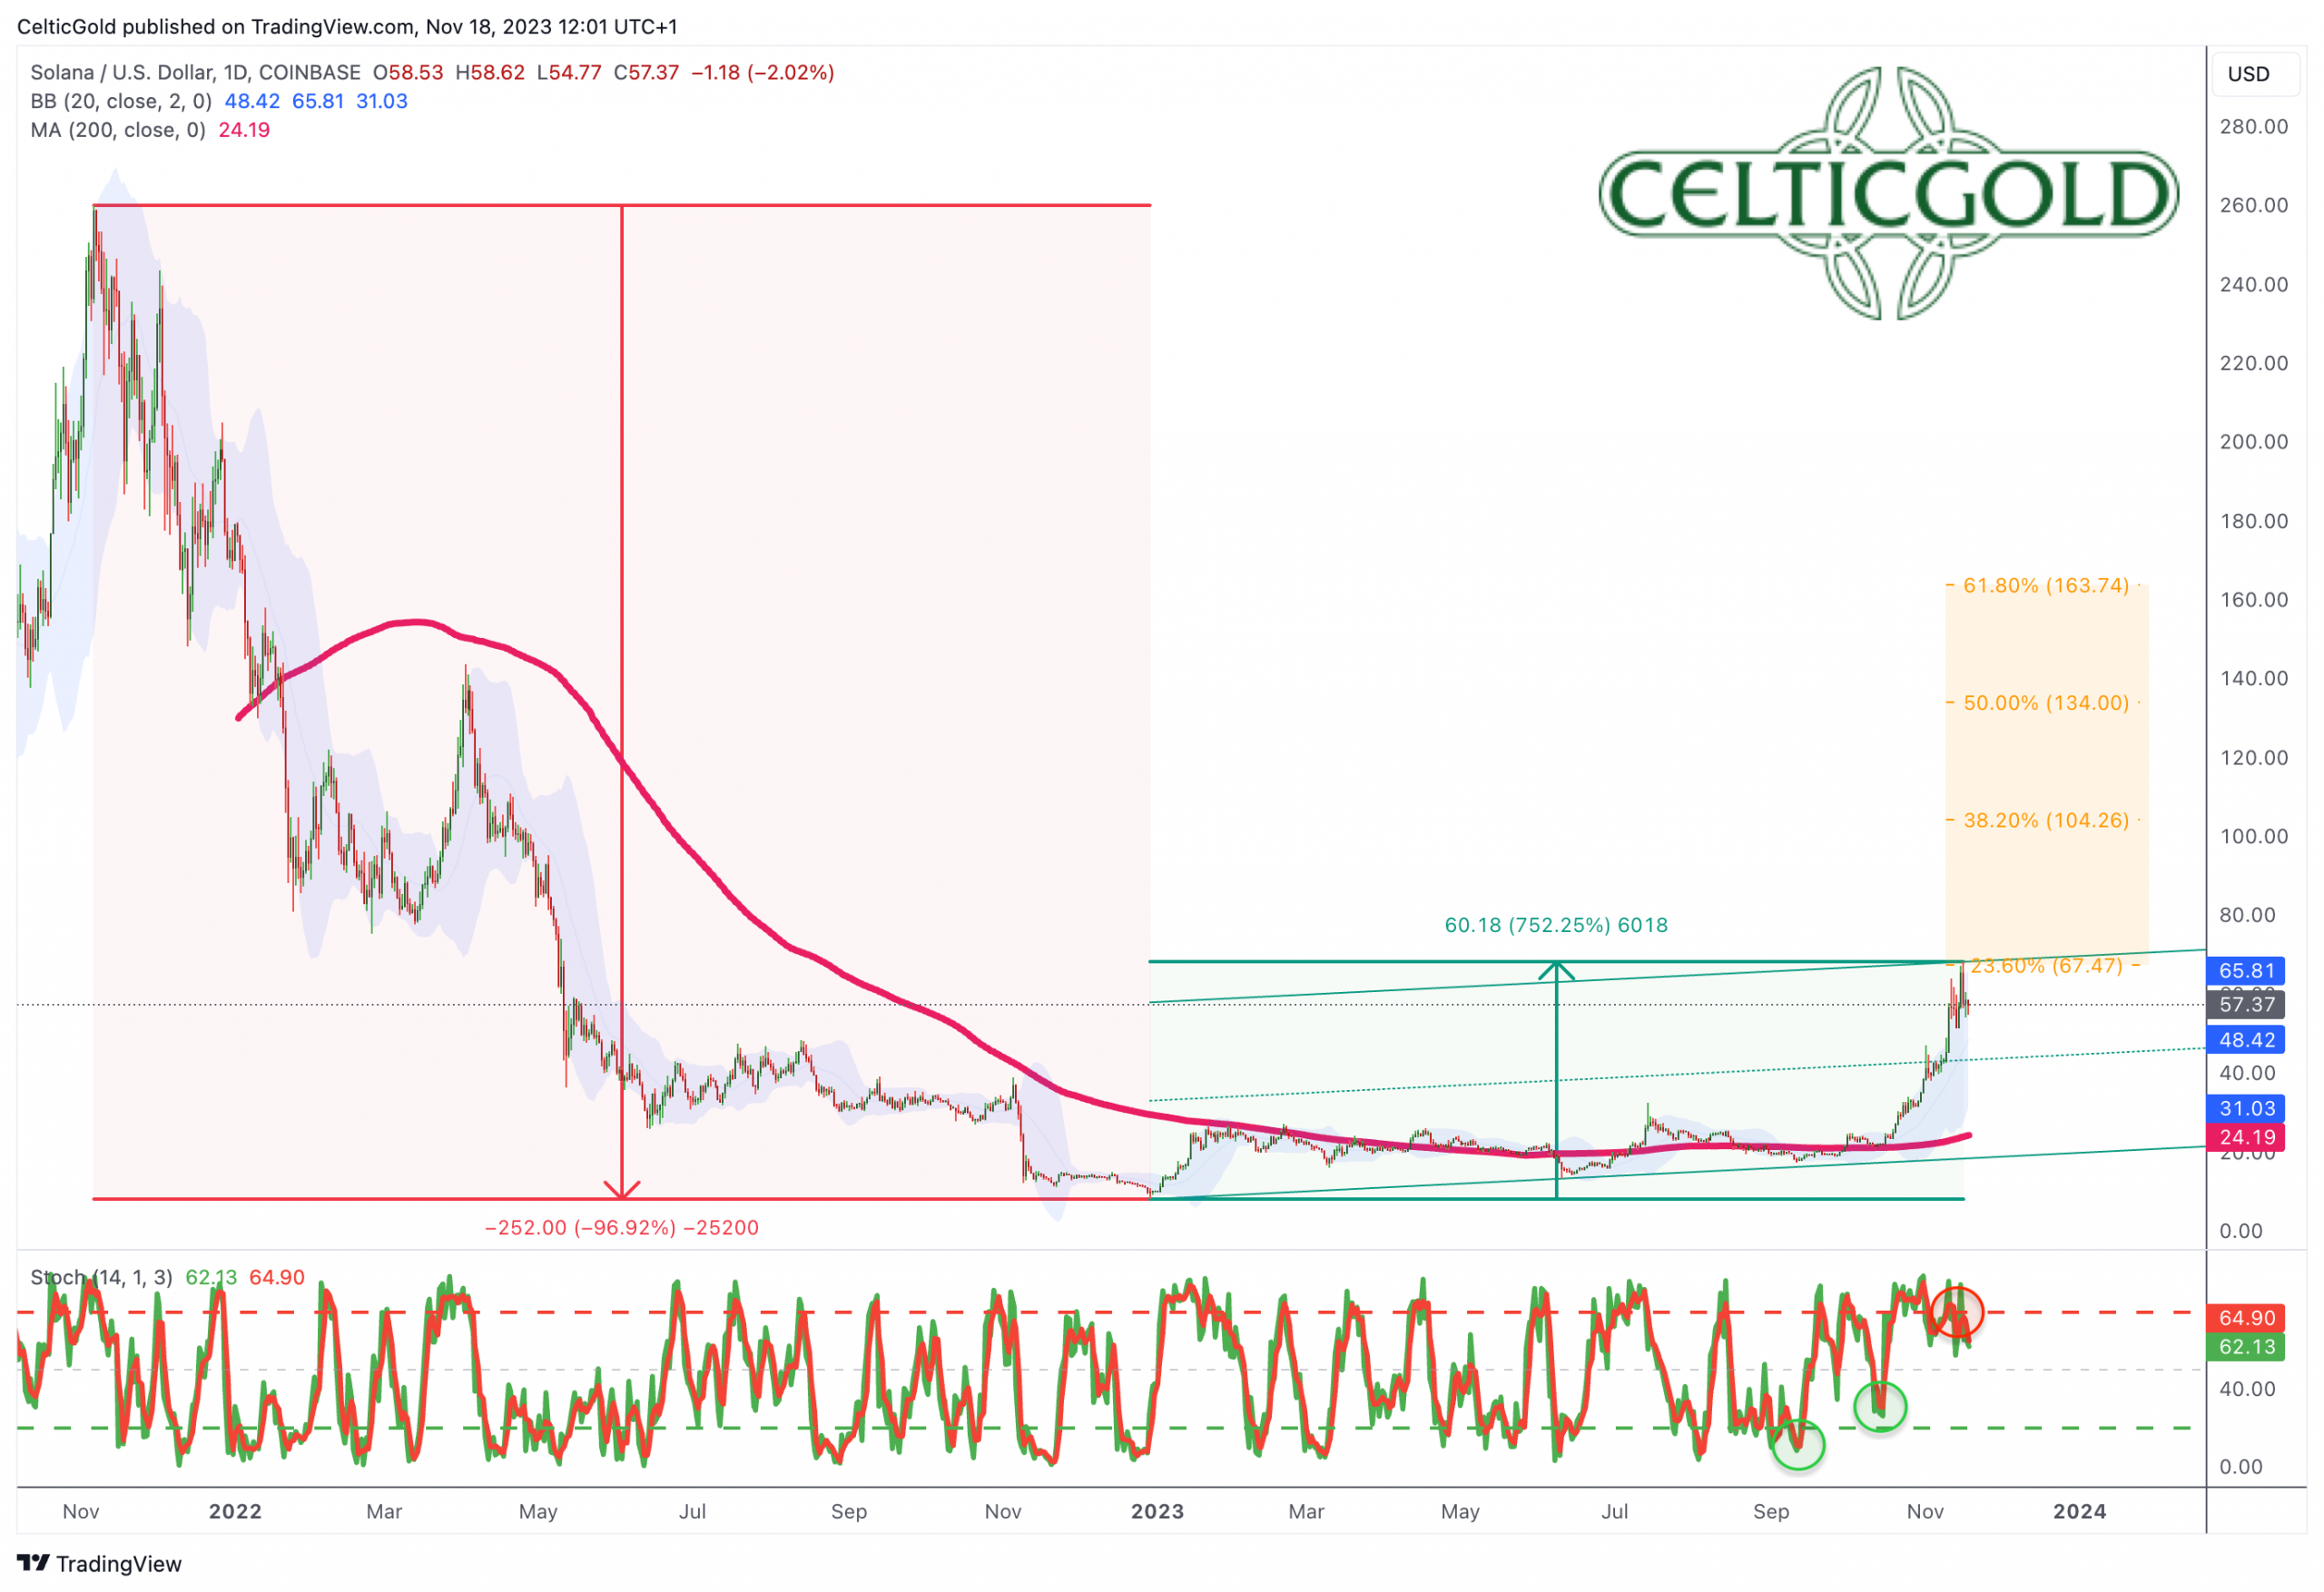
Solana in USD, weekly chart as of November 18th, 2023. Source: Tradingview
Solana is up 750% from its bear-market low
The surge in major altcoins like Solana (SOL-USD) over the past four weeks serves as an emancipating blow and a cautionary signal at the same time. What is needed, in addition to a potential ascent of Bitcoin to around USD 50,000, is a brief yet sharp price explosion in smaller altcoins. This would complete the list of ingredients for a significant interim top in the sector.
Following the FTX debacle, Solana underwent an extended and arduous phase of base formation. Since the final low on December 26th, 2023, at USD 8, the coin has experienced a spectacular recovery of over 750%, reaching USD 68. However, a Delaware bankruptcy court has approved the sale of assets from the bankrupt FTX exchange to compensate creditors, including 55.75 million SOL, which are poised to be thrown at the market, at least to some extent.
Overall, the recovery in Bitcoin and altcoins, along with the stock markets, is likely to persist until the end of the year. However, we suspect that the dynamics will be reshuffled in the early weeks of January, presenting investors in these sectors with a challenging 2024.
Technical Analysis for Bitcoin in US-Dollar
Bitcoin Weekly Chart – At the 38.2% Retracement of the Bear Market
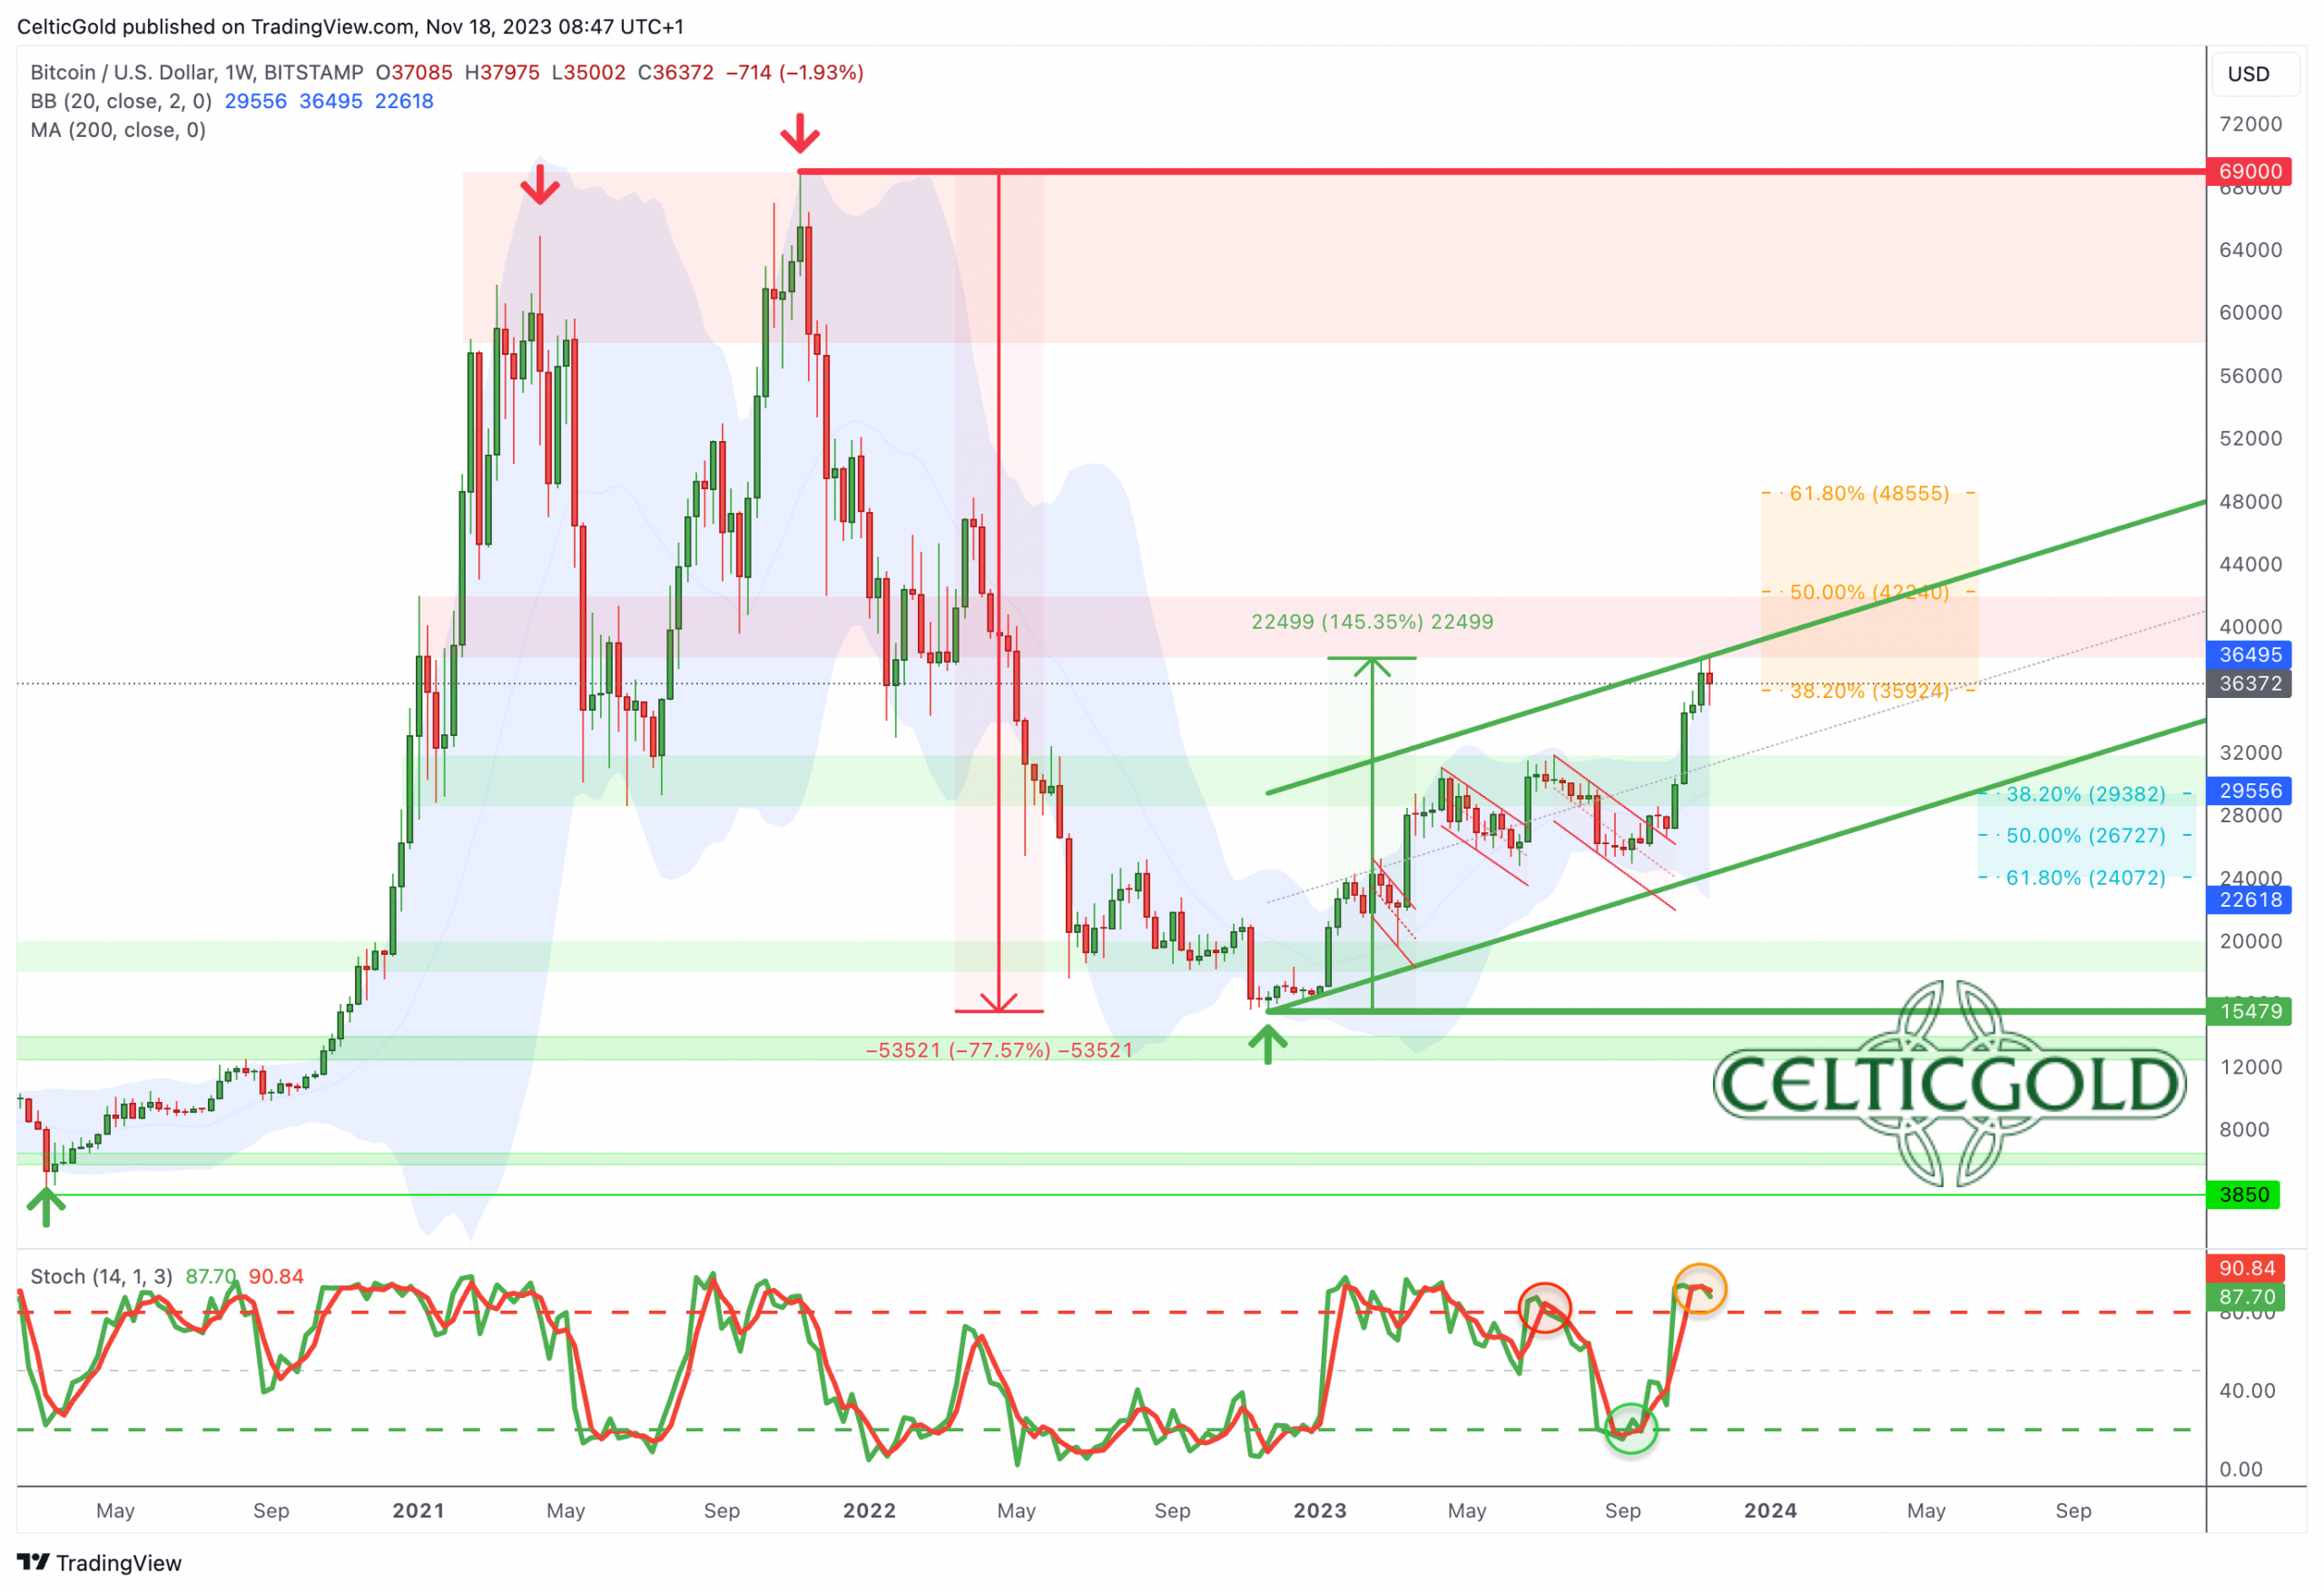
Bitcoin in USD, weekly chart as of November 18th, 2023. Source: Tradingview
Over the past 12 months, Bitcoin has significantly rebounded from its nosedive (-77.57%), recovering slightly more than 38.2% of the bear market. The classic 38.2% Fibonacci Retracement represents the minimum response to a preceding price movement. In other words, Bitcoin is alive, but there is still a considerable journey ahead until it reaches its all-time high at USD 69,000!
Since the low on November 21st, 2022, there has been an impressive recovery of around 145%. However, compared to previous recoveries, this one appears relatively modest. Nevertheless, when juxtaposed with stock markets and precious metals, Bitcoin’s recovery unmistakably outshines all other sectors, proving to be both clear and spectacular.
Next target approx. USD 48.500 to USD 50.000
The next plausible price target would be the 61.8% Fibonacci Retracement at USD 48,555. Given the overbought conditions on the weekly chart, a direct surge to that level would indeed be a formidable undertaking. Nevertheless, considering the current enthusiasm surrounding Bitcoin ETFs, a continuation of the rally, more or less directly, must be accorded a significantly elevated probability.
In summary, the weekly chart remains bullish as long as Bitcoin can defend its breakout above USD 31,800. A multi-week breather between approximately USD 35,000 and USD 38,000 could serve as a launching pad towards USD 48,000 to USD 50,000. However, an ascent beyond USD 50,000 in the next six to twelve months is deemed highly improbable. Instead, a more substantial correction wave, stemming from the 61.8% Retracement, could offer considerably more favorable entry points later in the course of 2024.
Daily Chart – Consolidation at Elevated Levels
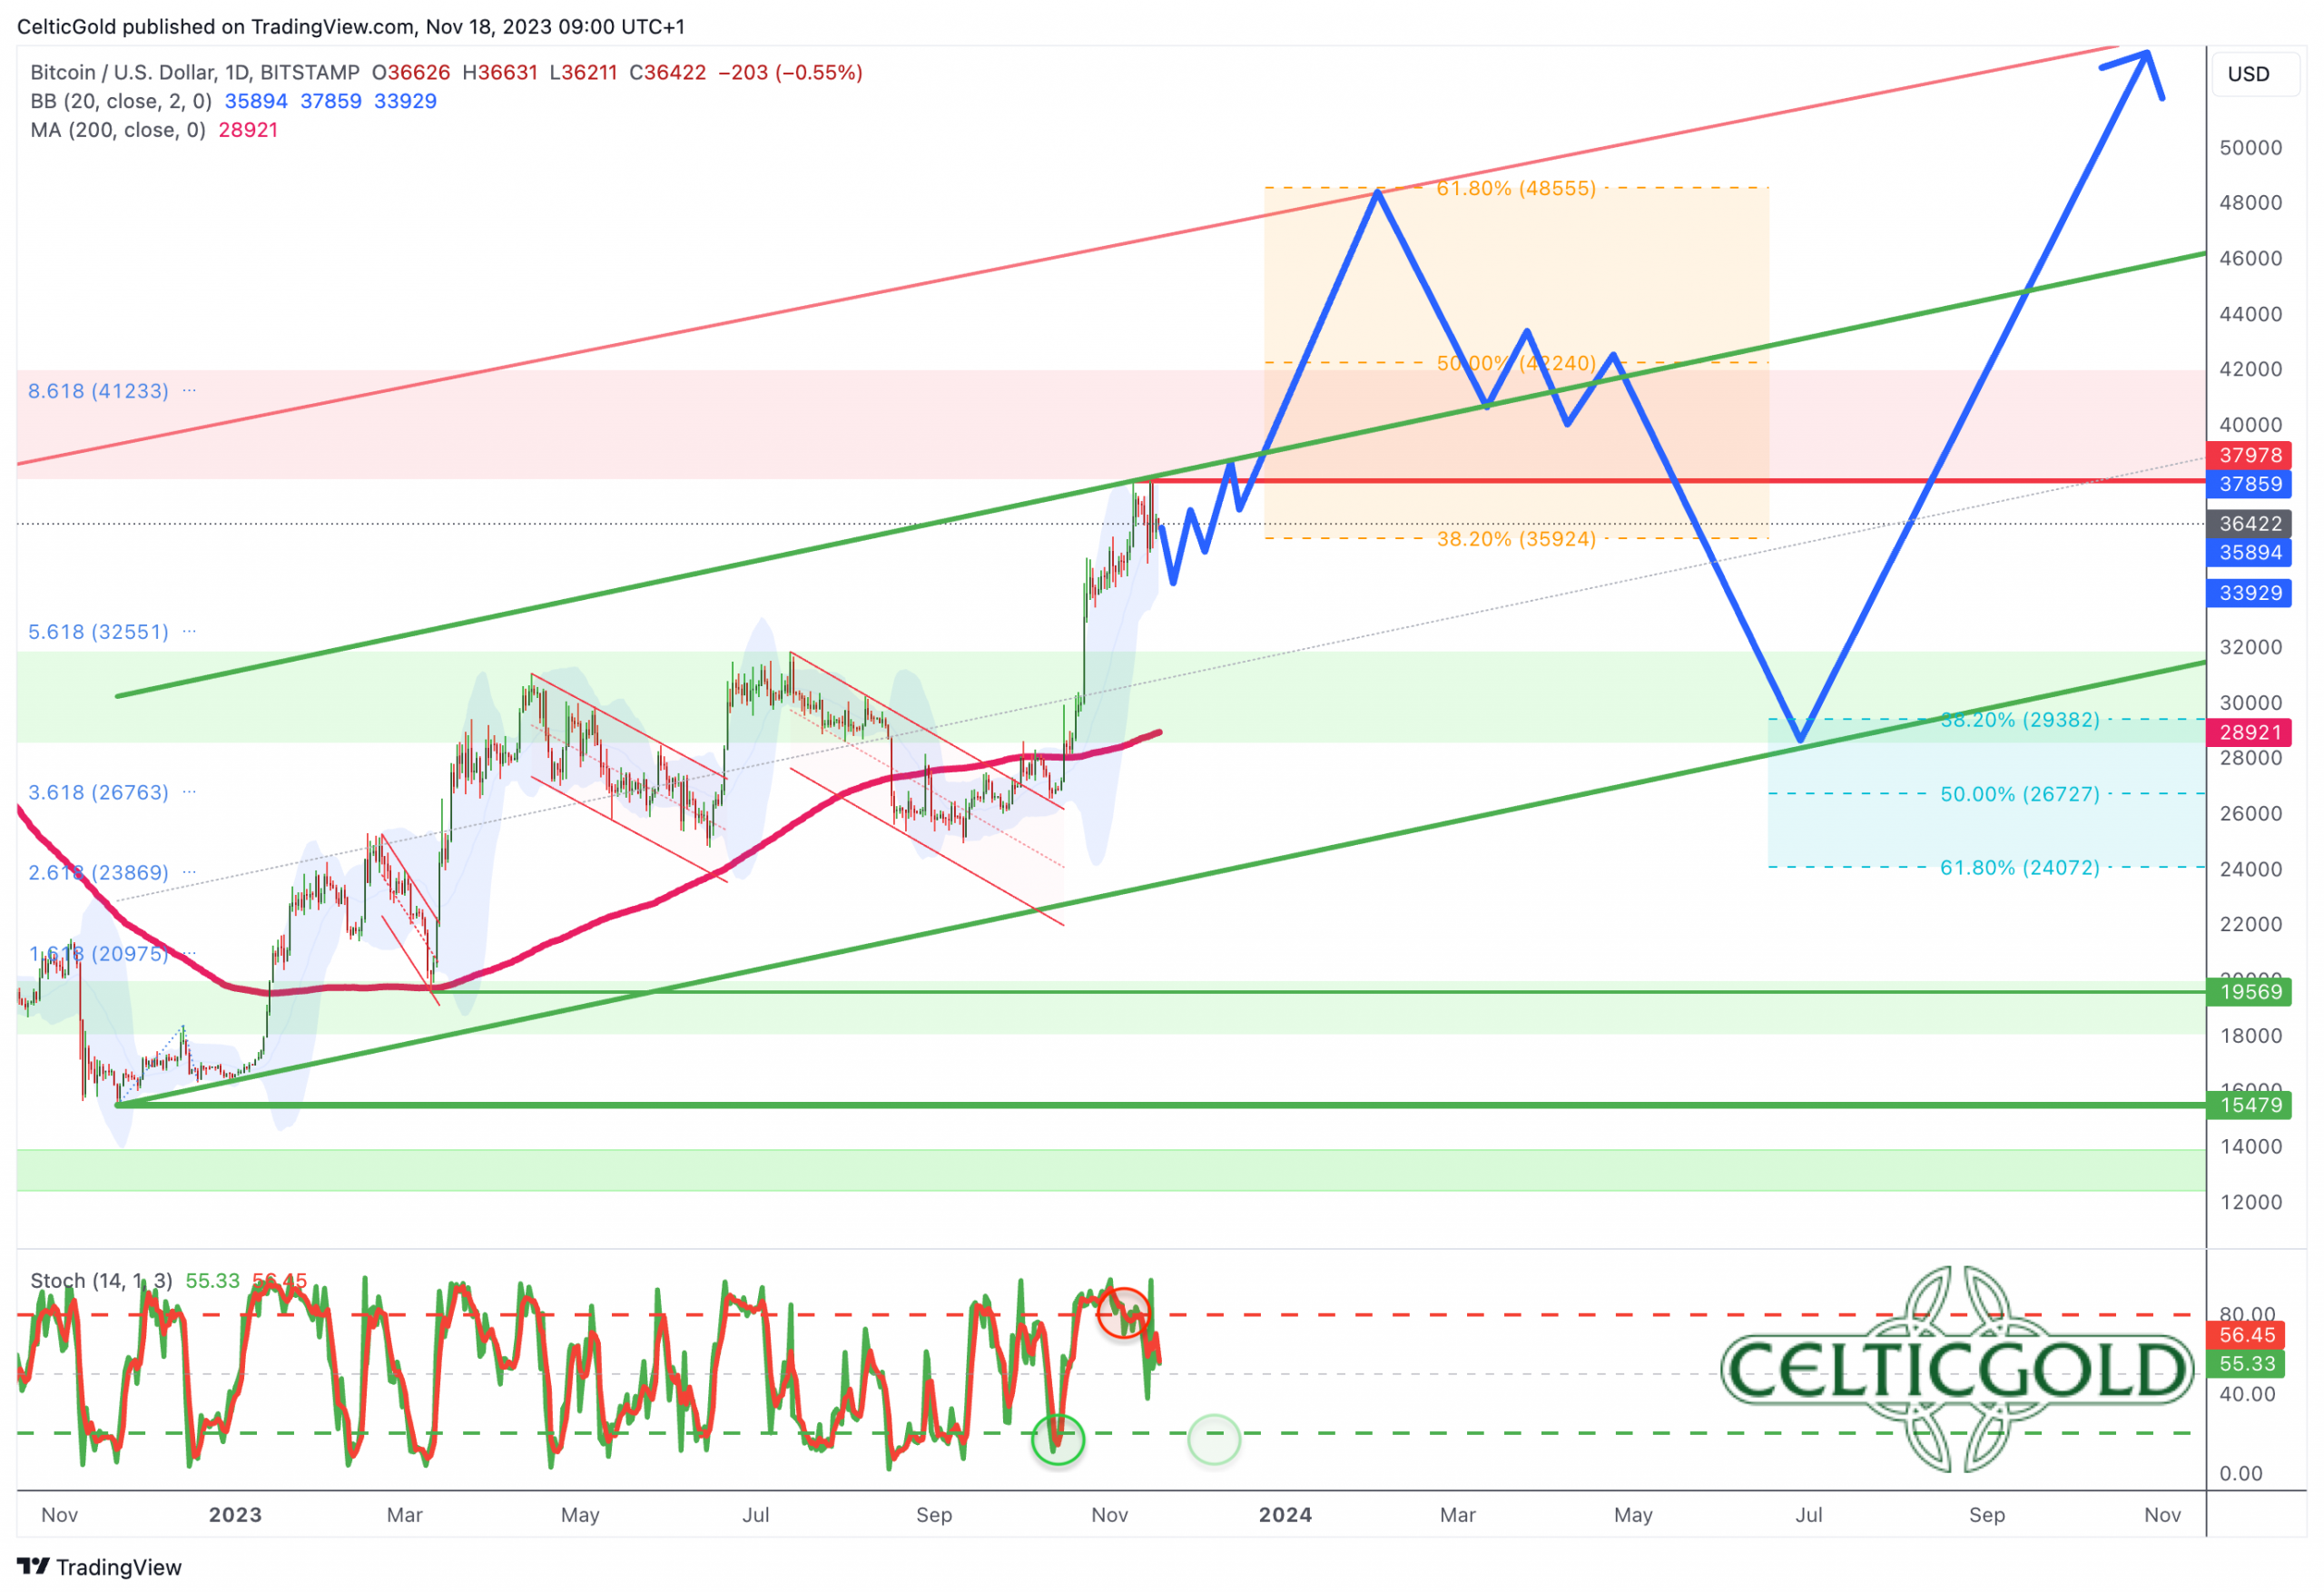
Bitcoin in USD, daily chart as of November 18th, 2023. Source: Tradingview
Regarding price, we were briefly too pessimistic in mid-September. However, we accurately anticipated the end of the summer correction by mid-October. Initiating from a final dip down to USD 26,500 on October 11th, the seasonally typical autumn rally swiftly propelled Bitcoin upwards by 43% within a few weeks.
For approximately the past 10 days, this impressive surge has been consolidating at elevated levels, with increasingly negative divergences appearing on smaller timeframes. The lower Bollinger Band (USD 33,929) must also catch up with the current price action. Hence, short-term consolidation between USD 35,000 and USD 38,000 is the most probable scenario.
While Bitcoin consolidates at a high level, the daily chart remains neutral. A pullback towards USD 35,000 and slightly lower should be anticipated. This would provide an opportunity for the bulls to regroup, potentially setting the stage for a resumption of the rally in December.
Sentiment Bitcoin – Sentiment is slightly fearful.
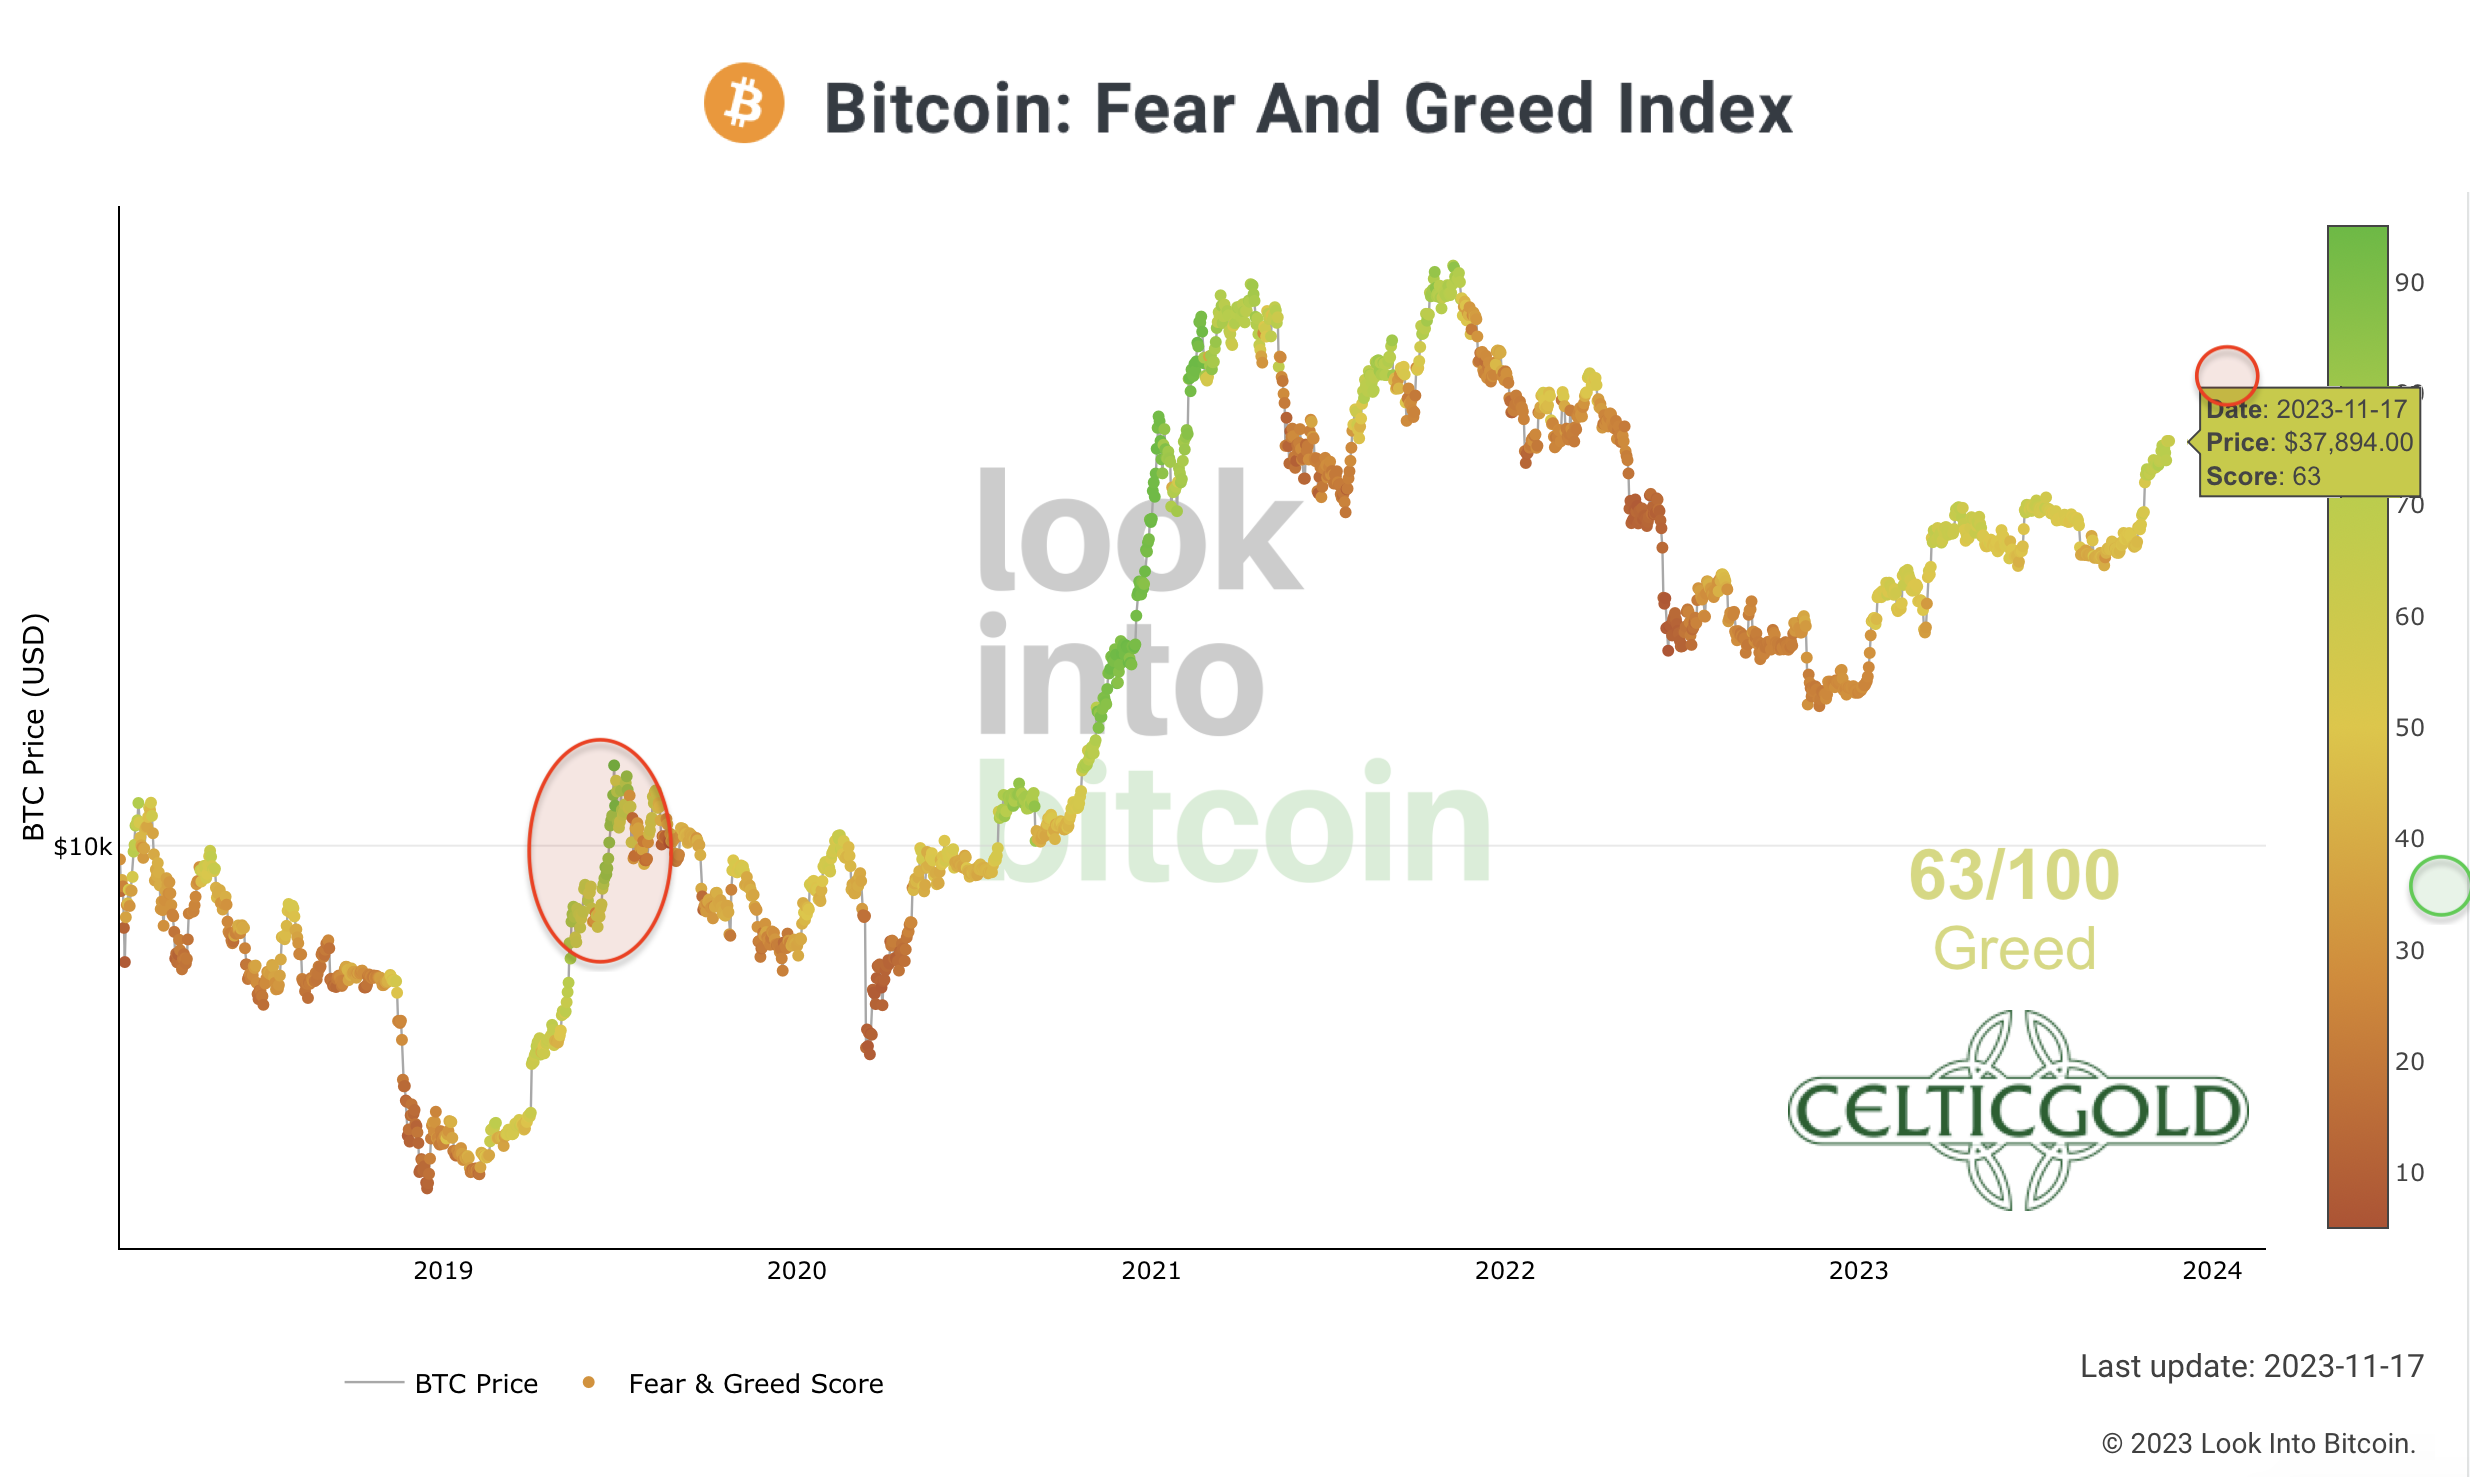
Crypto Fear & Greed Index long term, as of November 17th, 2023. Source: Lookintobitcoin
The “Crypto Fear & Greed Index” currently stands at 63 out of 100 points, reflecting an elevated level of optimism within the cryptocurrency sector.
Typically, the vigor of the initial recovery wave after a bear market is insufficient to ignite total euphoria and greed in the crypto sector. The year 2019 serves as a clear illustration of this. Following a steep recovery to the 61.8% retracement level at USD 13,800, the bulls ran out of steam. Despite the impressive rally in the summer of 2019, extreme optimism levels were not attained. Subsequently, a substantial pullback ensued, culminating in a double bottom at USD 3,800 during the March 2020 COVID-19 crash.
Overall, the sentiment appears somewhat excessively optimistic, yet there is room for further ascent towards absolute greed.
Seasonality Bitcoin – Favorable seasonality until early January
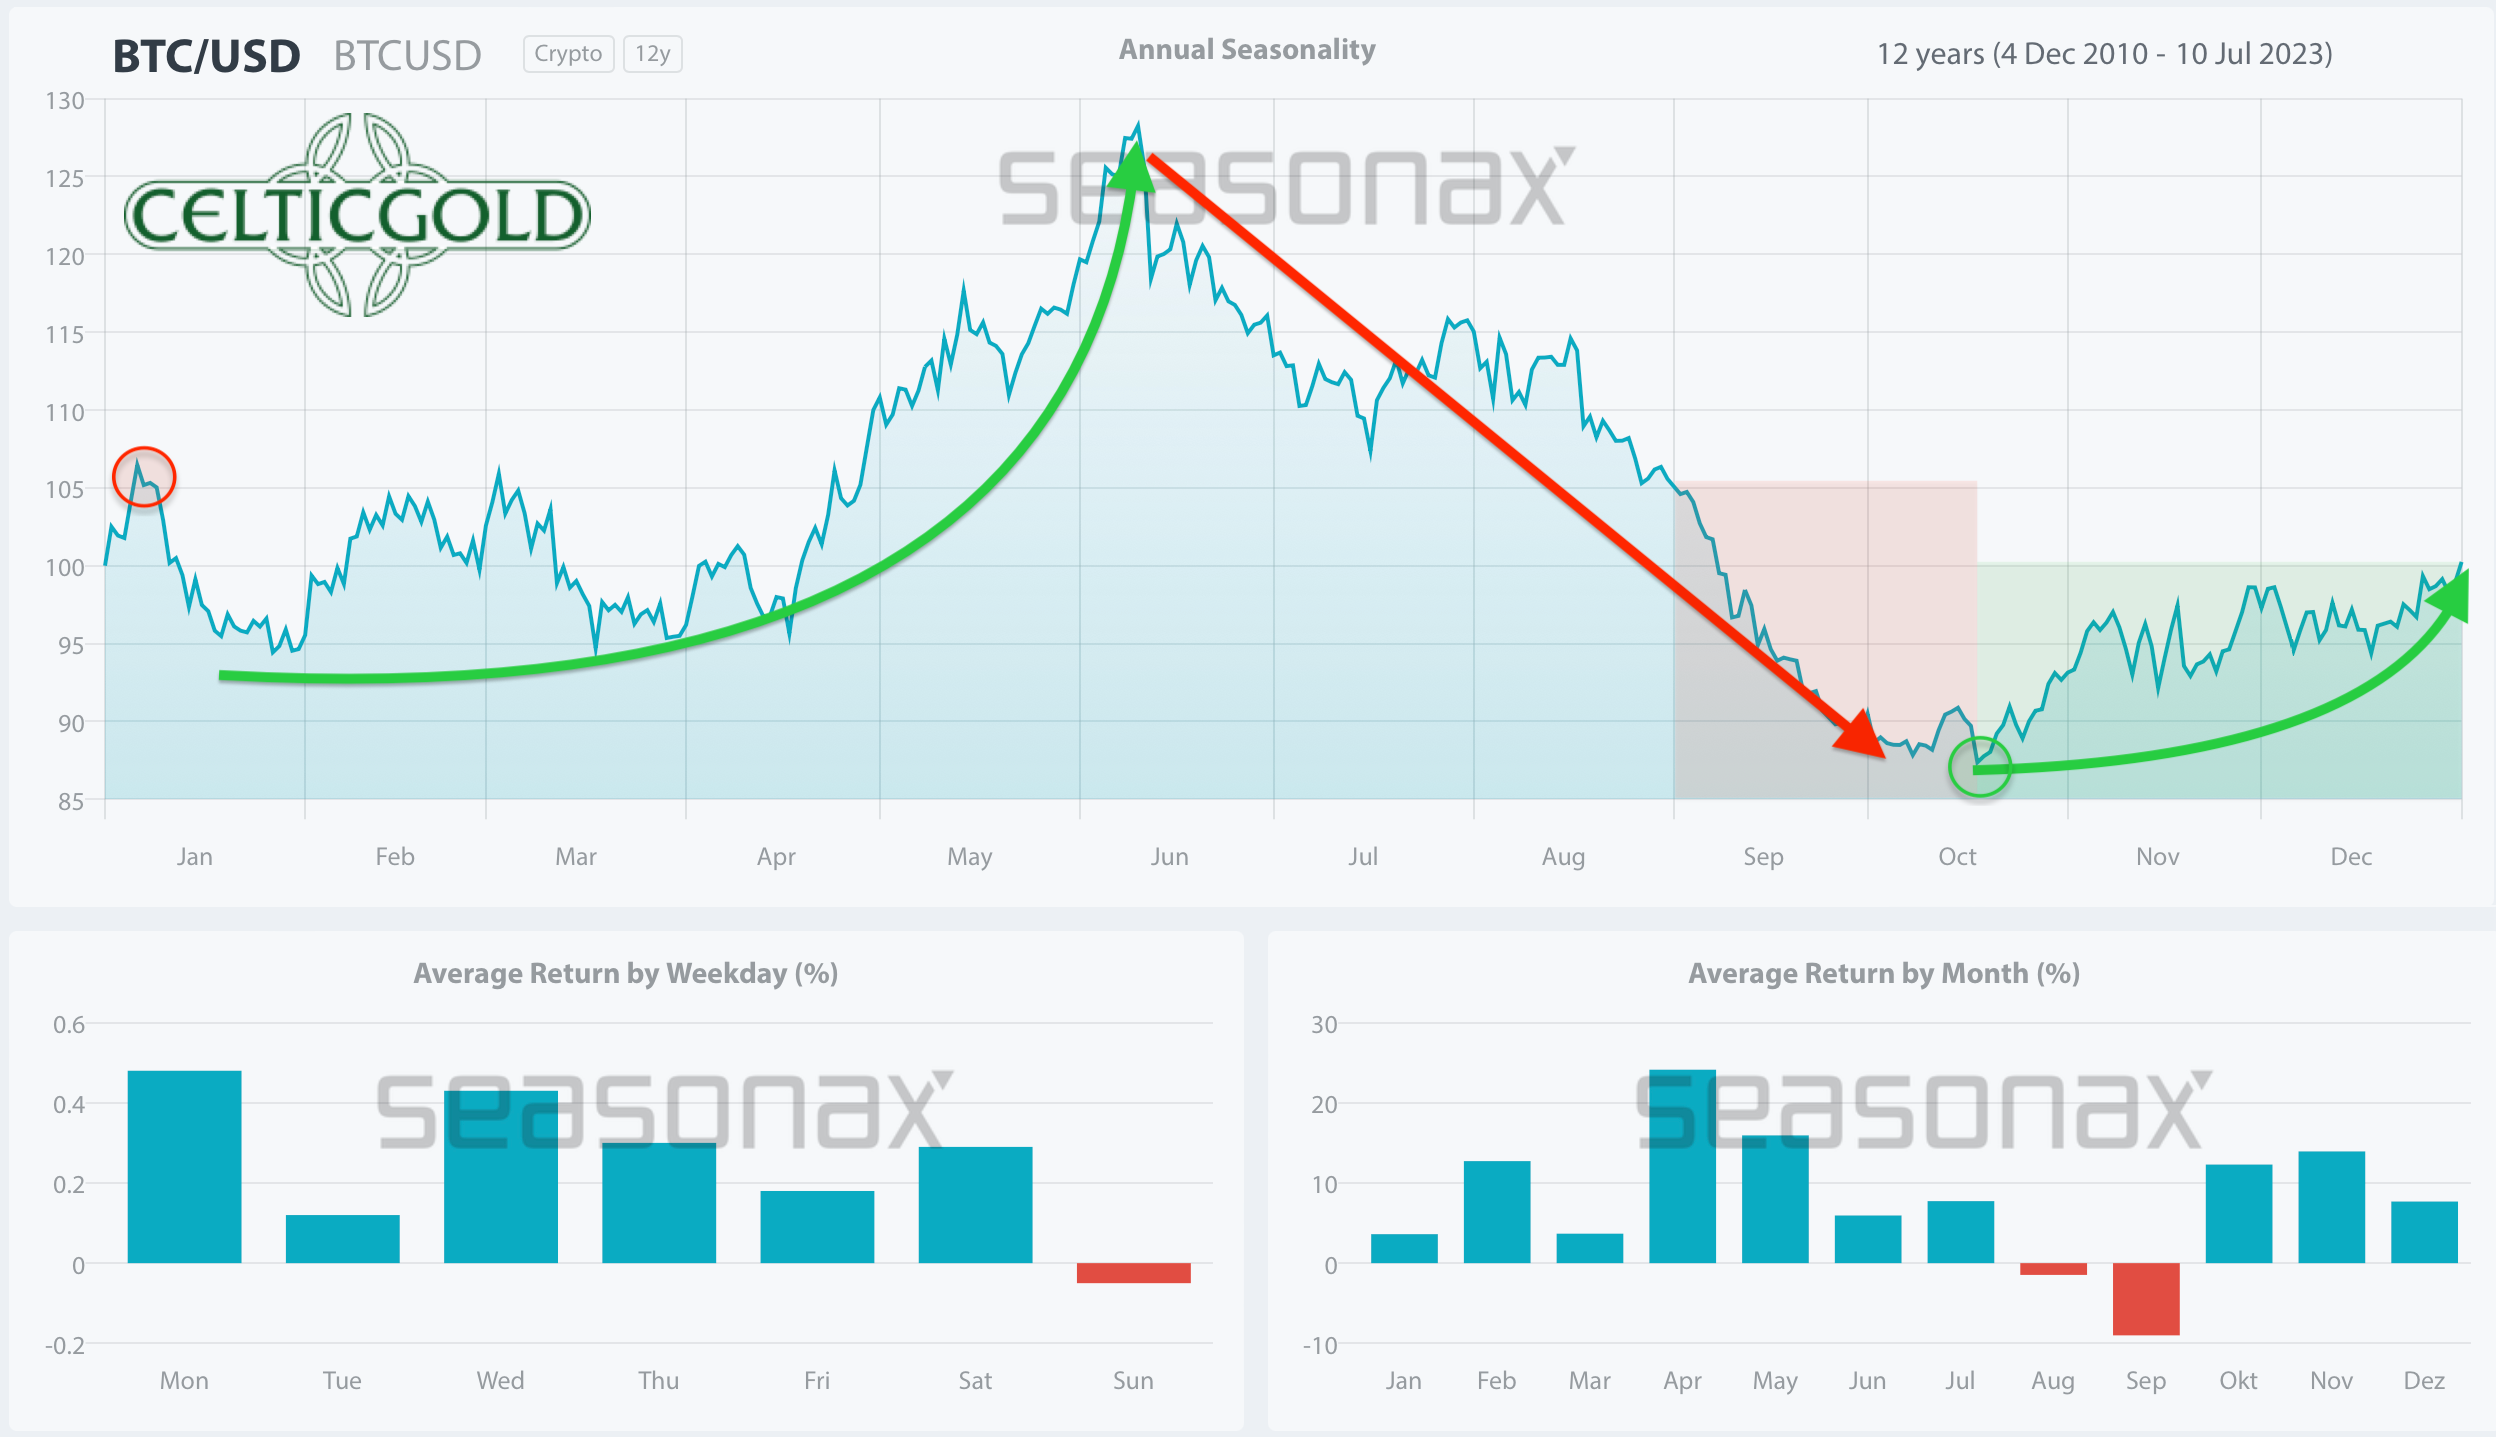
Seasonality for Bitcoin, as of November 17th, 2023. Source: Seasonax
As anticipated, Bitcoin indeed found a significant low between mid-September and mid-October, experiencing a robust uptrend since then. Seasonality remains bullish until early January, thereby supporting the envisaged rally to the 61.8% retracement level or around USD 48,000 to USD 50,000. Subsequently, and statistically speaking, a multi-month period of consolidation or correction is expected towards spring 2024.
In summary, seasonality remains bullish until early January.
Sound Money: Bitcoin vs. Gold
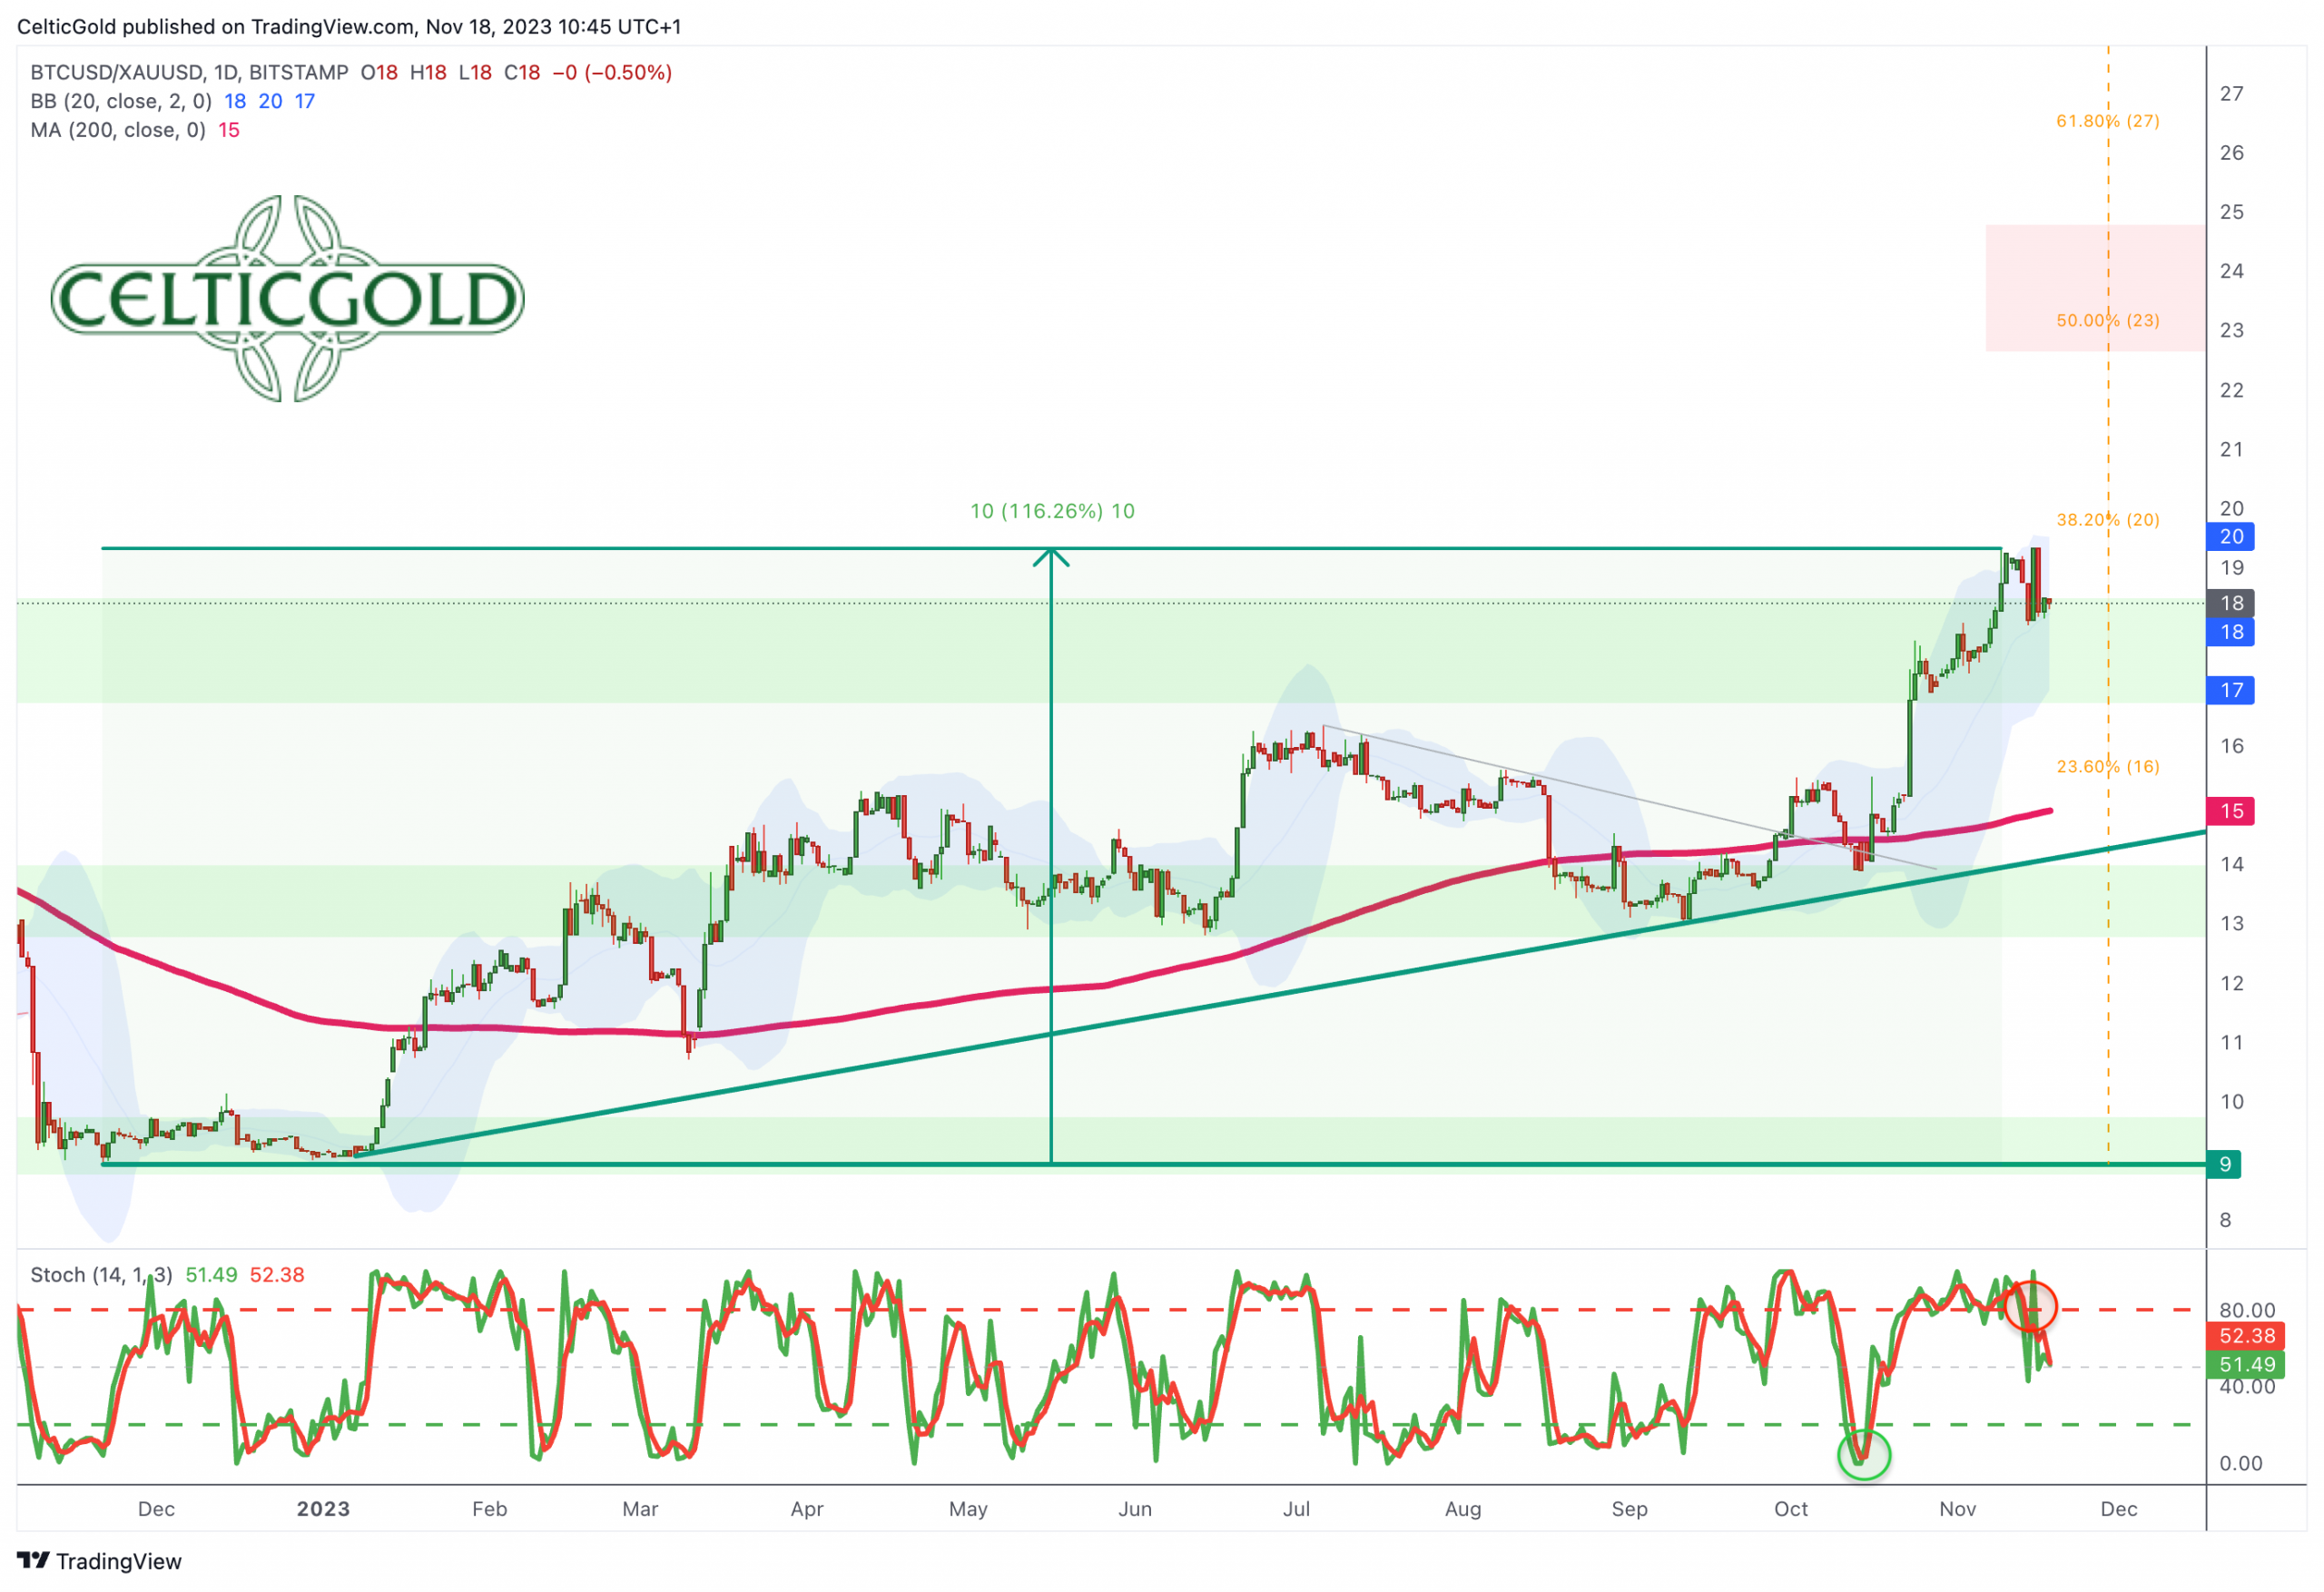
Bitcoin/Gold-Ratio, weekly chart as of September 3rd, 2023. Source: Tradingview
Over the past twelve months, Bitcoin has notably outperformed the price of gold by a substantial margin, achieving a remarkable 116% gain. With Bitcoin trading at approximately USD 36,400 per unit and gold at USD 1,980 per ounce, the current exchange rate requires an expenditure of about 18.34 ounces of gold for a single Bitcoin. Conversely, this implies that one ounce of gold is currently valued at approximately 0.054 Bitcoin. In aggregate, since the beginning of the year, Bitcoin has unquestionably proven to be the swifter contender with a surge of +119.71%, surpassing the performance of gold (+7.67%) by a factor of 15.6.
With the current value standing at 18.3, the Bitcoin/Gold ratio has nearly breached the resistance zone between 17 and 18. However, the 38.2% retracement at 20 has not been reached yet. We anticipate that this achievement is merely a matter of time. In the subsequent phase, an ascent to around 23 would be anticipated. This level encompasses both the 50% retracement and the subsequent resistance zone.
Macro Update – A severe and global recession is foreseeable.
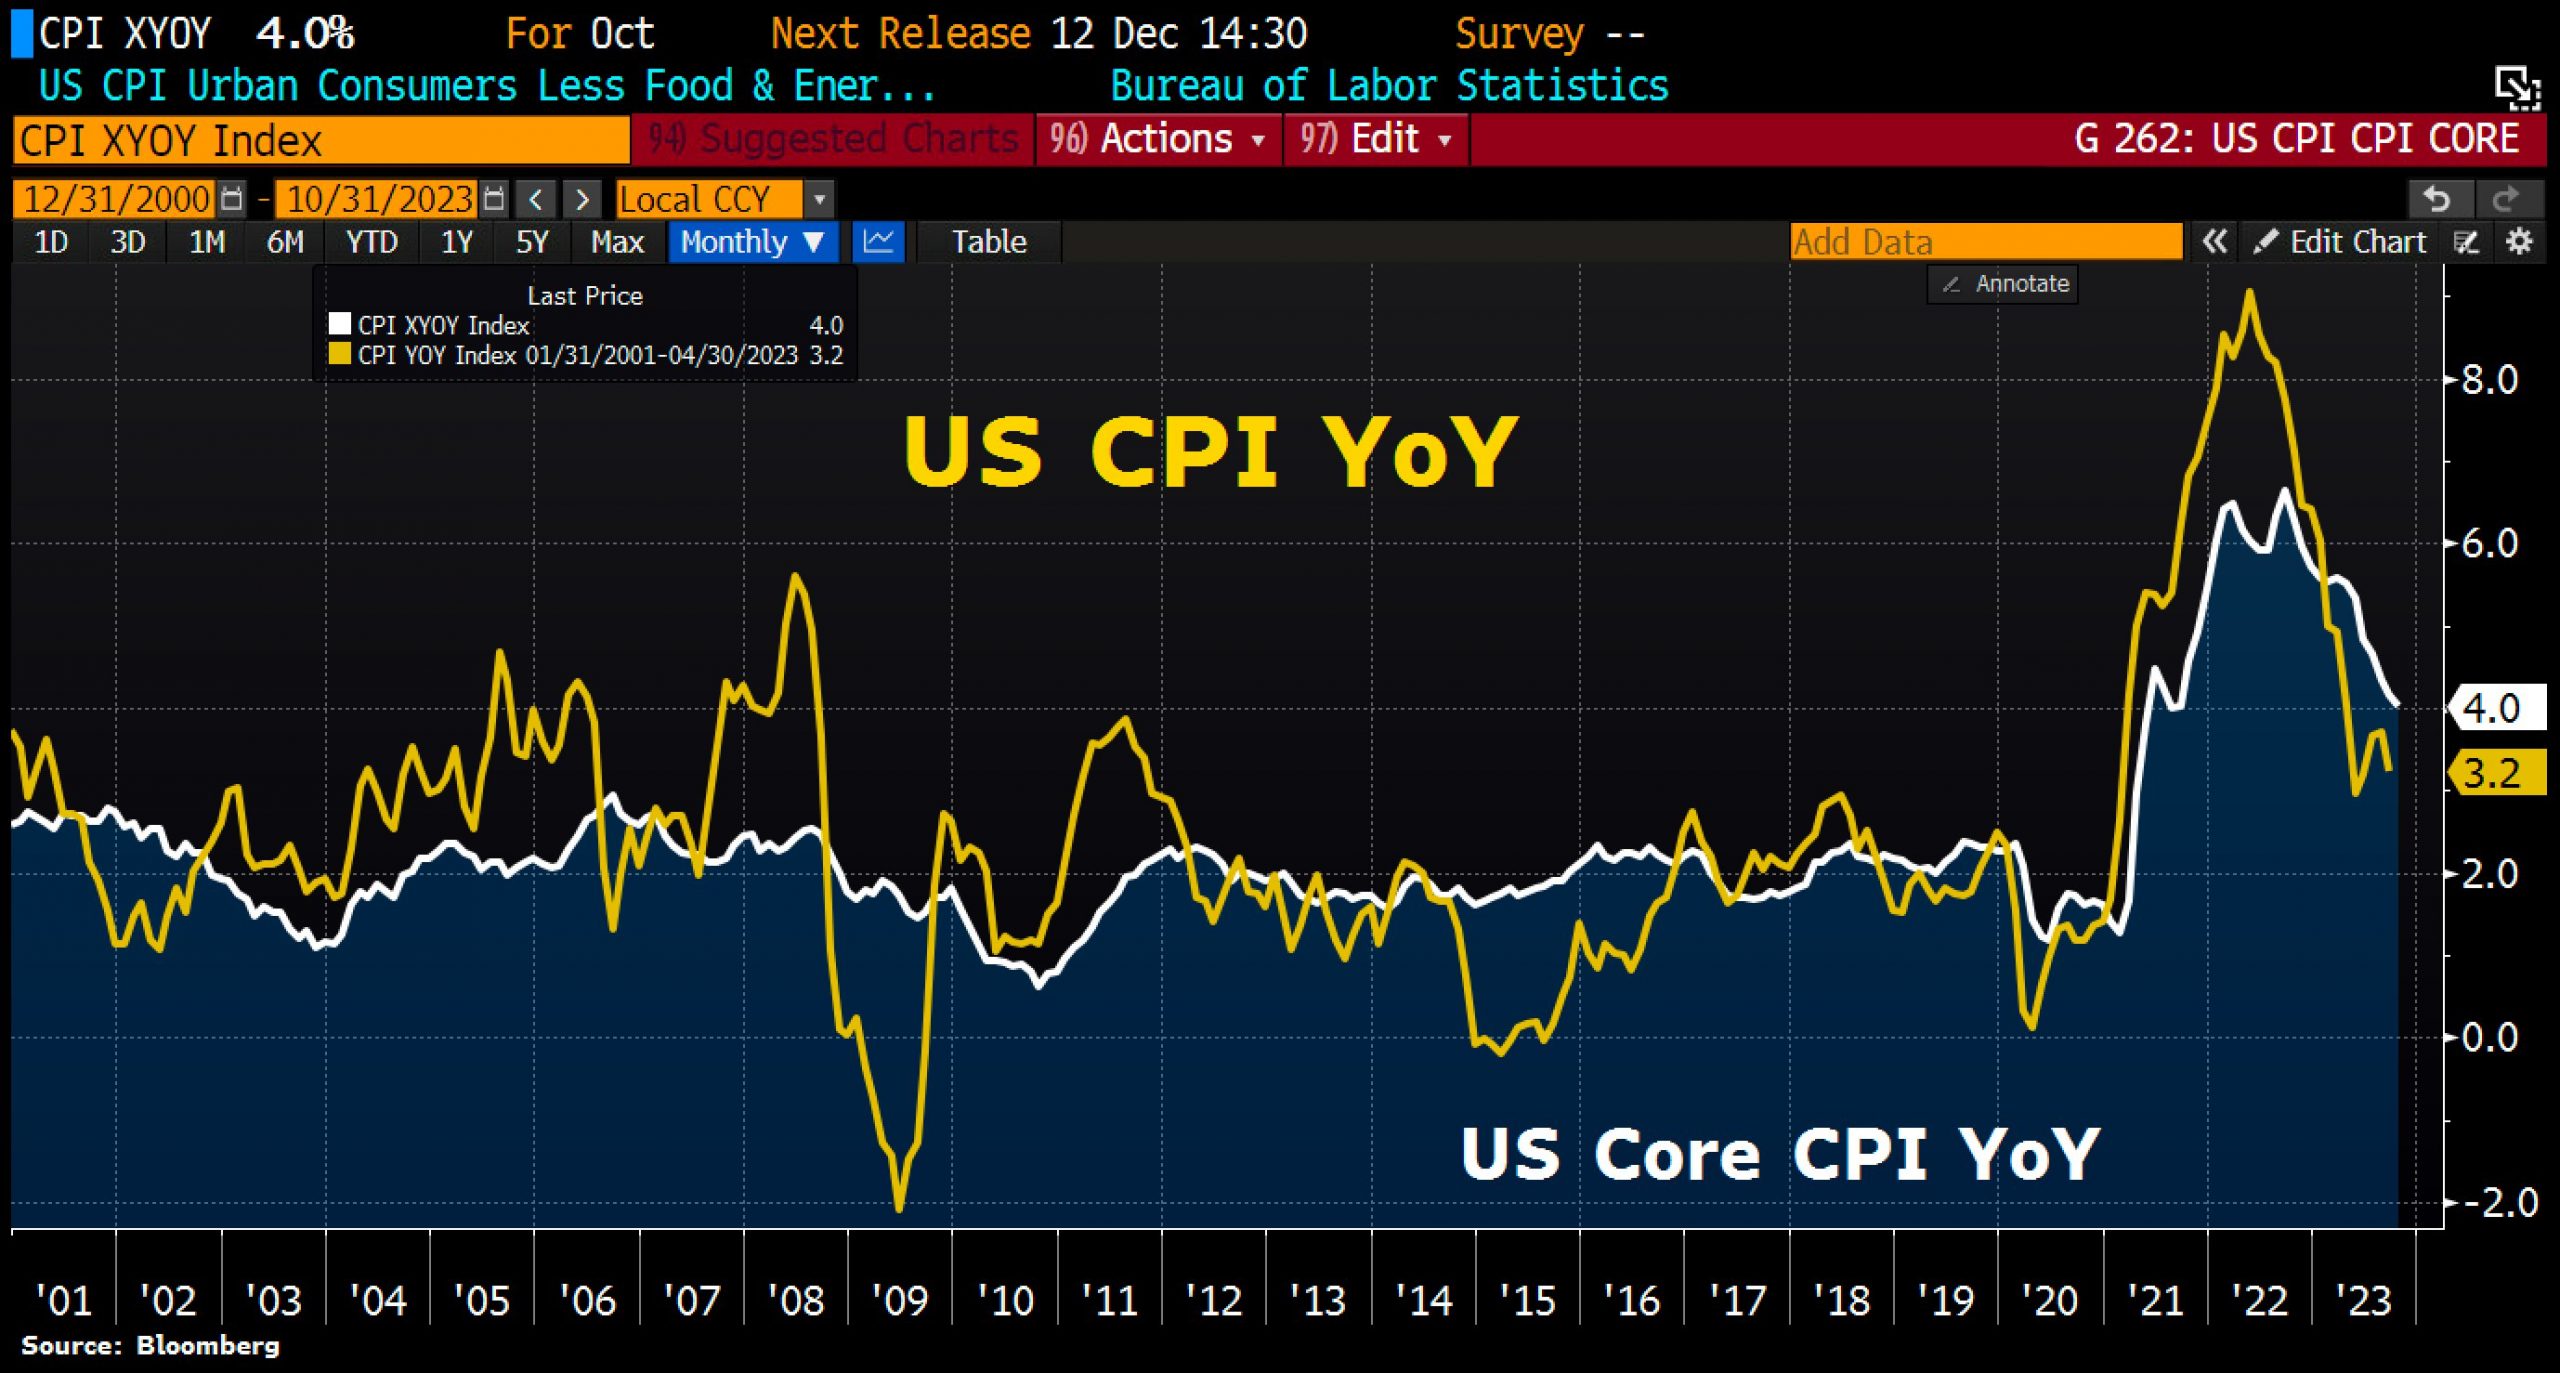
US Inflation Figures as of November 14th, 2023. Source: Holger Zschaepitz
In the past three weeks, the American stock index S&P 500 has rebounded by over 10%, reaching its highest level since early August. This rally was propelled, among other factors, by the consumer price inflation, which dropped to 3.2% in October, and a staggering 0.5% decline in US producer prices. This outcome undercut the Wall Street consensus, catching many pessimistic market participants off guard. Following the inflation data, 10-year US bonds fell to 4.43%, as no further interest rate hikes are expected in December. Consequently, the US dollar and yields plummeted. The year-end rally is already in full swing.
Illusion and Truth
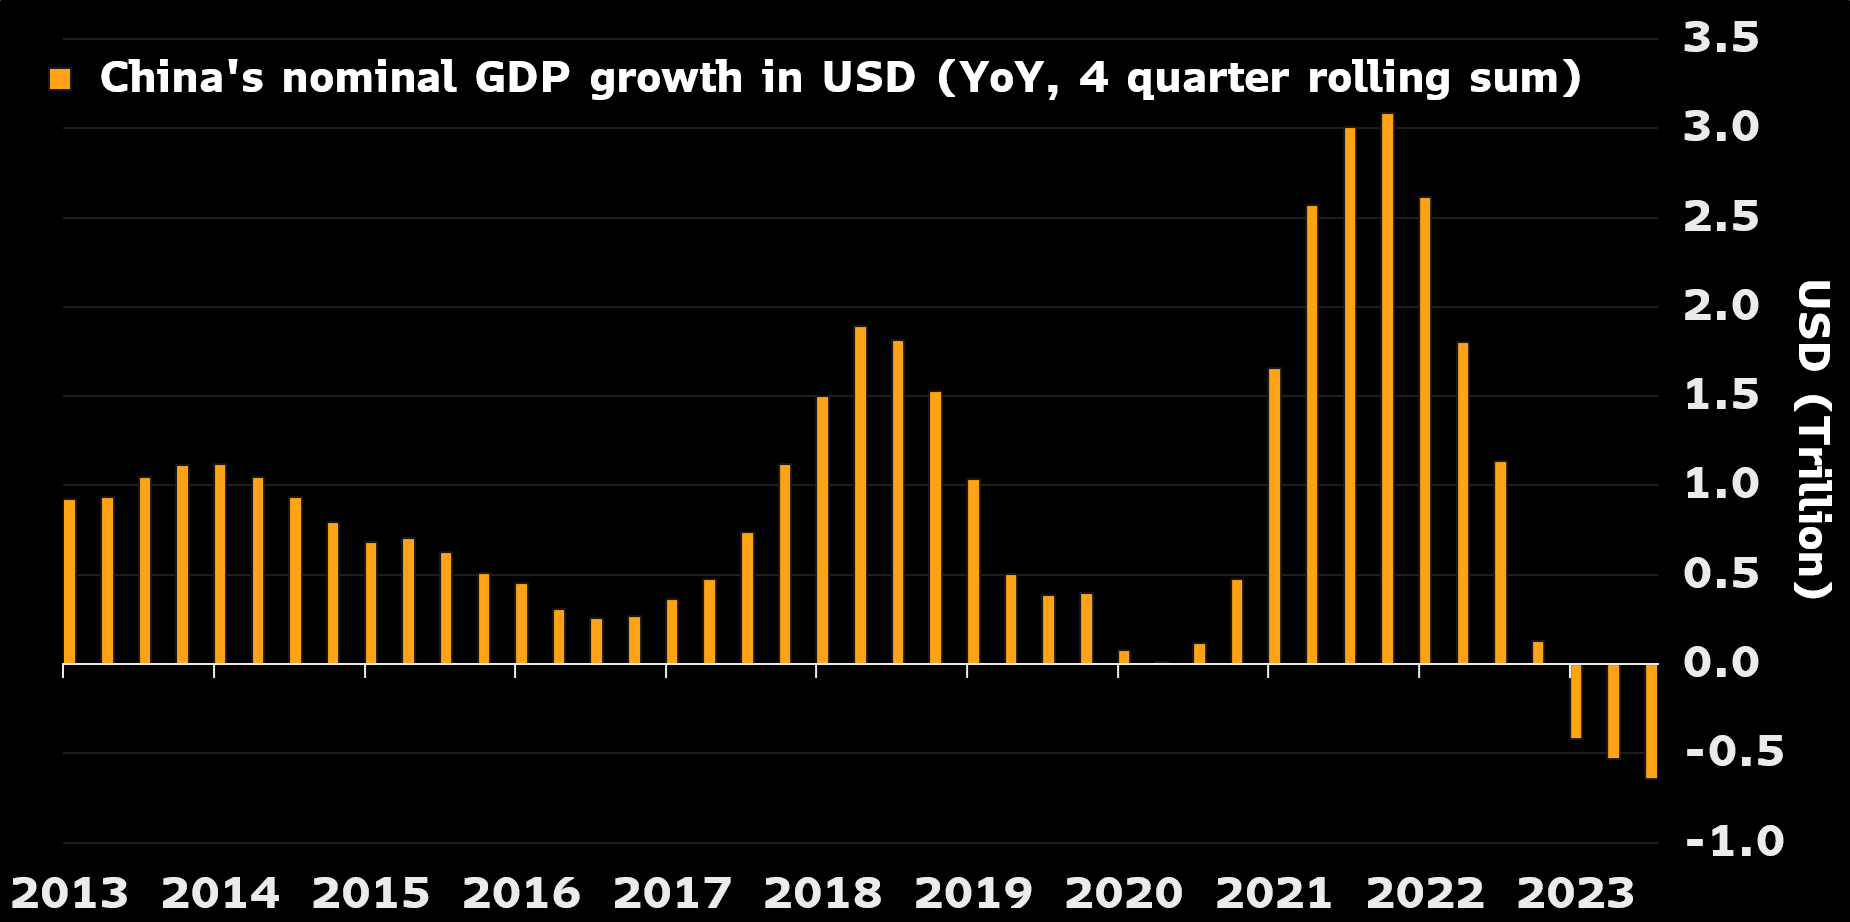
China’s Nominal GDP Growth in USD as of November 15th, 2023. Source: Holger Zschaepitz
However, the fundamental data paint a very different and grim picture. A few highlights include:
- US retail sales have declined for the first time in seven months.
- Delinquent commercial real estate loans at US banks have reached the highest level in a decade.
- The number of applications for unemployment benefits in the US has risen for eight consecutive weeks to the highest level in almost two years.
- Delinquencies on auto loans from US subprime borrowers reached a nearly 30-year high in September, hitting 6.1%, the highest rate since 1994.
- Citi Bank is commencing the first round of mass layoffs next Monday, with tens of thousands of employees expected to be let go.
- Prices for the eight major shipping routes have fallen by half this year, from USD 3,000 per container to just USD 1,400.
- China’s GDP has nominally shrunk in USD terms, making the Chinese economy challenging for foreign investors, not only due to geopolitical tensions.
- Out of approximately USD 175 billion in Chinese real estate bonds, bonds worth USD 124.5 billion are currently in default.
- US banks are at an all-time low compared to the S&P 500.
An unprecedented contraction in money supply
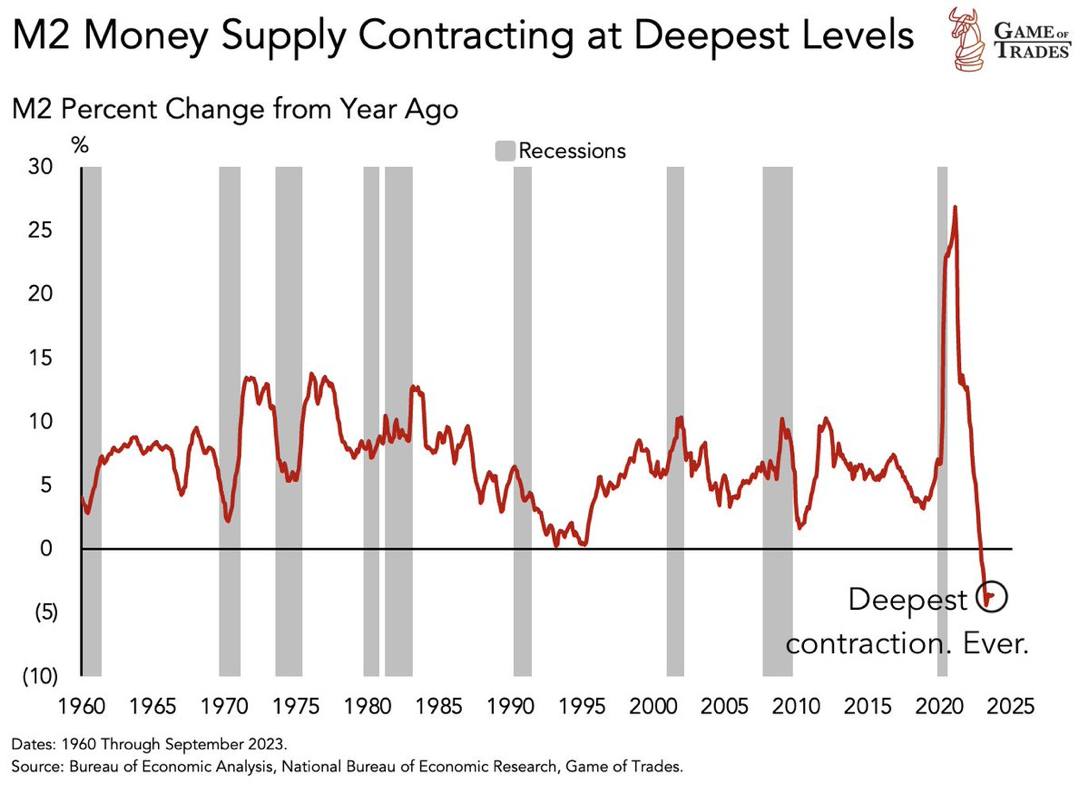
M2 Money Supply. Source: Bureau of Economic Analysis, National Bureau of Economic Research, Game of Trades.
Rising insolvencies, plummeting revenues, mass layoffs, a sharp decline in container prices in shipping and freight, an unprecedented contraction in money supply, and worldwide hesitancy in spending collectively signal a looming recession. Increasing macroeconomic factors support this outlook. While monetary tightening (“Quantitative Tightening”) intensifies and the sharply increased interest rates gradually affect the economy and society, the threat of deflation, not inflation, looms in many areas! In short, the planet is on the verge of a brutal global recession.
US Rating as of November 12, 2023. Source: Keith McCullough
In 2023, US government has borrowed more than 3x the 2008 bailout package
This will force the Fed to significantly lower interest rates in the next 6 to 24 months. Simultaneously, the US government’s debt has surged by USD 2.5 trillion within a year, from USD 31.2 trillion to USD 33.7 trillion. Just this year alone, the US government has borrowed more than triple the amount of the 2008 bailout package to finance its deficits. The fiscal stimuli from the Biden administration, which had kept the markets and the US economy somewhat afloat this year, are expiring and are likely to be viewed in retrospect as a flash in the pan. In the short term, all of this is likely to weaken the US dollar and initially support the recovery in Bitcoin and the stock markets.
Nevertheless, it must be assumed that massive problems for the world economy and hence global financial markets will roll in as early as the first quarter of 2024. For Bitcoin, this does not bode well until the interest rate turnaround. The timing and speed of the Fed’s reversal are uncertain. Only when the money printing machine is restarted is Bitcoin likely to launch an attack on its all-time high. Until then, a tumultuous rollercoaster ride is on the horizon.
Conclusion: Bitcoin – Taking a breath before the next surge
After the steep rally since mid-October, optimism and, in some cases, euphoria are gaining ground in the crypto sector. However, in the grand scheme, not much has happened beyond a recovery slightly above the 38.2% retracement (USD 35,924). The hype around Bitcoin ETFs and a typically positive year-end could potentially bring a final surge to around USD 48,000 to USD 50,000 after the current breather. Such a spike could unfold in a matter of weeks.
Should Bitcoin fail to achieve this and experience a larger pullback directly or sooner, one would currently need to consider an established high and a more significant correction below USD 31,800. Historically, Bitcoin has typically concluded its bear markets with a double bottom. Prices below USD 20,000 seem distant at the moment and would likely only be expected in a global liquidity crisis. However, the necessary ingredients for a worldwide deflationary shock are already on the table. Predicting exactly when it will occur is currently challenging. Nevertheless, from the first quarter of 2024 onward, we would be much more cautious and significantly increase the liquidity ratio.
Analysis sponsored and initially published on November 18th, 2023, by www.celticgold.eu. Translated into English and partially updated on November 19th, 2023.
Feel free to join us in our free Telegram channel for daily real time data and a great community. If you like to get regular updates on our gold model, precious metals, commodities, and cryptocurrencies, you can also subscribe to our free newsletter.
Disclosure:
This article and the content are for informational purposes only and do not contain investment advice or recommendations. Every investment and trading move involves risk, and readers should conduct their own research when making a decision. The views, thoughts, and opinions expressed here are the author’s alone. They do not necessarily reflect or represent the views and opinions of Midas Touch Consulting.

