


Fractals – Volatility solutions
In turbulent times like these, many trading systems get close to their breaking point. Many indicators or otherwise used trading tools are useless. It is important to know what works and when to switch systems. What tools to focus on in what environment. Typical support and resistance zones in times of high volatility are less reliable. Market movement doesn’t care much for a specific number, when emotions like fear are in place. Fractals – Volatility solutions.
Fractal market hypothesis
Fractal market hypothesis (FMH) originates comes from mathematics. It refers to a fragmented geometric shape that can be broken into smaller parts that fully or nearly replicate the whole.
It defines three aspects:
- A time horizon of how long assets are held.
- Liquidity, which is greatest when investors have a different view where markets go.
- Information impact.
In times of crisis three things happen:
- The time horizon of how long assets are typically held changes since long term investments might get cut short.
- Liquidity is affected since the balance of diversity of belief of direction of an instruments gets annihilated. Everybody wants to sell. The market gets ill-liquid.
- The fear based information affects the typical investment horizon variability. This causes a market instability.
In short, charts of monthly, weekly, daily and sixty minute time frame are all lining up to one turning point.
If you have been following our telegram channel, you might have been noticing that our trading approach is in principle based on FMH. We have built a confluence system that analyzes turning point alignment between various time frames. This allows for precision entry and exit timing on extremely low risk. In addition it allows for an early warning system of when to stay out of extremely volatile markets that are not aligned.
Bitcoin Weekly Chart: Fractals – Volatility Solutions:
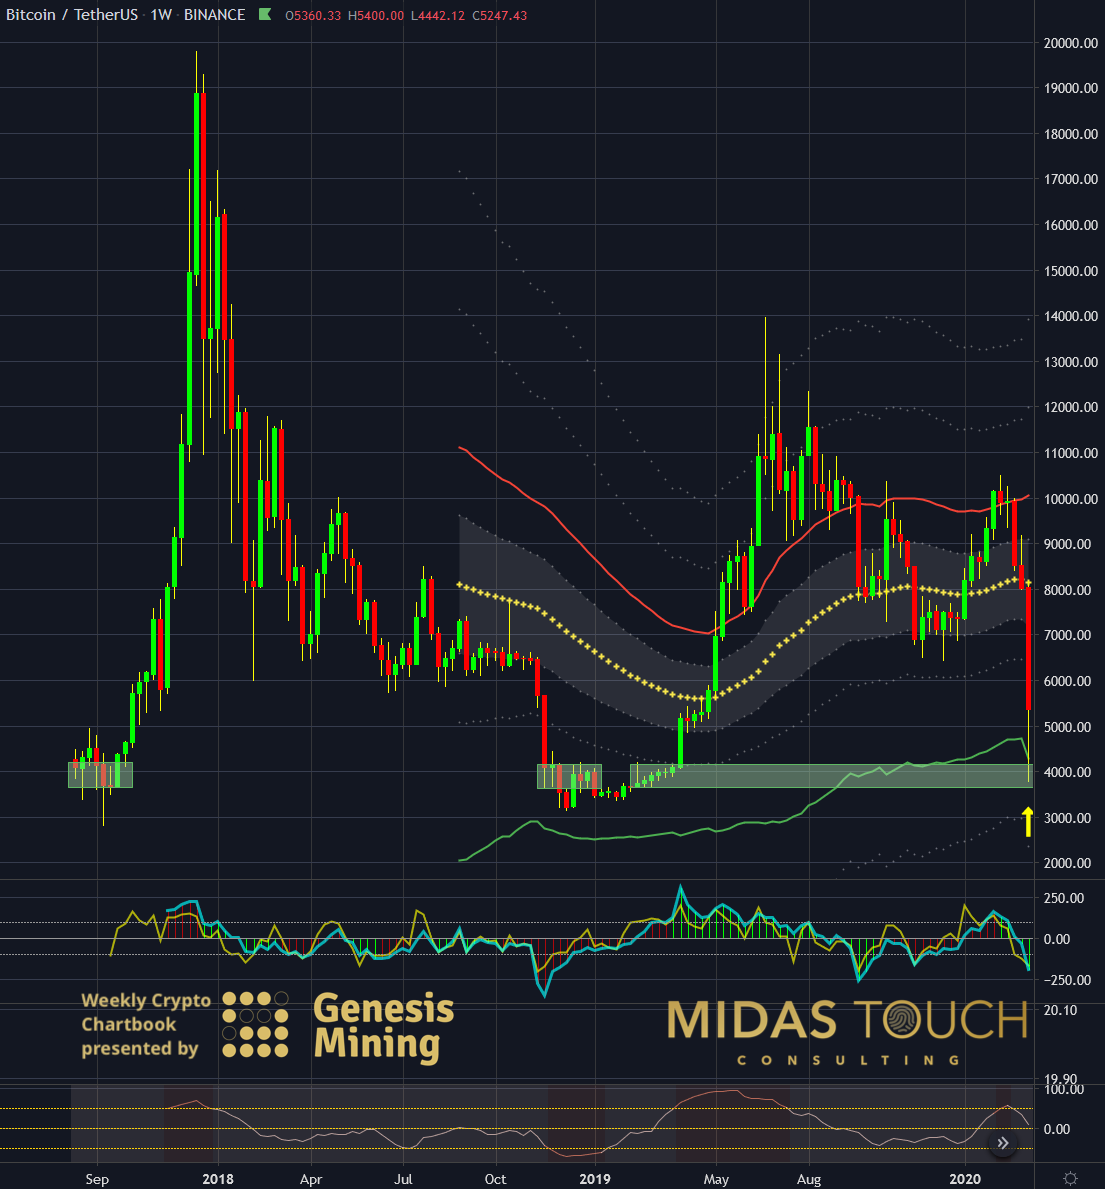
BTCUSDT weekly chart as of March 12th, 2020
On the 12th of March Bitcoin entered on high volatility into a fractal range on its weekly time frame. In less than 5 weeks it had moved rapidly 6 standard deviation levels (red line +2, green line -3). With a price decline of more than 50% in its recent week an action/reaction play was set in motion. The Commodity Channel Index showed oversold values below -200. These facts didn’t just evoke curiosity they clearly challenged possible entry criteria to be verified on lower time frames.

Bitcoin Daily Chart: Fractals – Volatility Solutions
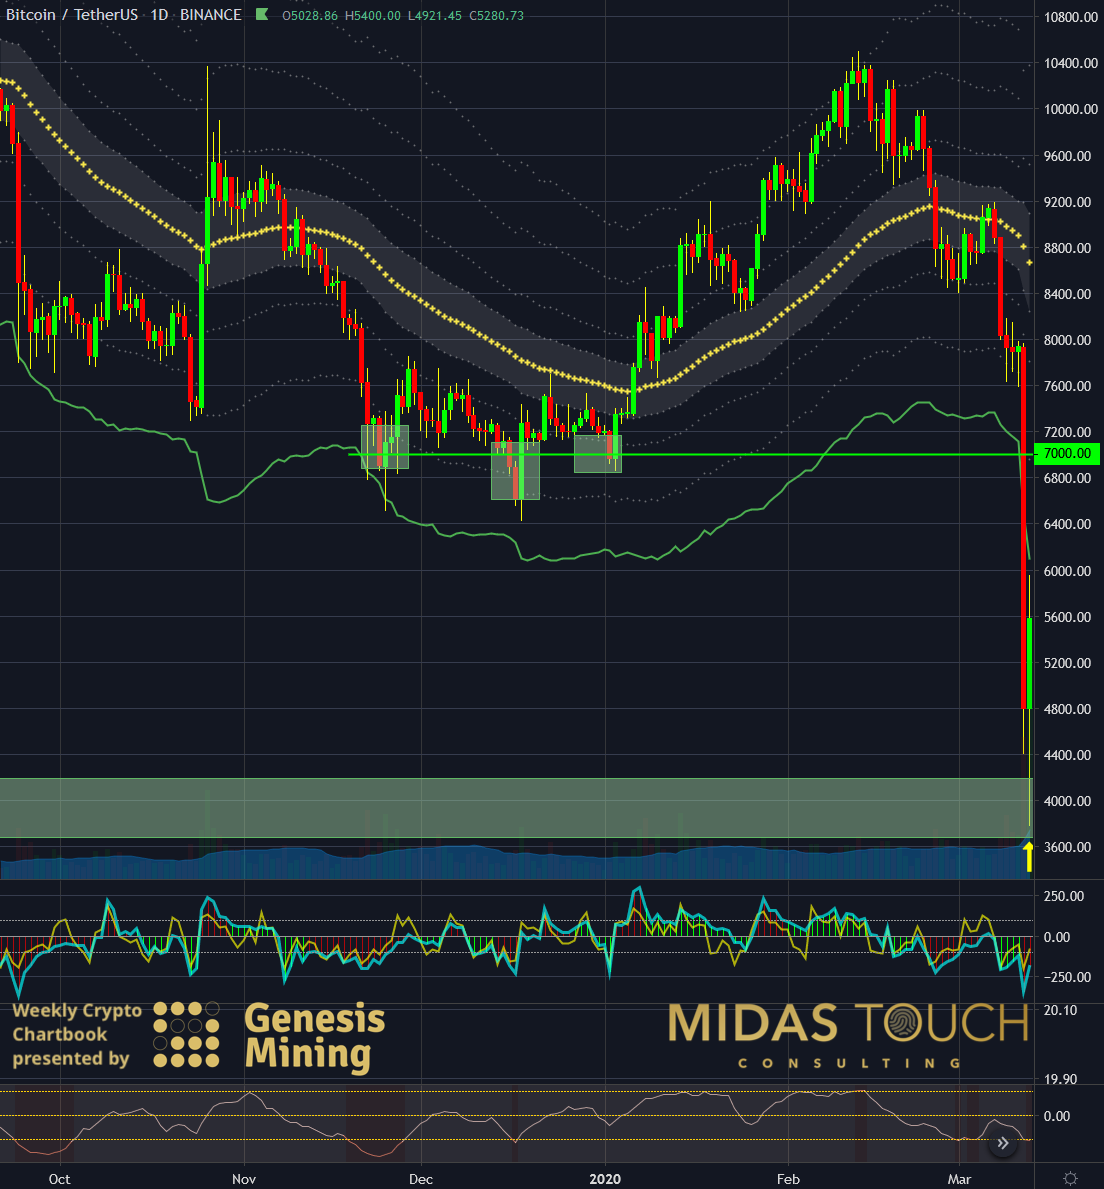
BTCUSDT daily chart as of March 12th, 2020
At the same time the daily time frame revealed a six sigma event. In only a day and a half prices had sliced through good fractal support near the US$7,000 price zone. As well, volatility and volume showed a reversal imminent. Lower band -4 standard deviations had been extended by far and warranted for a good risk reward zone to be present.
Bitcoin Sixty Minute Chart:
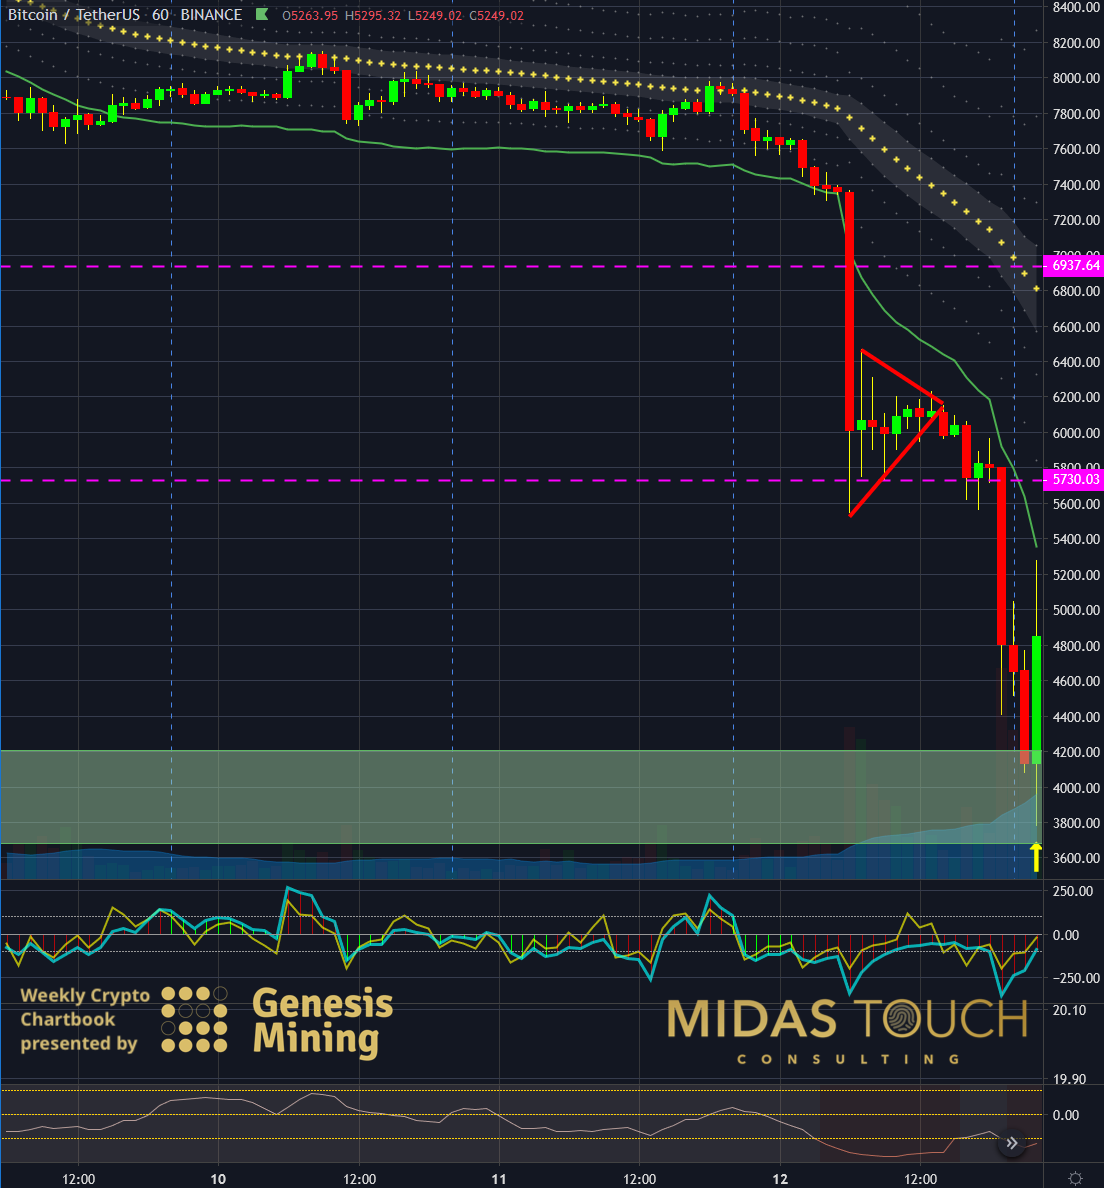
BTCUSDT sixty minute chart as of March 12th, 2020
The sixty minute time frame was our final verification tool if and when to strike. We posted entries of US$4,017 for the sixty minute time frame, US$4,011.19 for the daily time frame and US$4,102 for the weekly time frame in our telegram channel. With an instant aggressive bounce, financing profits could be booked within the hour (see our quad exit strategy).
- weekly time frame financing target profits: 26.47%
- daily time frame financing target profits: 30.29%
- 60 minute time frame financing target profits: 31.54%
shortly after the next targets were reached:
- weekly time frame financing target profits: 44.47%
- daily time frame financing target profits: 48.01%
- 60 minute time frame financing target profits: 28.09%
We still have runners (the last 25% of the initial position) exposed to the market with stops now at break even entry levels.
Monero Weekly Chart:
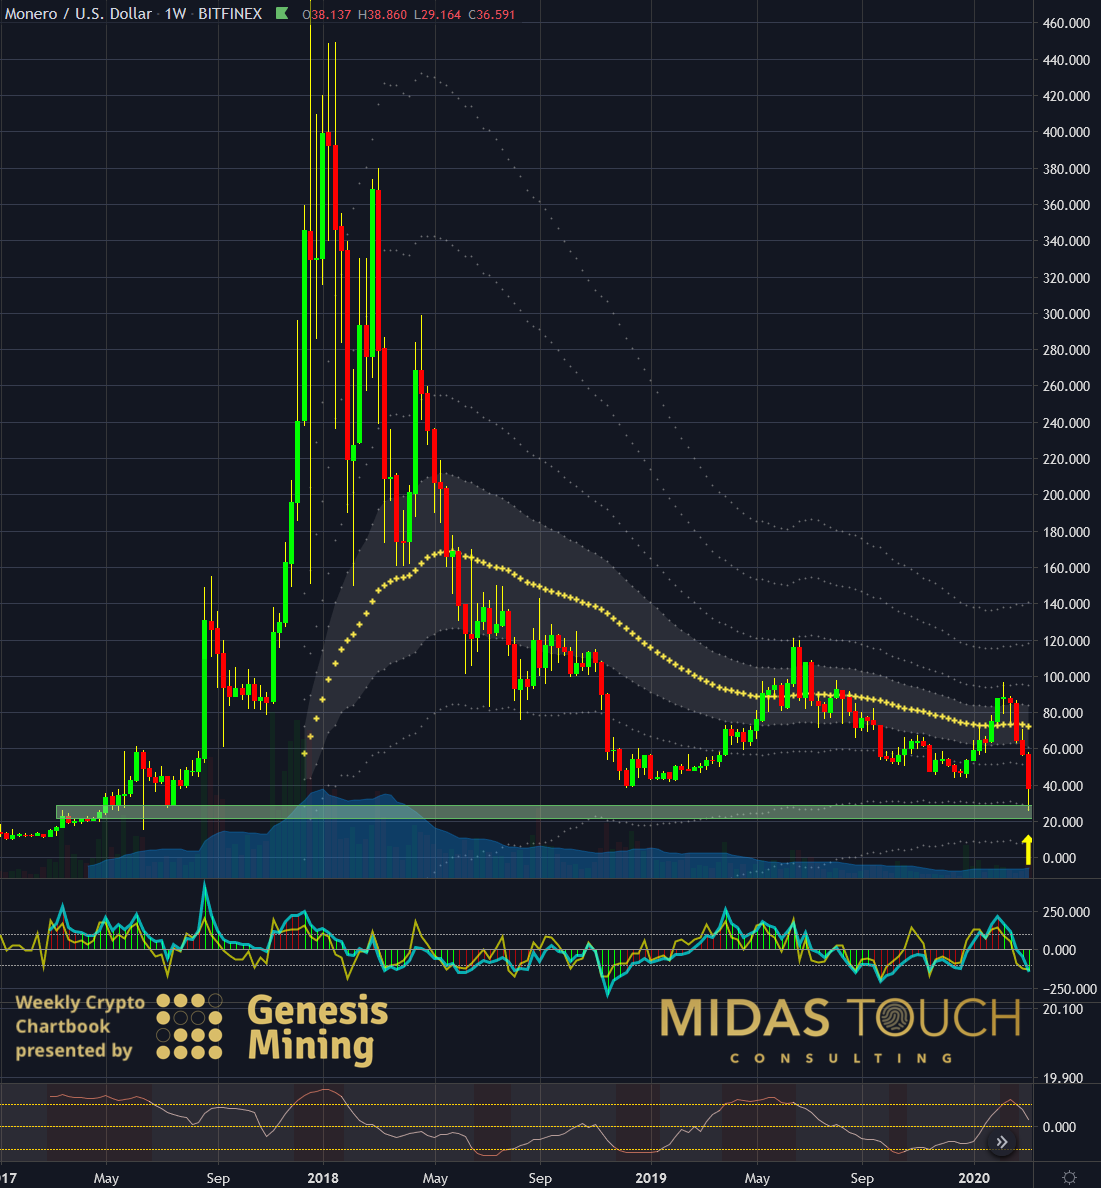
XMRUSD weekly chart as of March 12th, 2020
With rare confluence points this strong we stepped into the market more aggressively at the time than just the Bitcoin market itself.
We also took positions in Ethereum (ETH), Litecoin (LTC) and Monero (XMR).
The above weekly chart shows Monero and how fractal advantage could be exploited at the time (similar to Ethereum and Litecoin). We mutually took the first 2 target levels off. Percentage profits were in the same vicinity than the Bitcoin ones. (ETH fin target 27.33%, LTC fin target 23.89%, XMR fin target 24.56%)( ETH next target 30.32%, LTC next target 34.55%, XMR next target 34.53%)
Fractals – Volatility solutions
While support/resistance concepts are wide spread, they are to rigid in their approach for highly emotional markets. FMH allows for more wiggle room. That is to say the underlying principles bring sustenance to a way of “seeing through the market”.
Consequently, using this holographic foundation in our concepts via a confluence approach between time frames, provides an edge. It allows for control in market environments that cause havoc for most. It also works in more stable market environments as well! These principles are the root of us using the term “top down” approach. It represents market transparency from a multidimensional view by watching multiple time frames at the same time.
All our decisions, entries and exits or staying on the sidelines are posted live in our free telegram channel. We try to support our community as best as we can through difficult trading environments like the one right now.
If you like to get regular updates on our gold model, precious metals and cryptocurrencies you can subscribe to our free newsletter.

