


The whys – Bitcoin ten thousand
You don’t need to know the news that try to explain why prices have moved. Price action right now is a good example of that. The crowd wakes up on the news when we hit 10k on Bitcoin. Information with very little value to a trader. Why prices moved towards ten thousand is the question to ask. And even more, when to buy and where to get out. In our last weekly chartbook publication, we answered one of these questions. Where to buy. The whys – Bitcoin ten thousand.
BTC-USDT, Daily Chart, Where To Buy And Why:
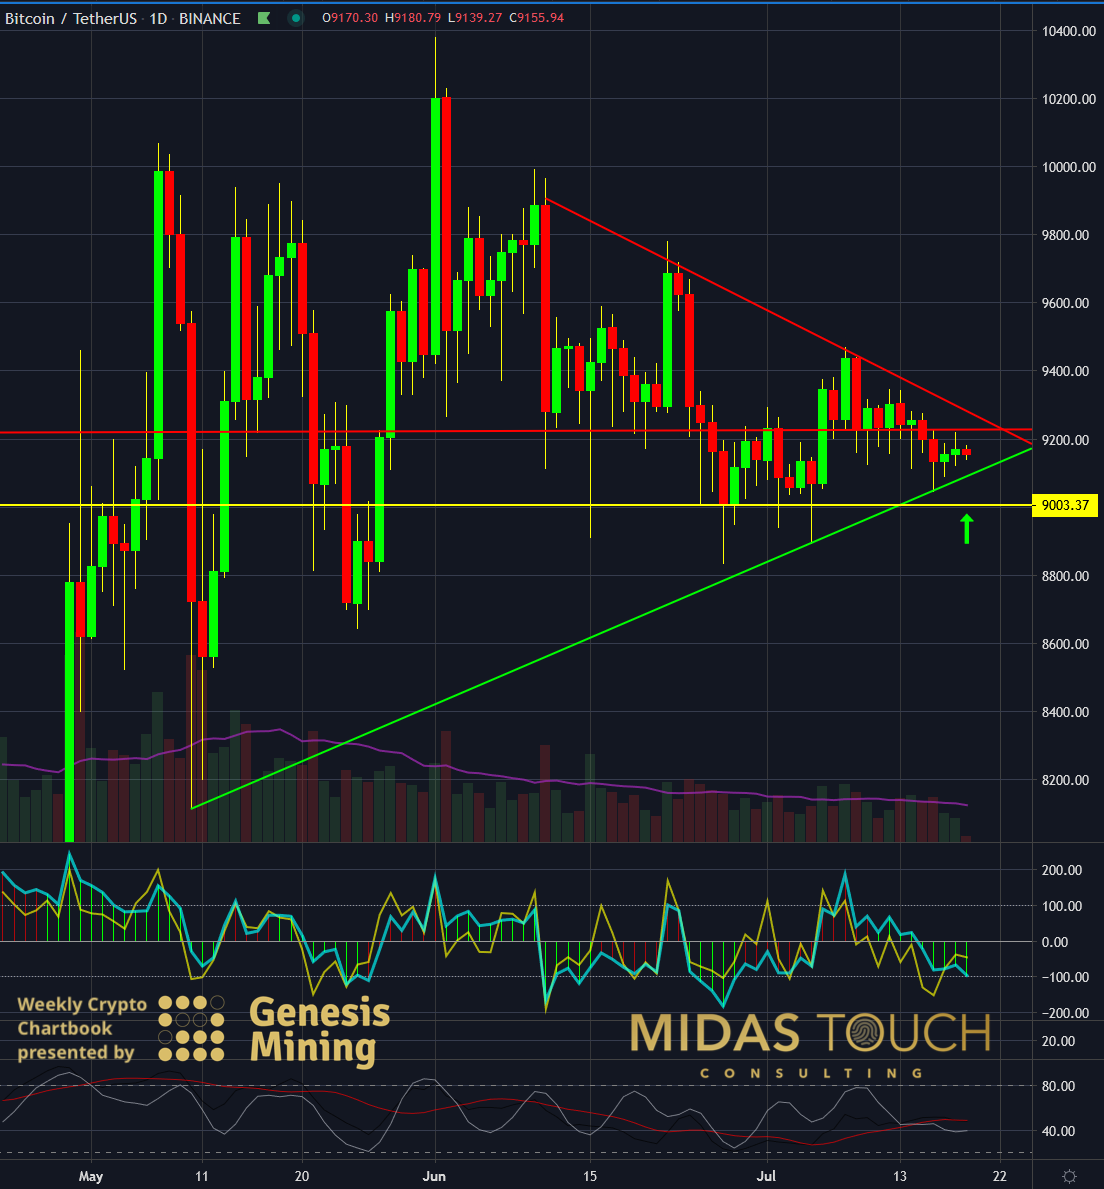
BTC-USDT, daily chart as of July 19th, 2020
We posted this chart with an entry on our last chartbook. The entry was US$9186.82 on the 19th of July 2020. Why did we buy it?
In technical analysis sideways and directional channels suffer from the clarity of a time component. Some say the more often a support or resistance line gets touched by the price the more brittle these lines become for a price penetration. Others say the more frequent these lines get touched by the price the more it substantiates these zones for prices reversing. The typical dilemma of a trader, dualism. Consequently, no help for clear decision making processes on when to get in. The only statistical merit channels provide is the relation between the length of congestion and the possible magnitude of a breakout from that channel. The longer the time period of a congestion channel the higher the probability of a substantial price move at breakout!
Triangle formations are way more helpful.
Why? Price is forced at the apex to the far right to choose a side (more often than not). If prices touch a directional support or resistance line multiple times, it means a weakening of that line for possible penetration. Why? More often than not the stronger support side gets less often touched since price doesn’t even get that far anymore since greed gets participants in on the action already at an earlier point.
As did we. The following chart will show that we had a slightly early entry and prices did touch one more time lower support to break through key levels higher shortly after.
Daily Chart, BTC-USDT, Where To Get Out:
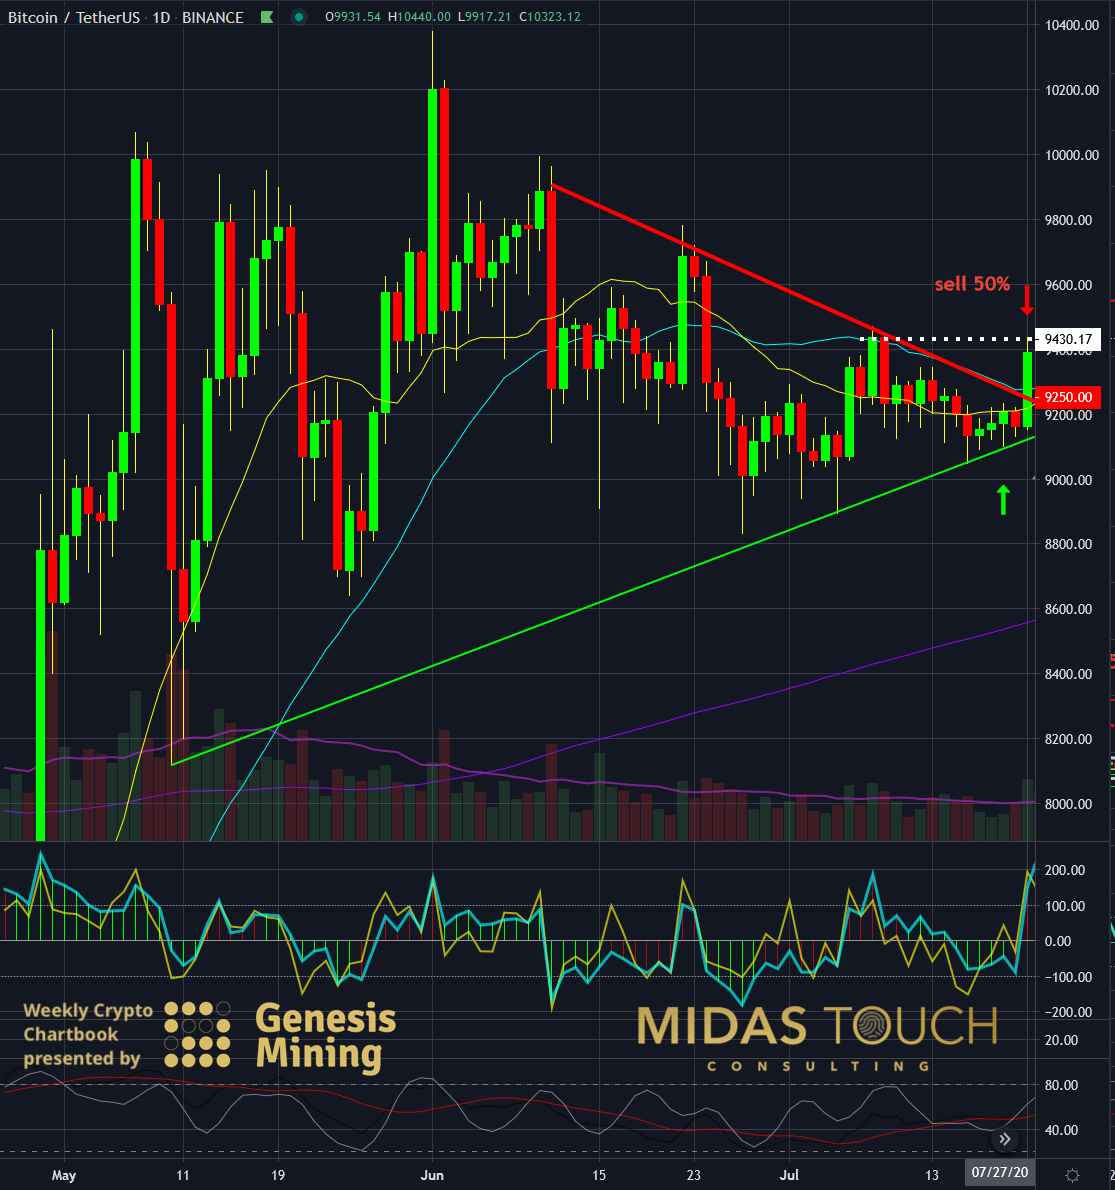
BTC-USDT, daily chart as of July 21st, 2020
We use our quad exit strategy. a method that allows flexibility through pairing out of positions. In this specific case, we took half of our position off into a momentum push into the next resistance with an exit at US$9343.
The Whys – Bitcoin Ten Thousand, BTC-USDT, Daily Chart, Reentry:
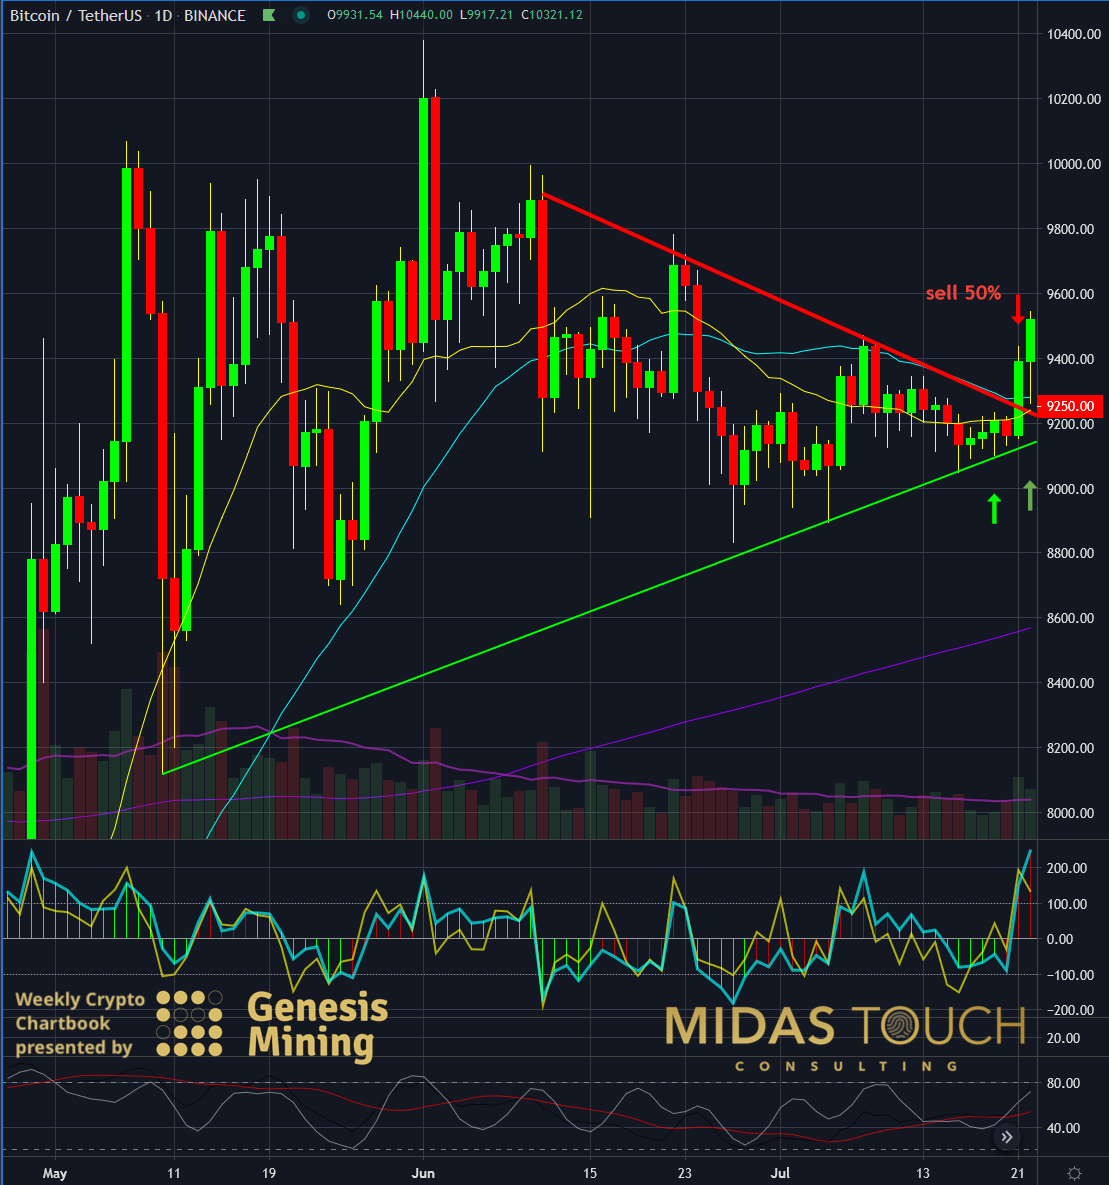
BTC-USDT, daily chart as of July 22nd, 2020
With a successful breakthrough in the upper trend line and first profits booked (= risk reduced), we added a second long entry (on 7/22/2020) once prices retraced towards the US$9,250 resistance break out level, which now had become support. We waited for entry with the confirmation of the bounce. This long entry was filled at US$9,383. All our trades are posted live on our Telegram Channel.
BTC-USDT, Daily Chart, Bitcoin Ten Thousand, Not A True Focus Point:
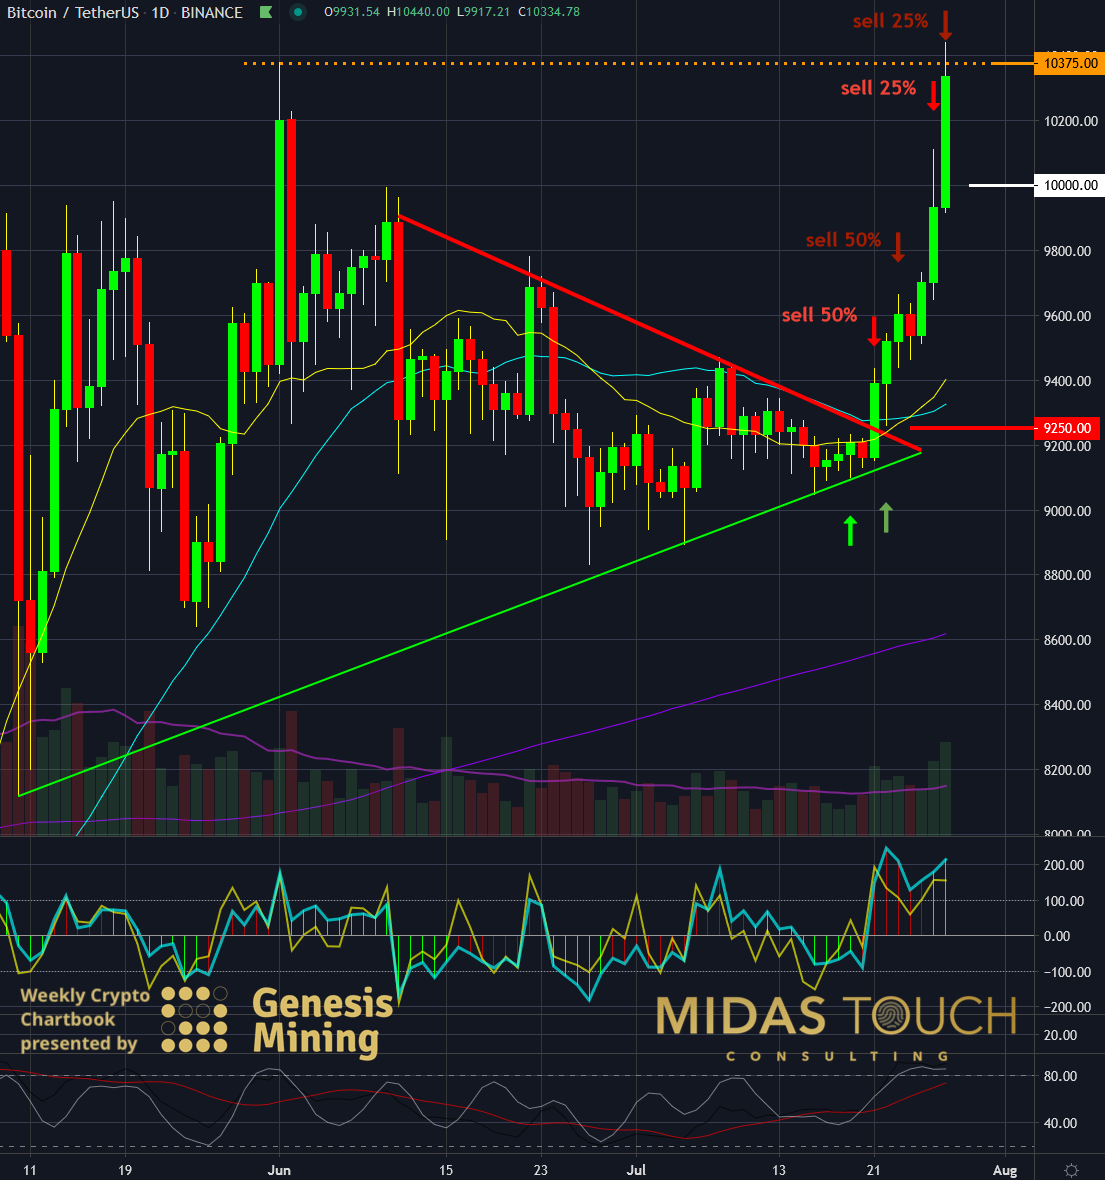
BTC-USDT, daily chart as of July 27th, 2020
Again we took half off that position into the next momentum upthrust at US$9,532 to eliminate risk and take partial profits. And again let the cash register ring once prices hit the volatility zone of Bitcoin ten thousand for the first trade and at the major double top US$10,297 (orange dotted line) near US$10,375.
With this still bullish scenario, we are now positioned with two runners exposed to the market and enjoying the ride. This with two trades that produced in their last exits profit percentages of 9.65% and 9.74% and a risk-reward ratio of 1:9.5 and 1:5.5 (or higher).
Looking at the chart above, what if you only wake up to the news of Bitcoin at ten thousand. Where do you buy? Where is your stop? What is your risk? The truly important level is US$9,250 not ten thousand. The focus, the anticipated triangle breakout at the quiet times when no news alerts. Know your whys!
From here we see a continuous bullish scenario playing out.
The whys – Bitcoin ten thousand
This is only the beginning. Where you want to be especially clear about your whys is in relationship to your trading psychology!
If you do not know why you act the way you do why you make mistakes, why you feel the way you feel, you will be in a whole lot of trouble down the road. All emotional responses or question-marks as a whole need to be eradicated by asking quality questions.”Why did I run this top?”-“And why did I get out too early?”-“Why did I violate my rule?”- The why’s are so important because they are different for everybody. The answer isn’t “you fouled up, you weren’t disciplined?”
The question is why? Underlying inferiority complexes, accountability issues, fear of losing the money you can’t afford to lose, fear of success since it could mean change, fear of change as a whole, the list is endless and very very specific for each individual. You need to dig deep, look under the rug. Your childhood and any unresolved issues will need to be brought to the forefront, no matter how much inner conflict there is. You might need professional help to unravel painful memories never before looked at, might need reconditioning of conflicting beliefs and response patterns… but most and foremost you need to ask these why questions…
We post real time entries and exits for many cryptocurrencies in our free Telegram channel.
If you like to get regular updates on our gold model, precious metals and cryptocurrencies you can subscribe to our free newsletter.

