Bitcoin – Next Attack On US$10,000
Bitcoin has been moving sideways for many many weeks. In the meantime precious metals and stock markets rallied significantly. As well, DeFi has been exploding over the last two months. Hence, Bitcoin and Ethereum look poised to start a catch up rally rather very soon. Bitcoin has likely started the next attack on US$10,000.
Review
Since May 7th, about therefore now more than two and a half months, Bitcoin prices have been moving sideways. Starting from the “corona low” at US$4,000, Bitcoin did reach the round psychological resistance at US$10,000 after a strong rally. In view of the previous rally of over 150%, this tough and long-lasting consolidation is perfectly normal and healthy. Moreover, the pullbacks on the downside remain within a very manageable range.
The trading range over the past few weeks has been between US$9,000 and US$9,500. Occasional spikes recently only reached to just under US$9,700 on the upper side and to around US$8,800 on the lower side. Overall, this has brought Bitcoin volatility down to an unusually low level. For example, the Bollinger Bands on the daily chart have also tightened extremely tight. In the last few days, Bitcoin has managed to clearly jump above the short-term downward trend line of the last five weeks and Bitcoin is trading above the US$9,500 mark again.
Technical Analysis For Bitcoin – Next Attack On US$10,000
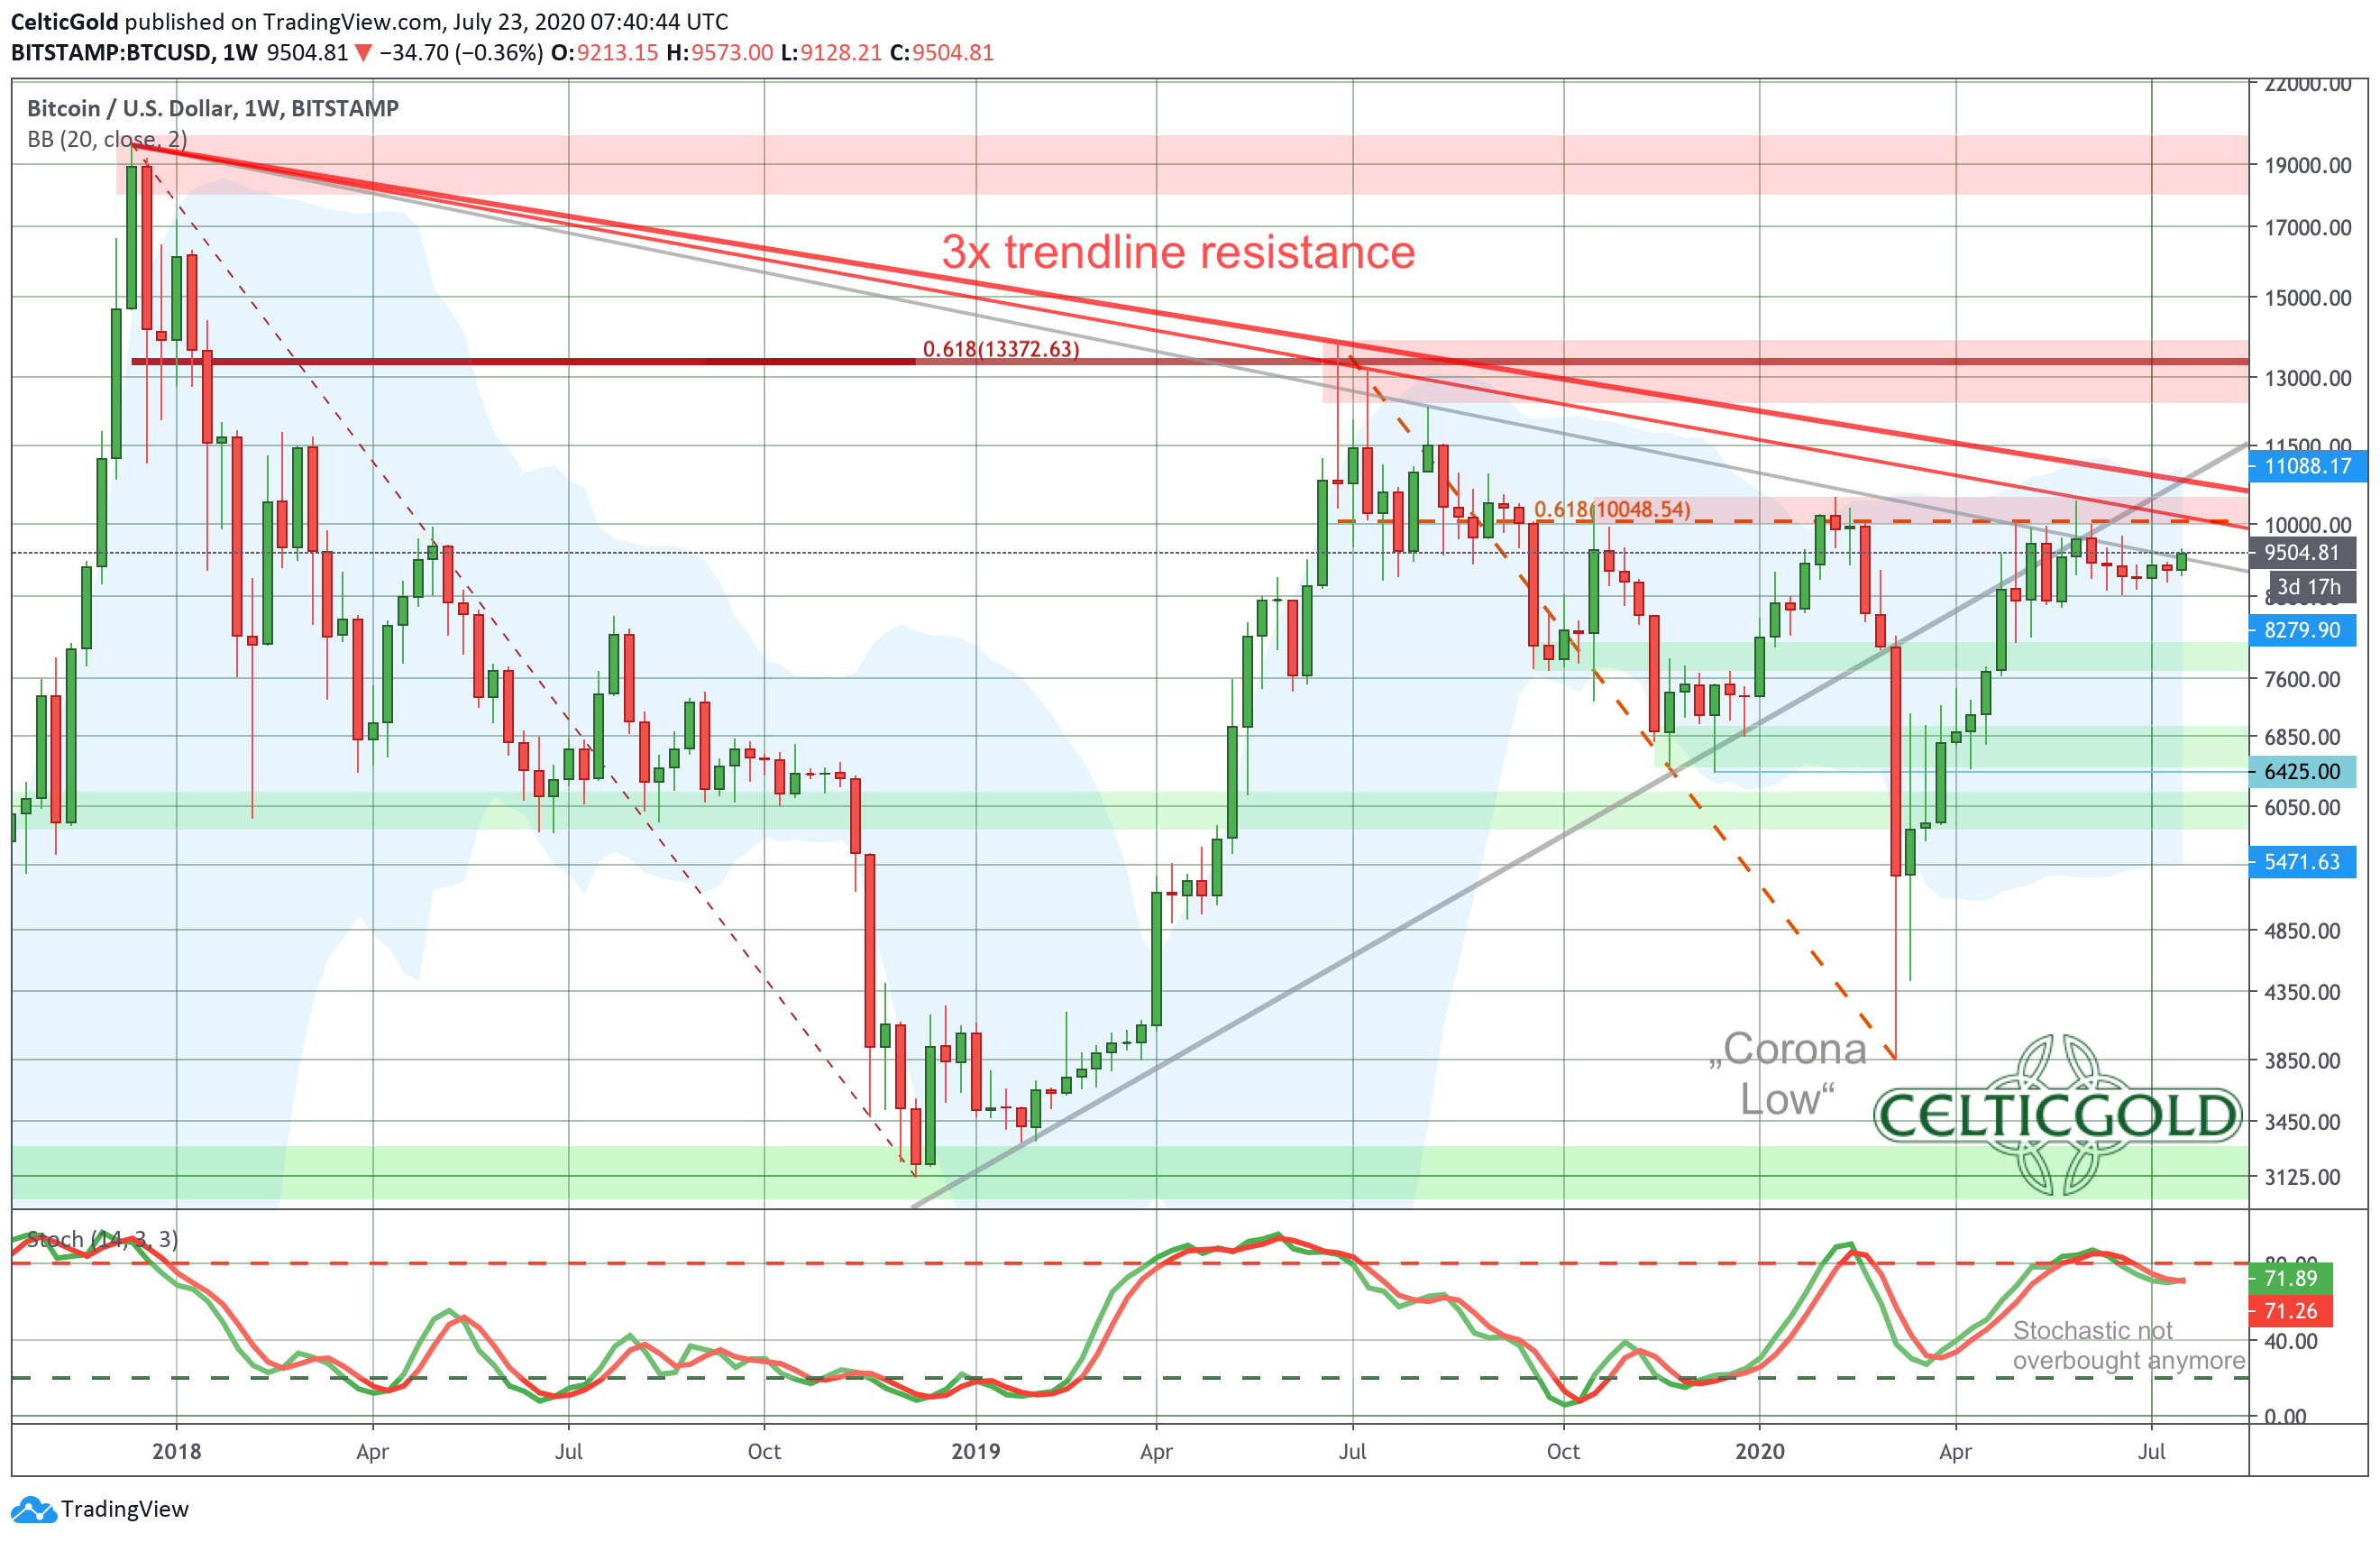
Despite the two and a half month sideways phase, the heavily overbought situation on the weekly chart was only partially corrected. In the environment of the crack-up-boom, this rather unusual behaviour can be observed in all markets. There are simply hardly any really noteworthy pullbacks or corrections anymore. The flock of those who are waiting for the smallest dip to swap their hard-earned paper currencies for safer forms of investment is too large. In this respect, the tenacious multi-week sideways movement is obviously the maximum the bears were able to achieve here. After all, the Stochastic Oscillator got rid of extreme overbought readings and has some nw air to the top.
In the course of this trading week, the Bitcoin again managed to jump over the first of three downtrend-lines, which can be drawn from the all-time high in December 2017 and the highs of summer 2019. This has cleared the way for a rise towards at least US$10,000. Here, the 61.8% retracement of the downtrend between July 2019 and March 2020 is waiting at US$10,048. The round US$10,000 mark thus not only represents psychological resistance, but also contains an important Fibonacci retracement for Bitcoin.
The upper Bollinger Band, on the other hand, already offers room to go as high as US$11,088 USD. This region is also the top of the three downtrend lines that need to be cracked. Price targets around $11,000 and maybe even $11,500 are therefore at the upper end of the realistic scale for the next one to two months.
In summary, the weekly chart remains neutral. A rise in the price towards US$10,000 and possibly even US$11,000 seems possible in the coming weeks. However, a clear breakout above these two levels is needed to generate more bullish momentum. Only then are prices around US$13,000 USD possible until September. Before the US elections, however, patience and caution are recommended.
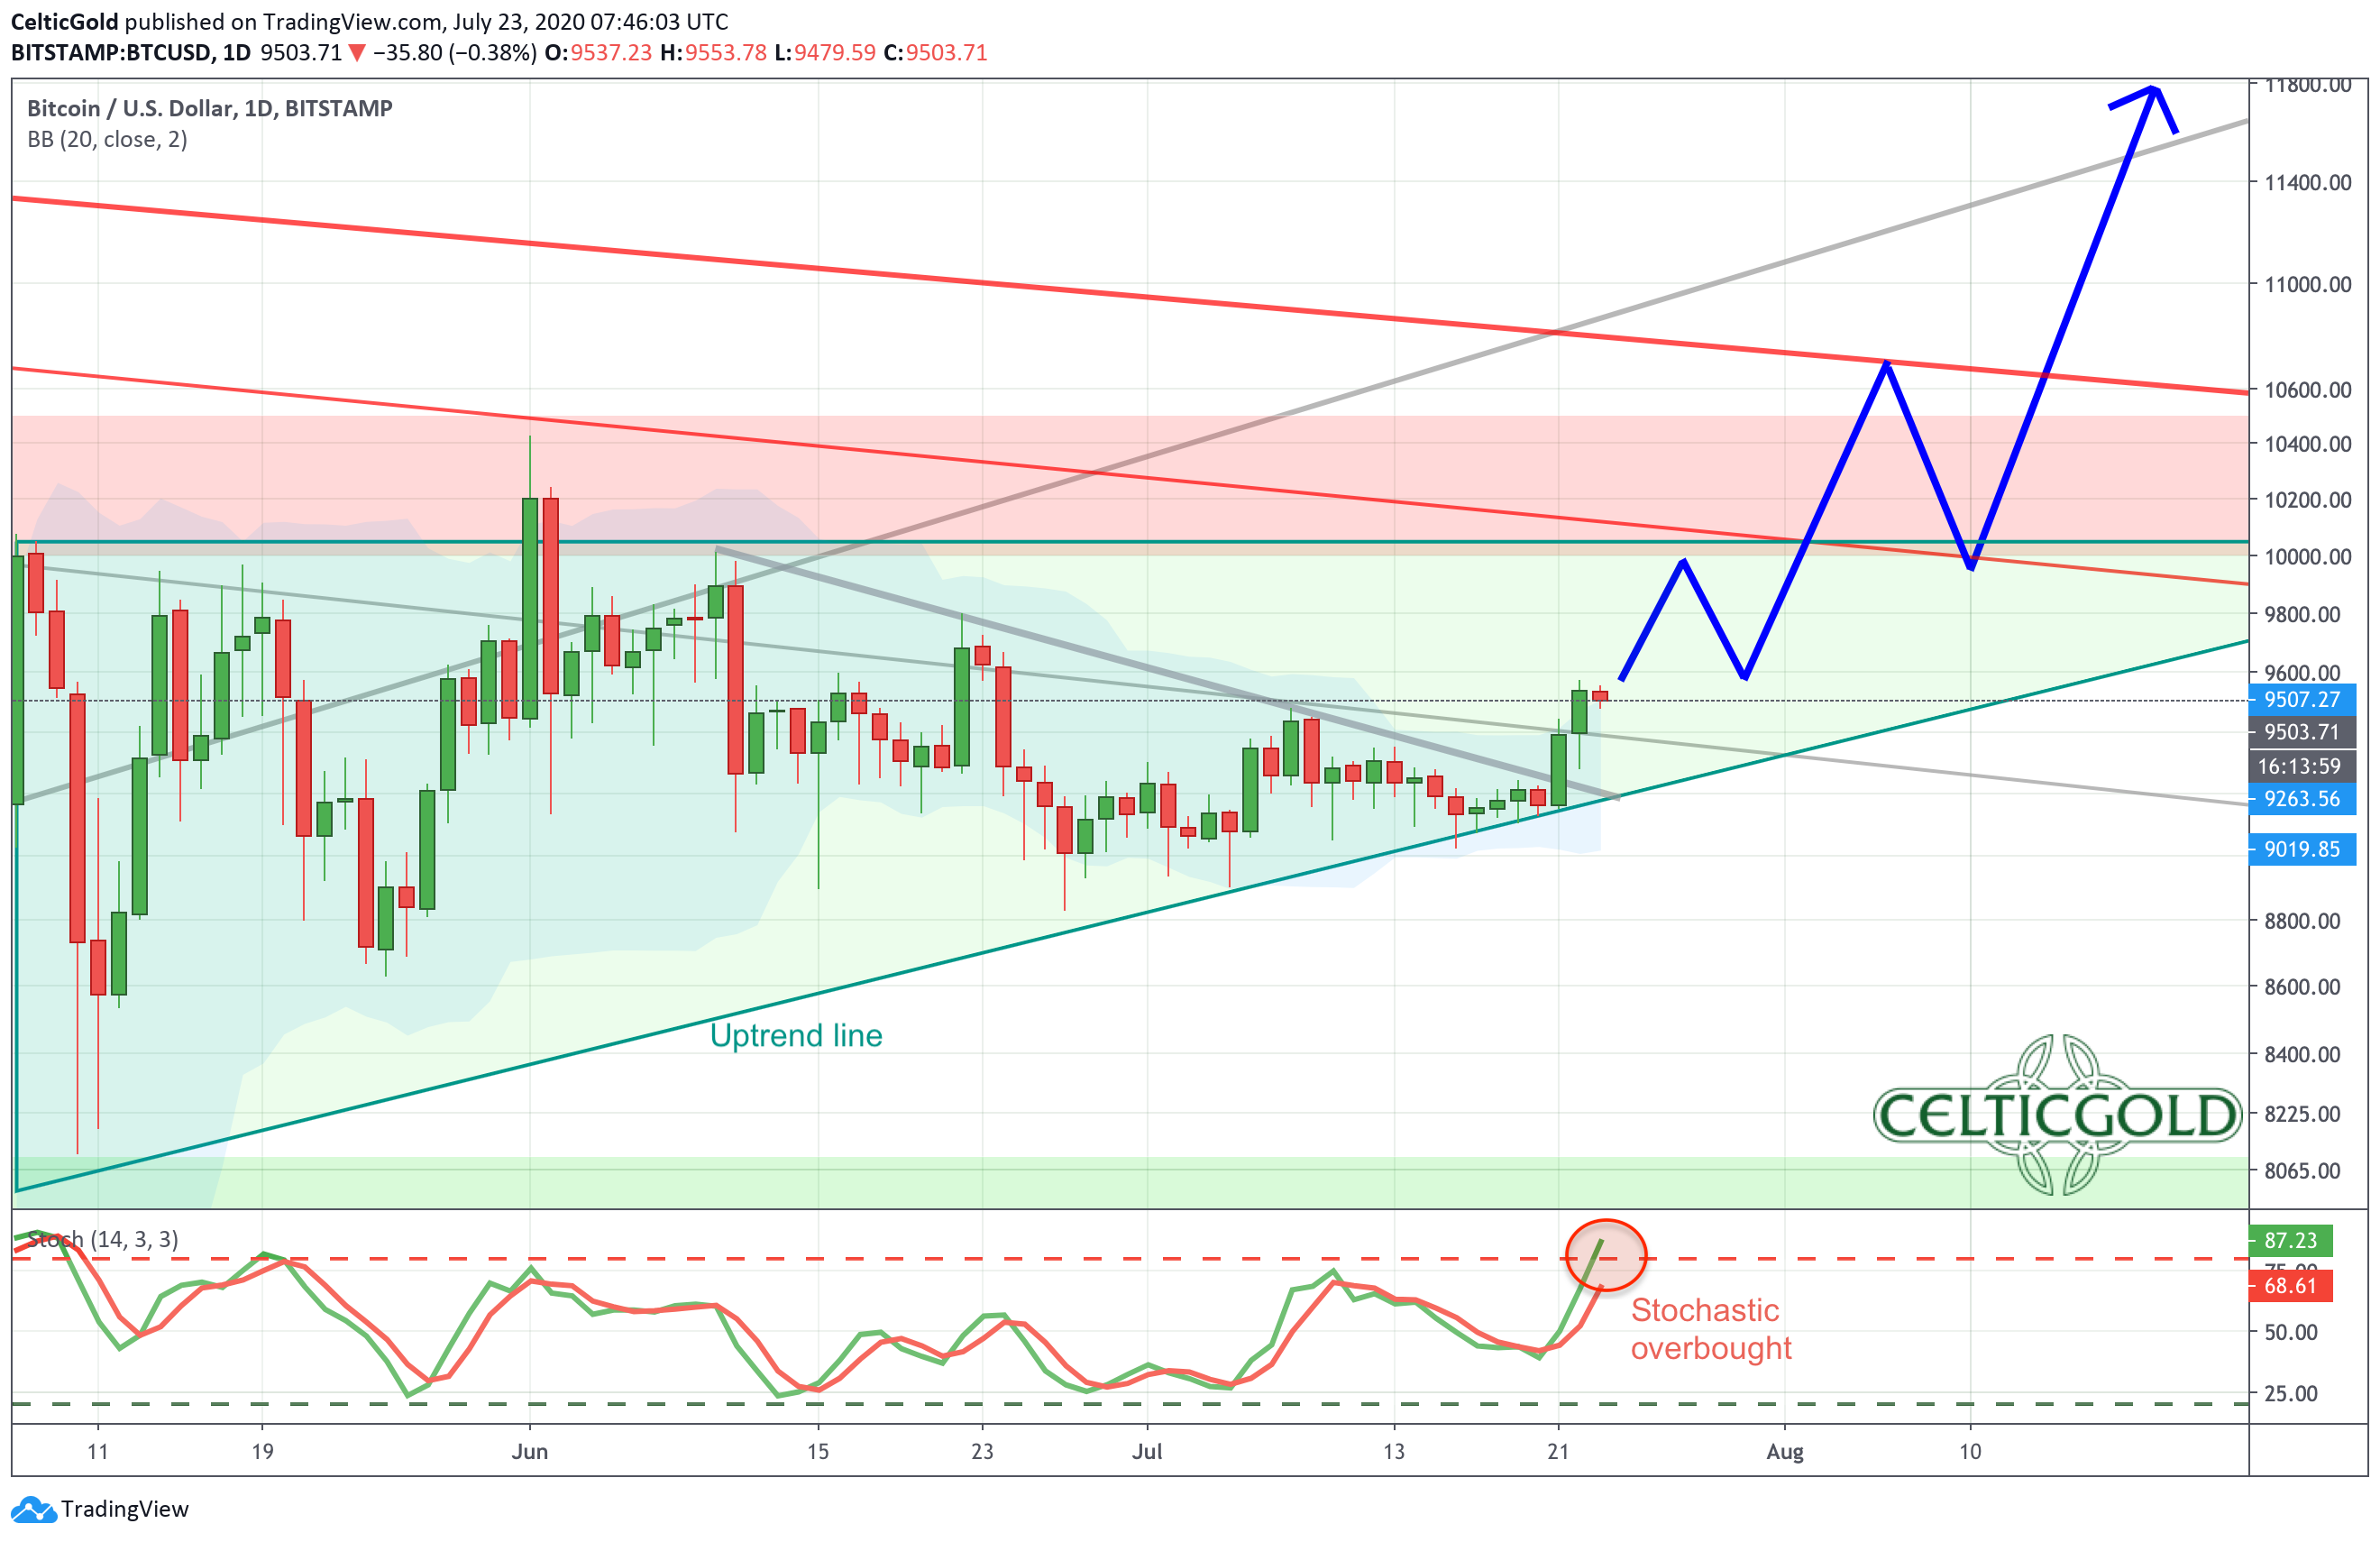
On the daily chart, Bitcoin prices have been moving up slowly and slowly in recent weeks. However, the upward-trend line resp. the lower edge of the rising triangle could be defended in the end. On Tuesday of this week, the bulls’ staying power was rewarded with a first somewhat larger green day candle. This brought the breakout above the downward-trend of the last weeks and was confirmed with another green candle on Wednesday. Hence, a rise to approx. 10.000 USD is expected now. Thereby, a little bit more momentum and speed in the market should gradually return.
On the other hand, the overbought Stochastic is not very favourable. The small breakout to the upside has obviously already taken quite a lot of strength. Not exactly ideal conditions for an explosive and above all larger rally on the upper side. Nevertheless, in the second step after reaching the USD 10,000 level and a further manageable setback, a rise to approx. USD 11,000 to 11,500 should be expected as early as August.
In conclusion, the daily chart is bullish. The breakout in the last few days provides a new buy-signal and lets expect prices in the range of approx. 10,000 USD for the time being. However, an upcoming bullish fireworks can not (yet) be deduced from the daily chart. Presumably, the trees will therefore not yet grow into the sky in the middle of summer.
Commitments of Traders Report For Bitcoin
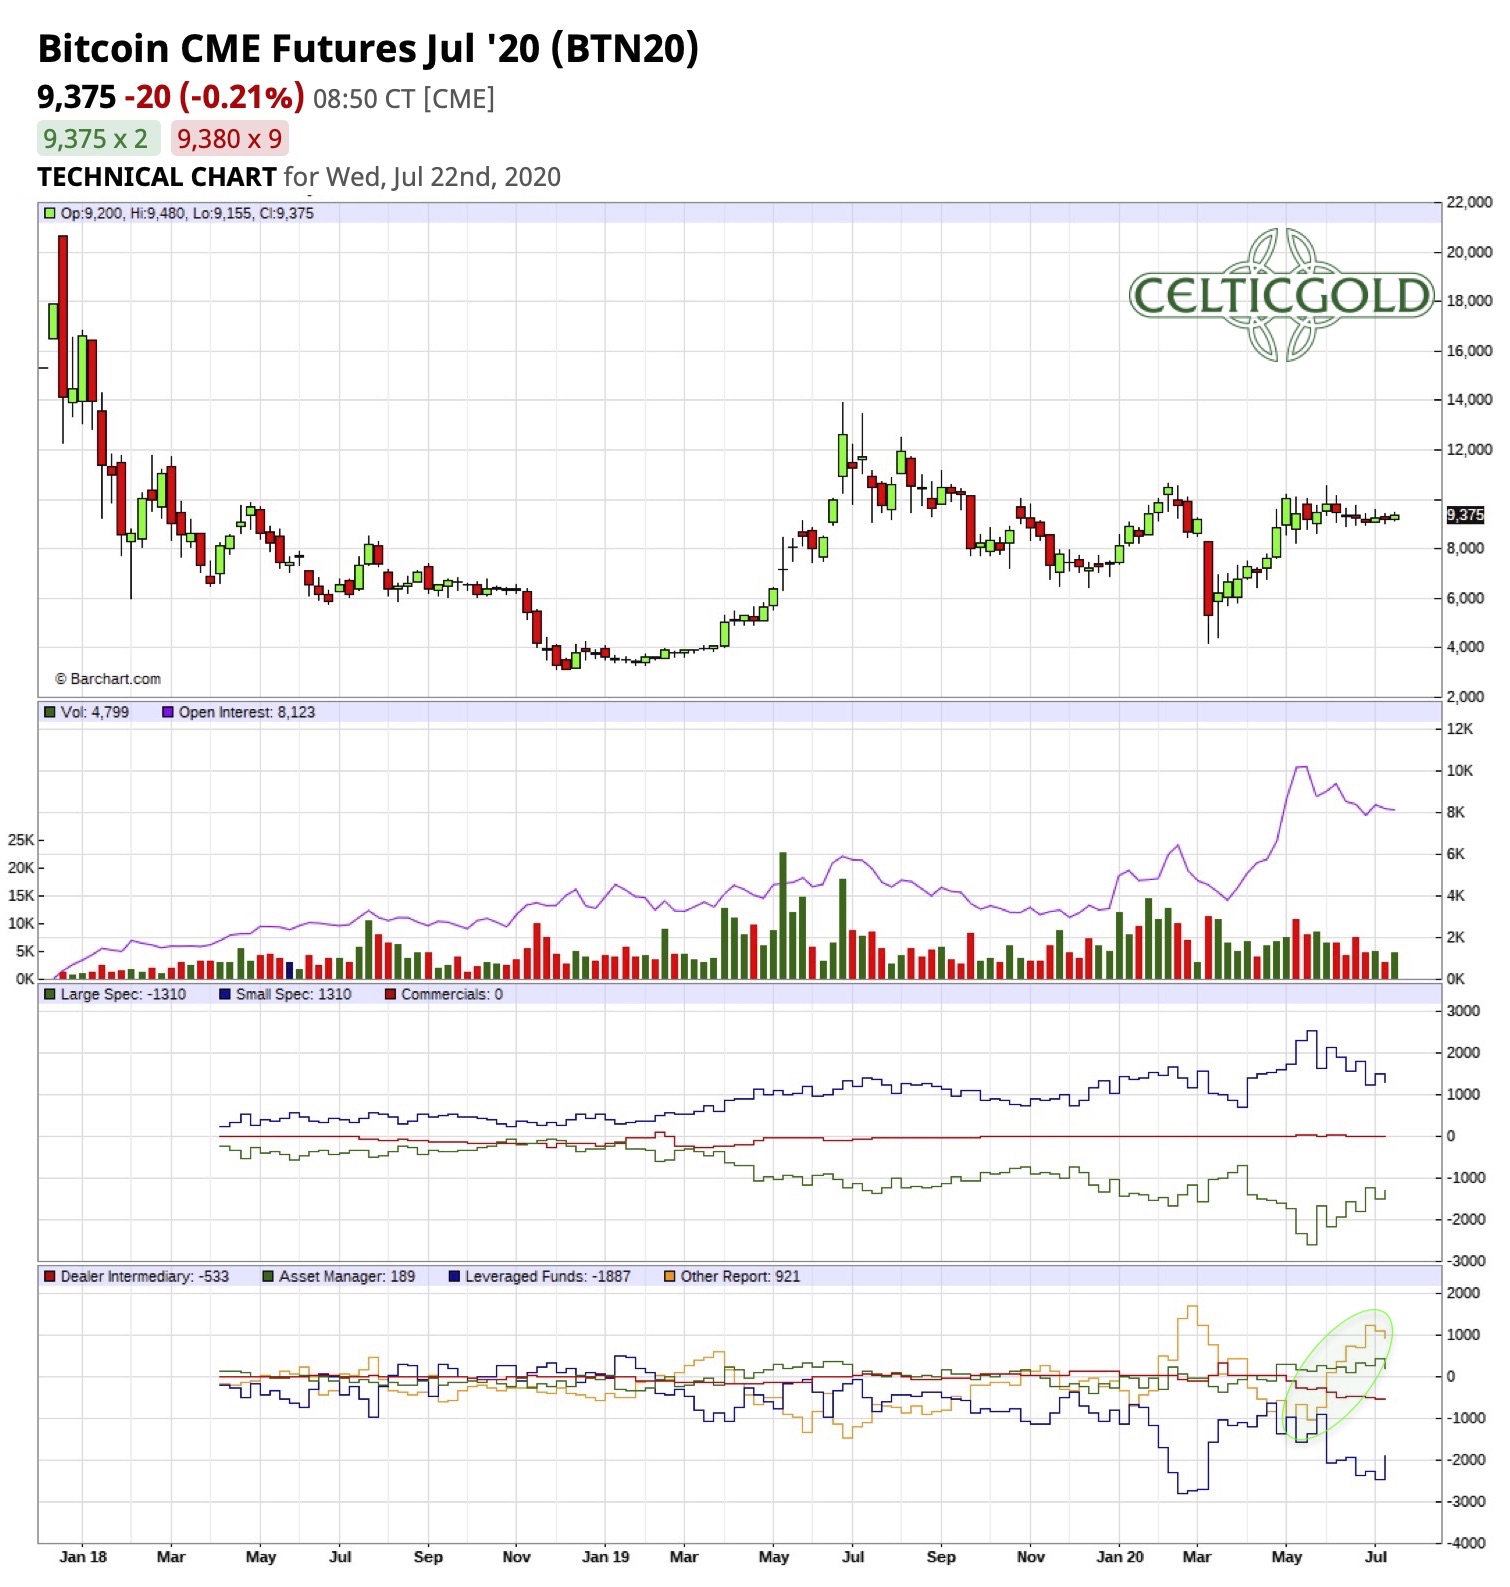
Although Bitcoin futures have only been trading since December 17th, 2017, the CoT report (Commitment of Trades), which is published every Friday evening, offers an interesting overview of the positions and is definitely a helpful tool to analyze the Bitcoin market. Note that the bitcoin future with the symbol XBT is trading at the CBOE, while the symbol BTC refers to the CME.
It is currently noticeable that the subgroup of so-called “Other Reportables” have changed from the short side to the long side since the beginning of May. In the past, the “Other Reportables” usually had a good hand and were positioned correctly and in time for major price increases. Leveraged funds, on the other hand, have positioned themselves even more strongly on the short side during the same period.
In summary, the current CoT Report provides rather neutral signals. However, since the “Other Reportables” have again clearly positioned themselves on the long side, the report overall has a bullish undertone.
Sentiment Bitcoin
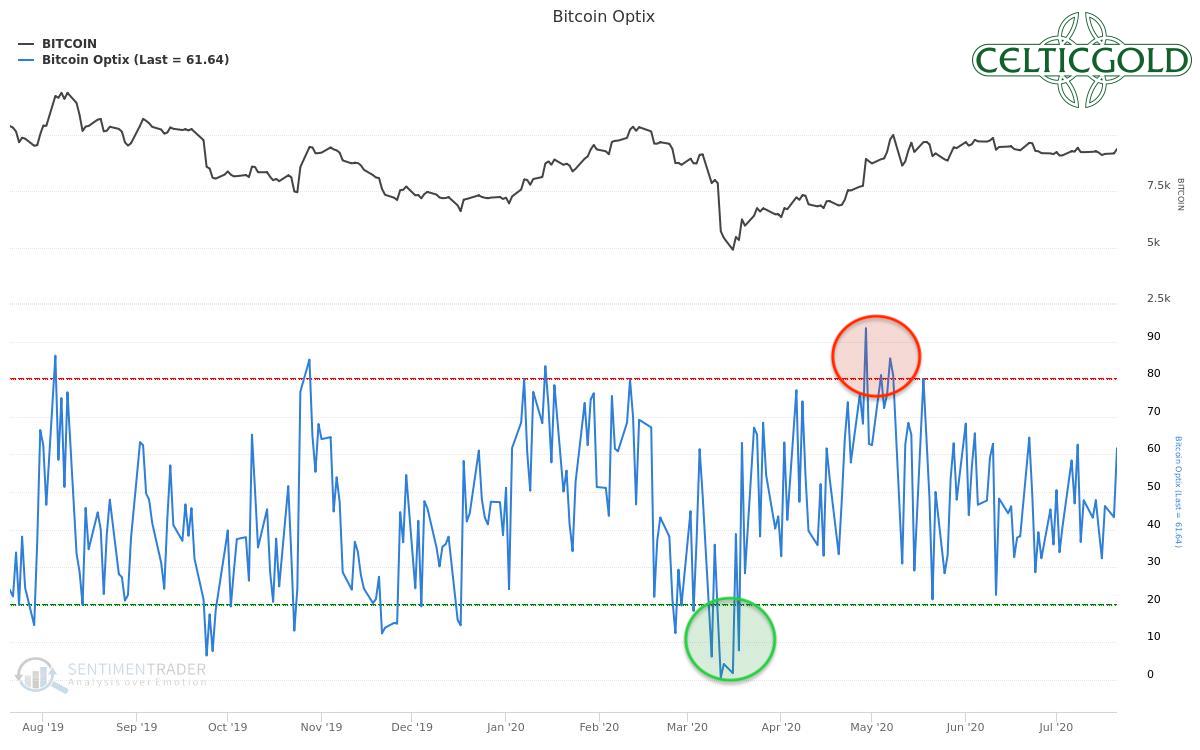
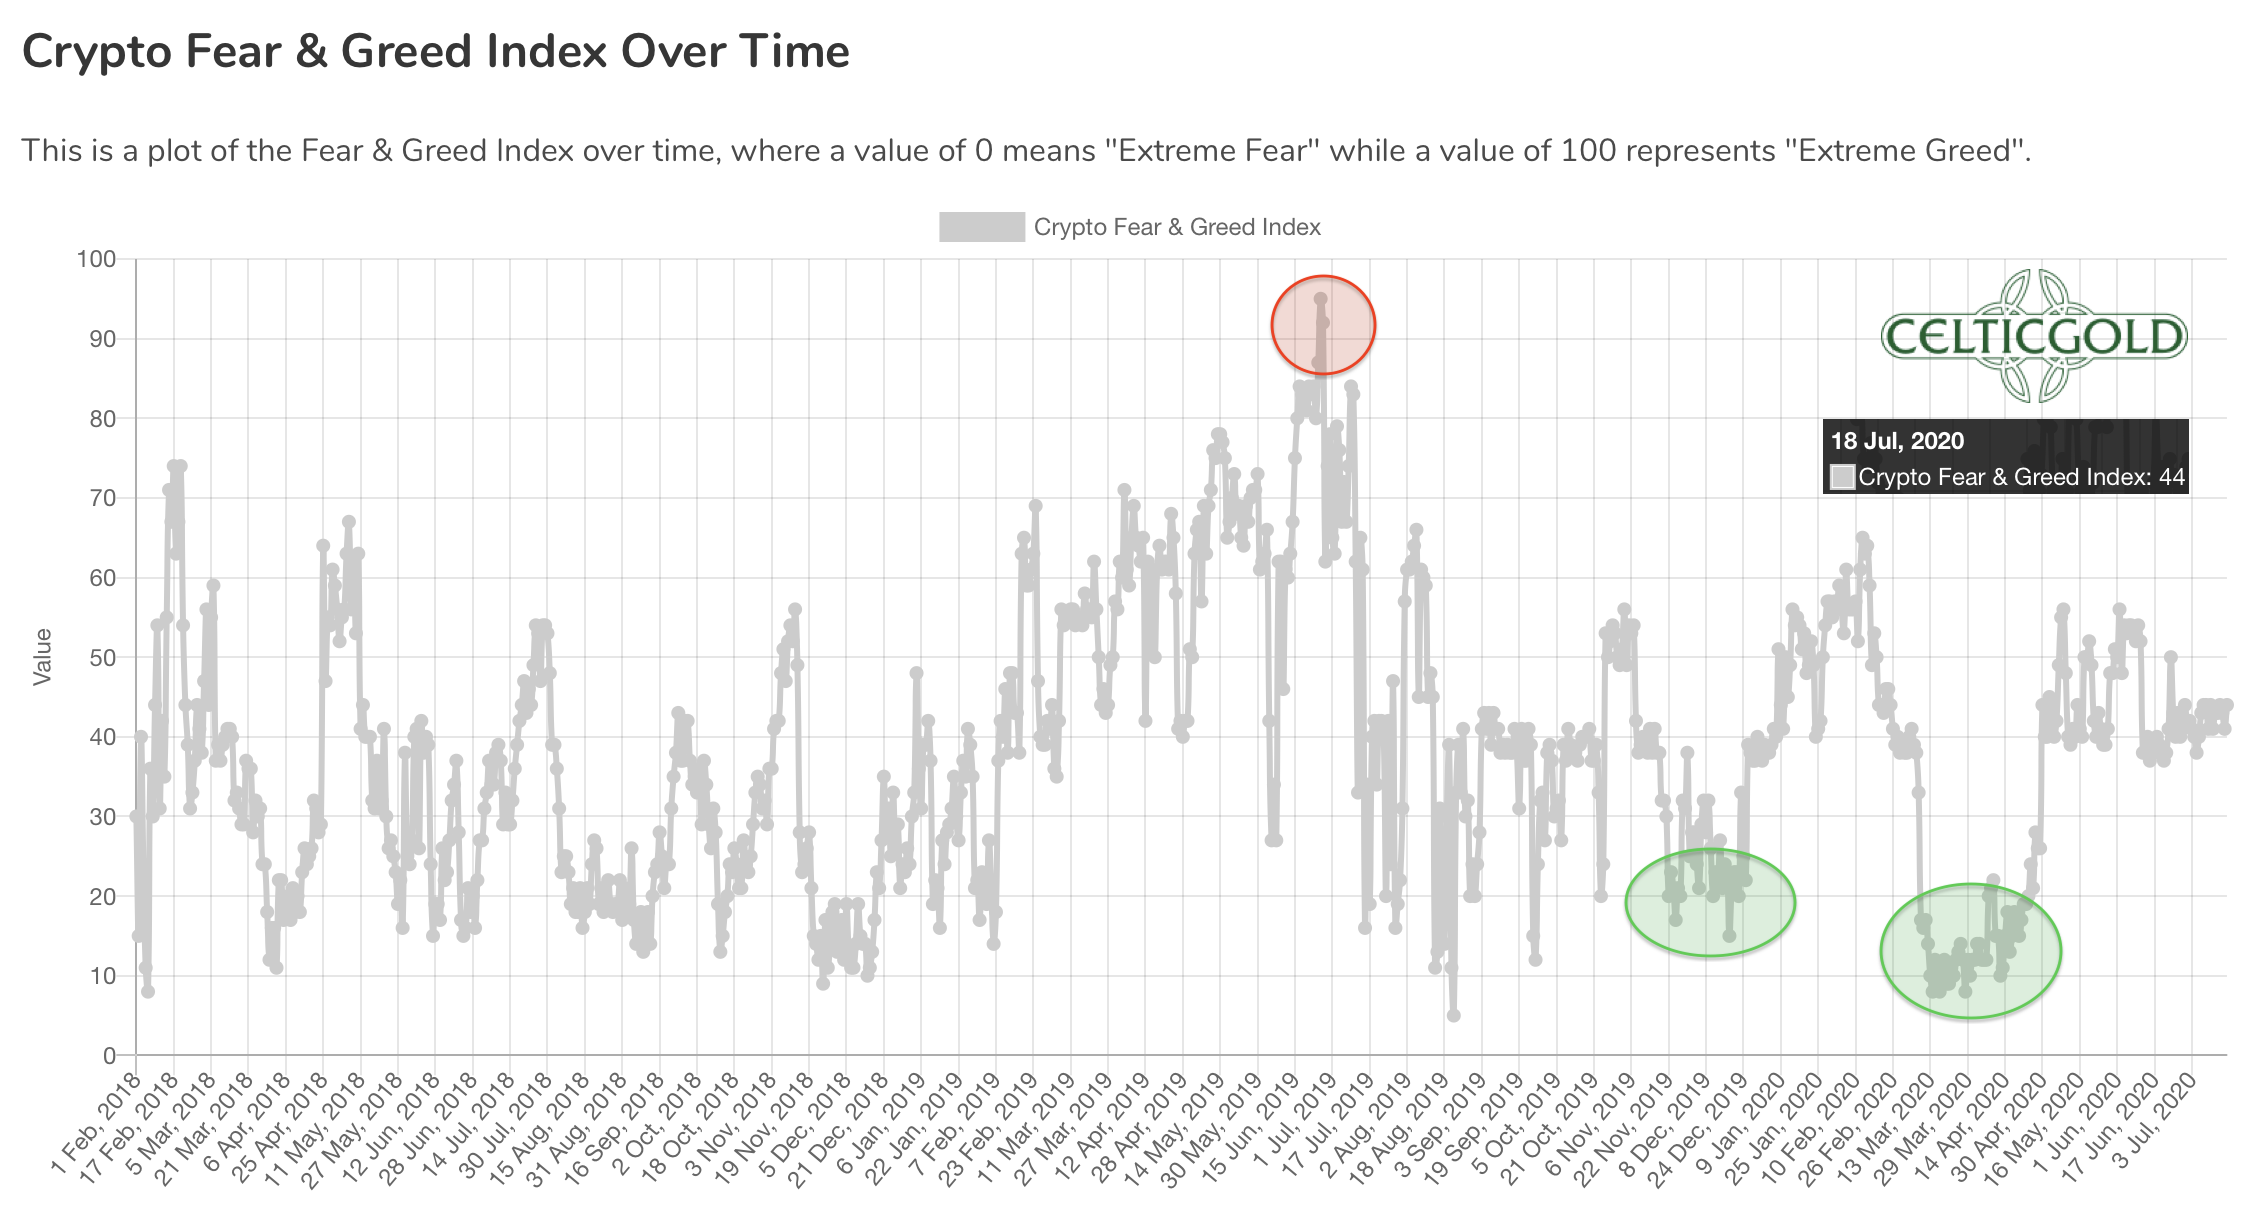
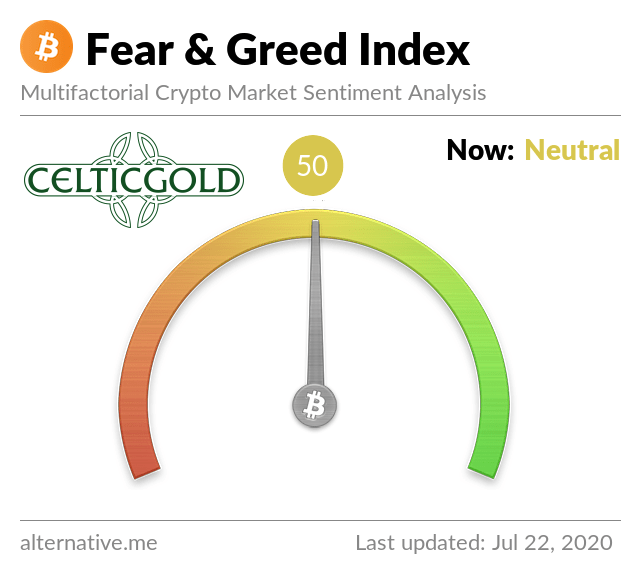
The current sentiment data point to a continued balanced or neutral mood among market participants. Neither the Bitcoin Optix of Sentimentrader nor the sophisticated “Fear & Greed Index” currently reports an extreme mood.
All in all, both bulls and bears are a bit exhausted after the tenacious eleven-week consolidation and will probably be glad when more movement and above all a trend comes back into the Bitcoin market. At the moment the sentiment is completely balanced and therefore neutral.
Seasonality Bitcoin – Next Attack On US$10,000
Bitcoin seasonality. Source: Seasonax
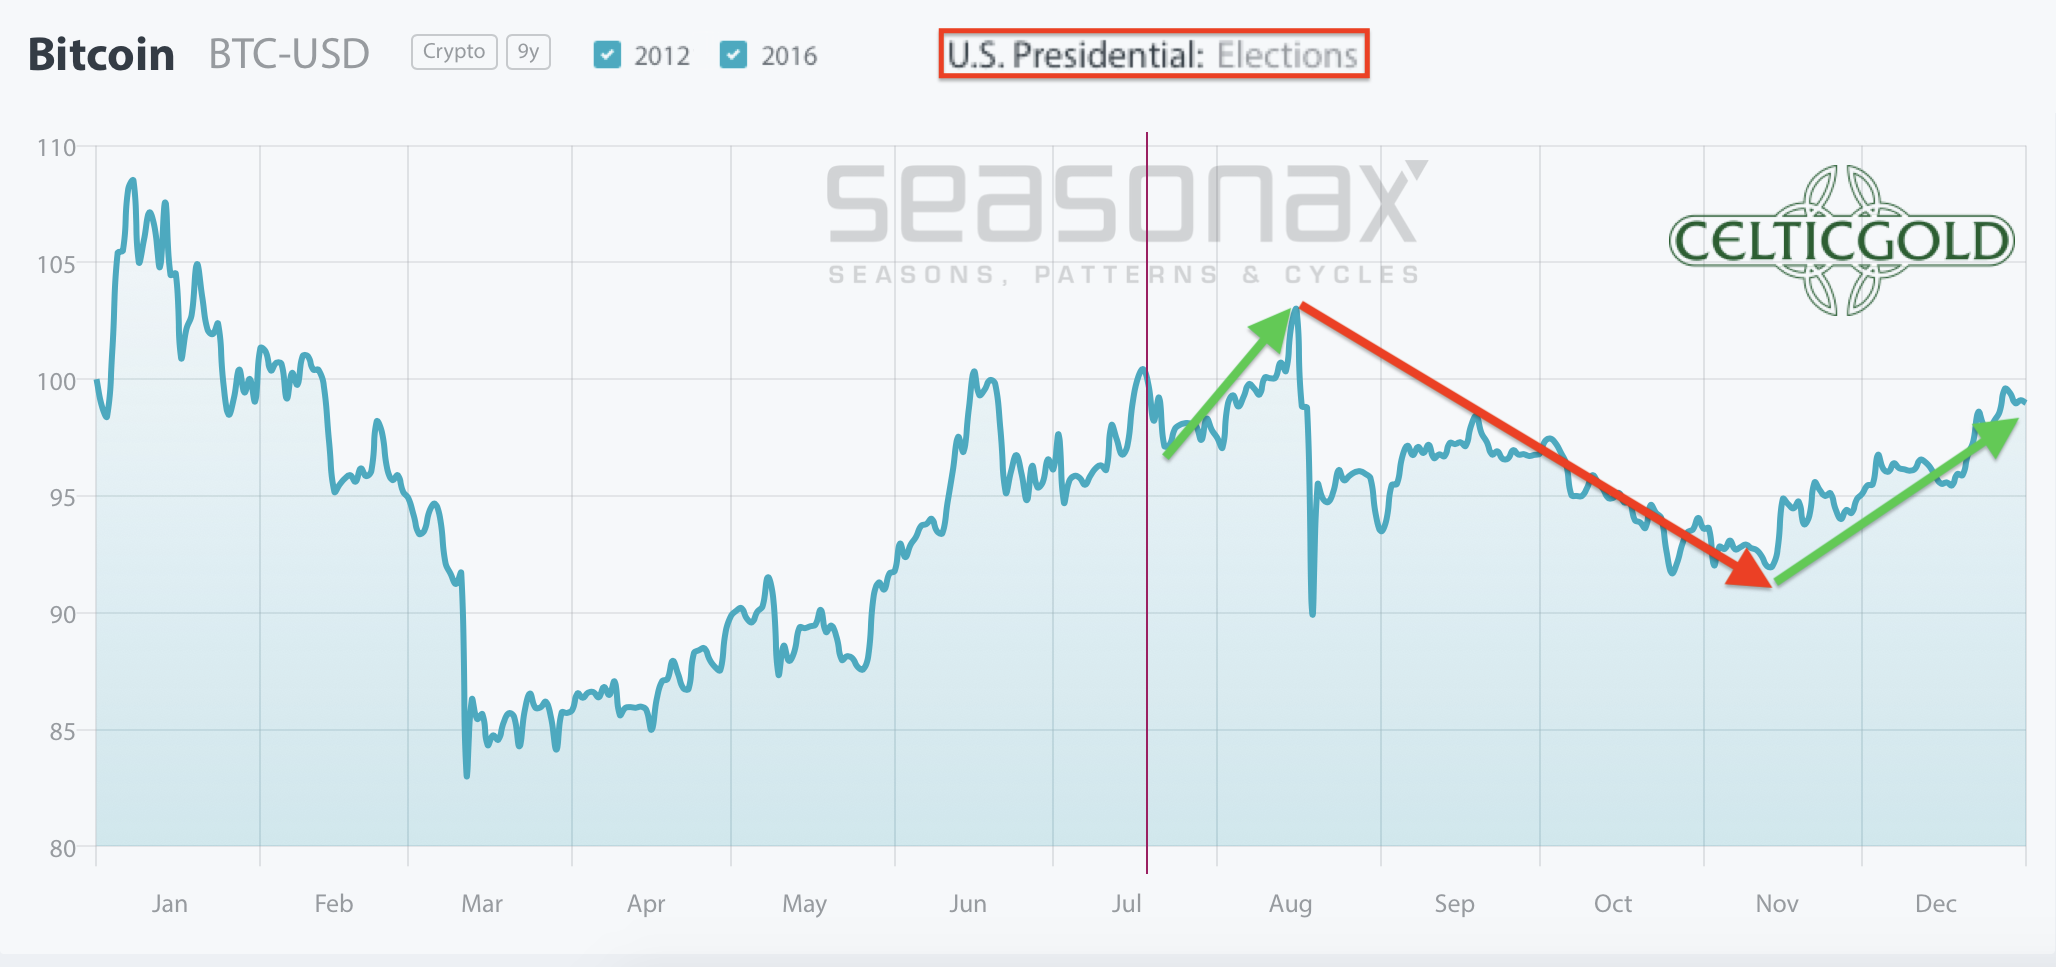
The presidential election in the United States on Tuesday, November 3, 2020 is likely to be the most important event in the second half of the year. The influence of the elections and especially of the already bitterly conducted election campaign is likely to increase from week to week. Even Bitcoin will not be able to completely escape this.
Unfortunately, there is only a minimal data series to analyze Bitcoin’s price behavior in US election years. Based on the price behavior in 2012 and 2016, no statistical probability can be derived yet.
However, if Bitcoin roughly follows this development in 2012 and 2016, a significant increase would initially be expected in the coming weeks, which could lead to significantly higher prices until about the mid of August. Subsequently, however, during the two and a half months leading up to the US election, Bitcoin is likely to correct strongly. Only in mid-November would the seasonal omens therefore turn sustainably green again.
Bitcoin against Gold
Sound Money Bitcoin/Gold-Ratio as of July 23rd, 2020. Source: Chaia
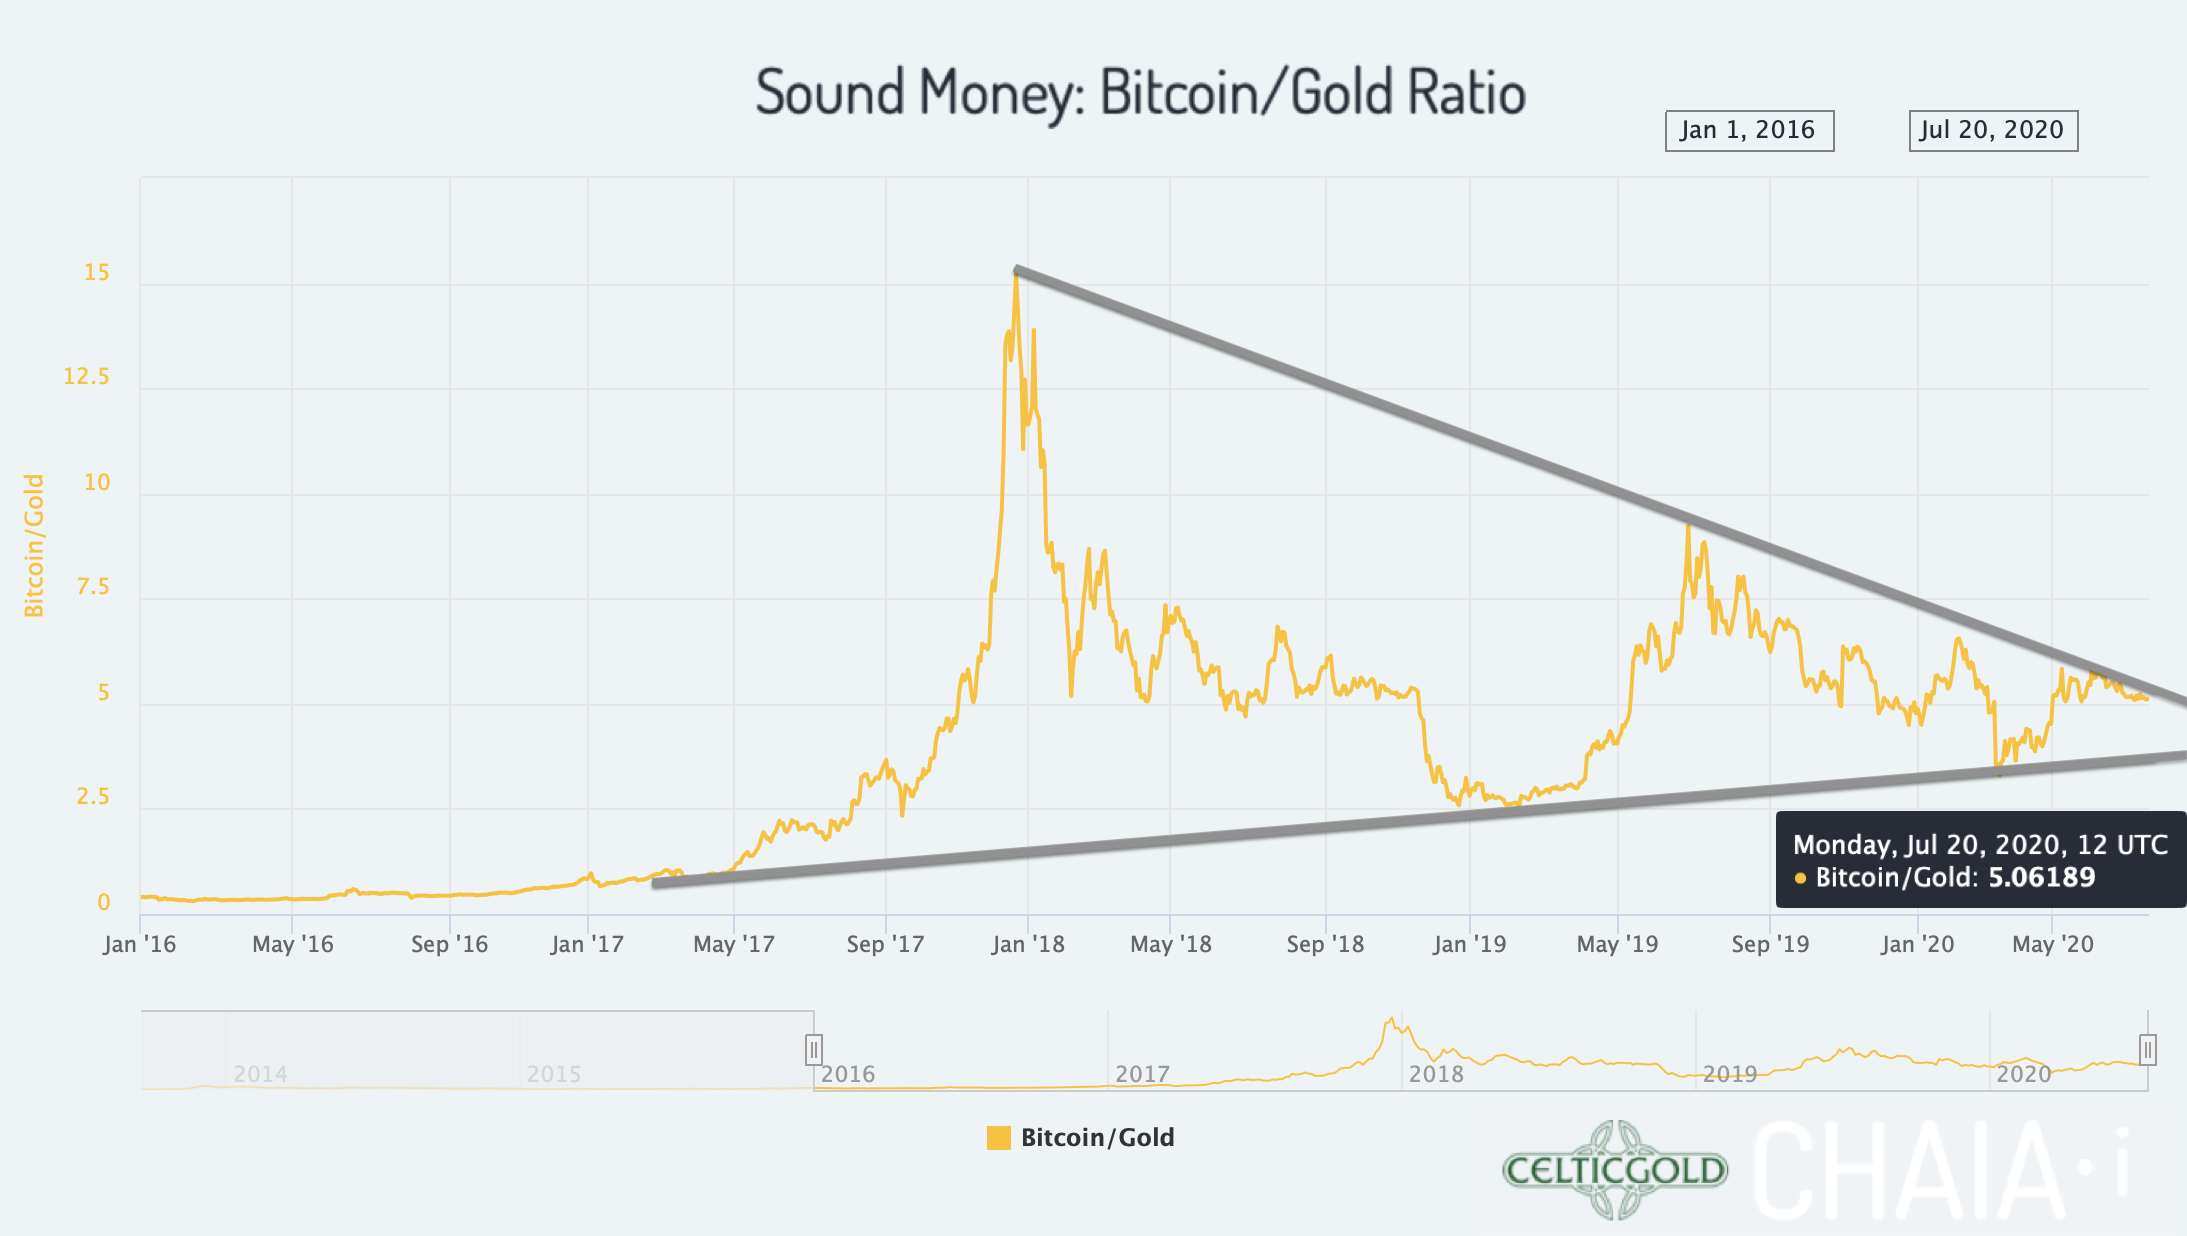
At prices of US$9,600 for one Bitcoin and US$1,900 for one troy ounce of gold, the Bitcoin/Gold ratio is currently 5.05. This means that you currently have to pay 5.05 ounces of gold for a Bitcoin. In other words, a troy ounce of gold currently costs 0.198 Bitcoin. Contrary to expectations, Bitcoin has still not broken out yet against gold, but is winding downwards along the upper edge of the two and a half year consolidation triangle. Hence, no decision has yet been made here.
Generally, buying and selling Bitcoin against gold only makes sense to the extent that one balances the allocation in the two asset classes! At least 10% but better 25% of one’s total assets should be invested in precious metals physically, while in cryptos and especially in Bitcoin one should hold at least between 1% and of 5%. If you are very familiar with cryptocurrencies and Bitcoin, you can certainly allocate higher percentages to Bitcoin on an individual basis. For the average investor, who is normally also invested in equities and real estate, 5% in the highly speculative and highly volatile Bitcoin is already a lot!
Opposites compliment. In our dualistic world of Yin and Yang, body and mind, up and down, warm and cold, we are bound by the necessary attraction of opposites. In this sense you can view gold and bitcoin as such a pair of strength. With the physical component of gold and the digital aspect of bitcoin you have a complimentary unit of a true safe haven for the 21st century. You want to own both! – Florian Grummes
Conclusion: Bitcoin – Next Attack On US$10,000
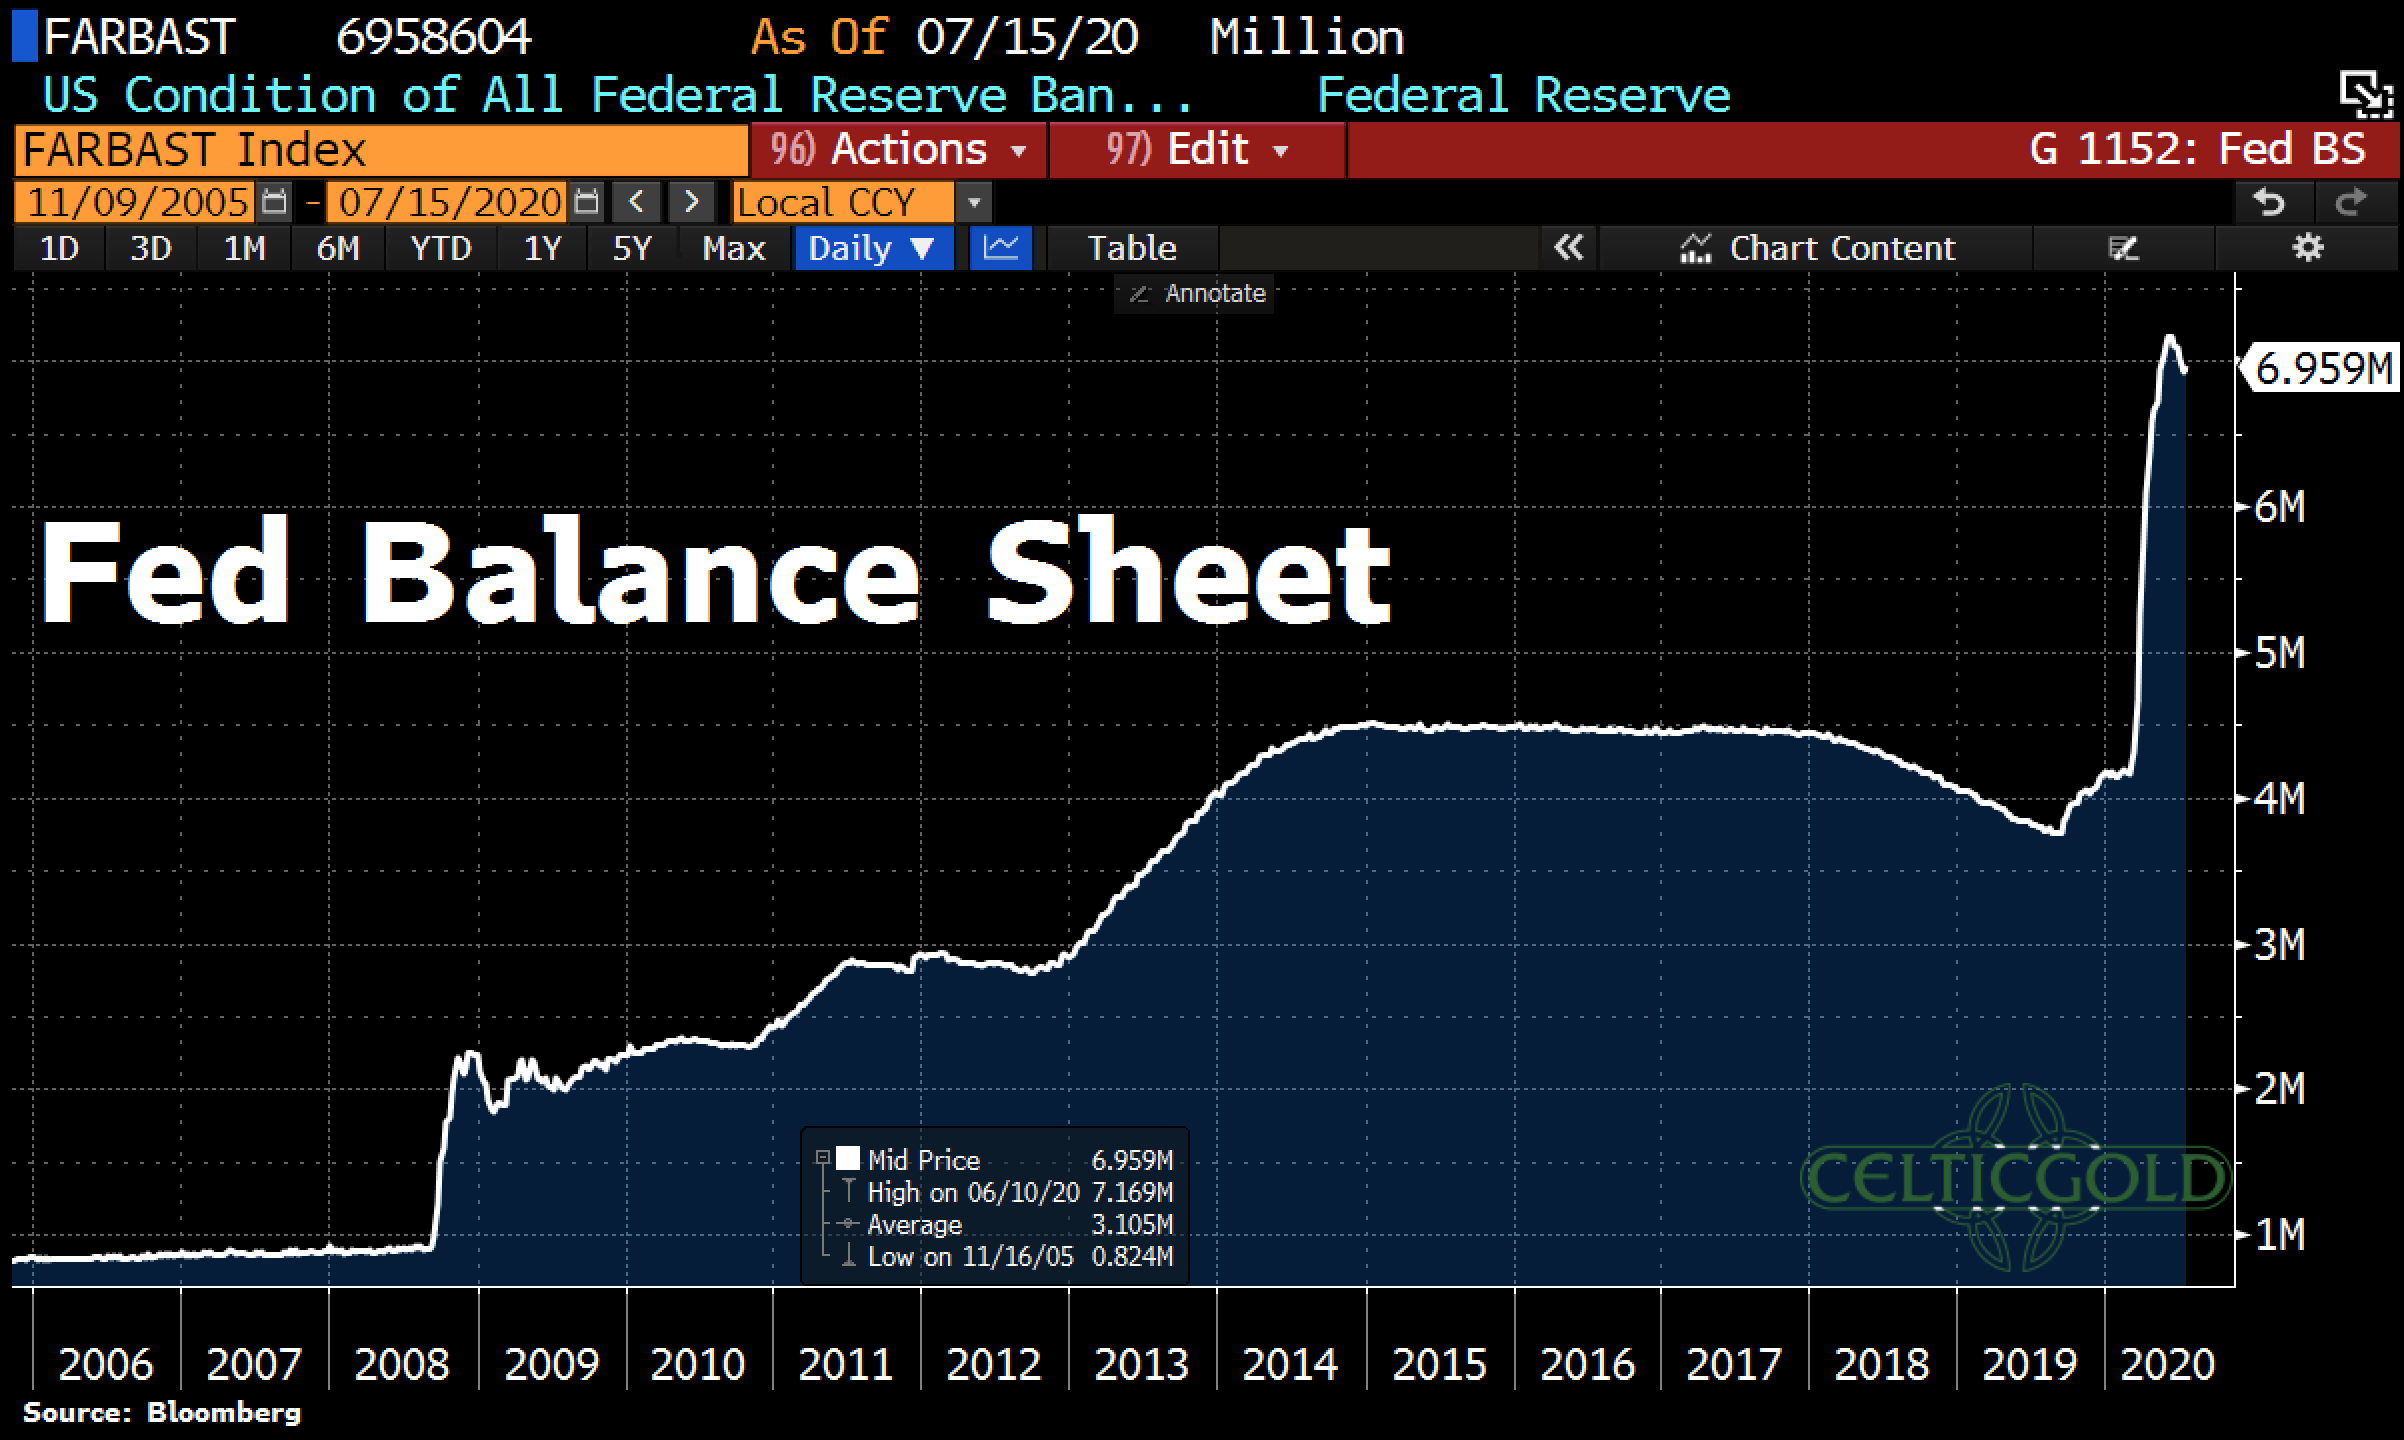
Even though the FED has taken a little break in recent weeks, central bankers around the world are ensuring that the crack-up boom continues. What else can they do? If they stop the expansion of money supply, all economies worldwide will implode and humanity will quickly find itself back at the level of the 1970s. Accordingly, the ECB pumps an average of between 20 and 30 billion euros into the markets every week. The Fed in the USA recently increased its balance sheet total by US$38 billion to just under US$700 trillion!
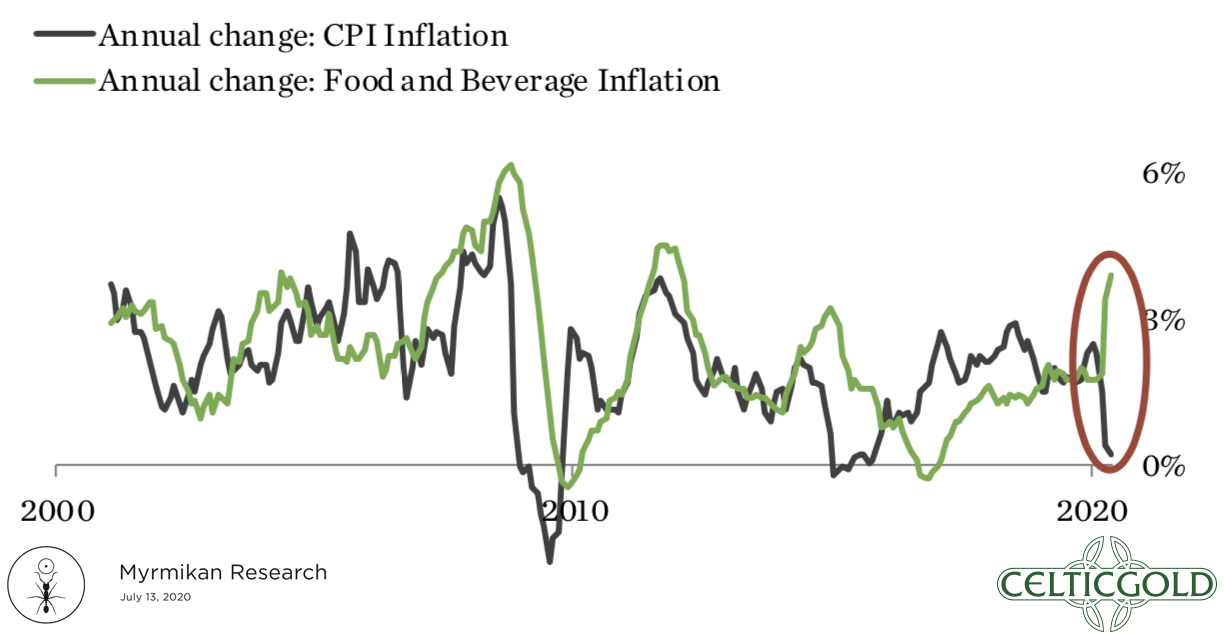
The consequences of this “whatever it takes” policy are now also visible in the first inflation statistics. The ECB’s money printing in conjunction with the corona restrictions led to rising prices in Germany in June, in some cases even significantly. Prices for food (+4.4%), alcoholic beverages (+3.9%) and especially fruit (+11.1%) and meat (+8.2%) rose significantly. Prices for restaurants and hotels also rose by 2.1%. All in all, the consumer price index or the official inflation rate in June, based on the embellished shopping baskets, rose by 0.9% year-on-year (June 2019) and 0.6% month-on-month (May 2020). Food prices are also rising significantly in the USA.
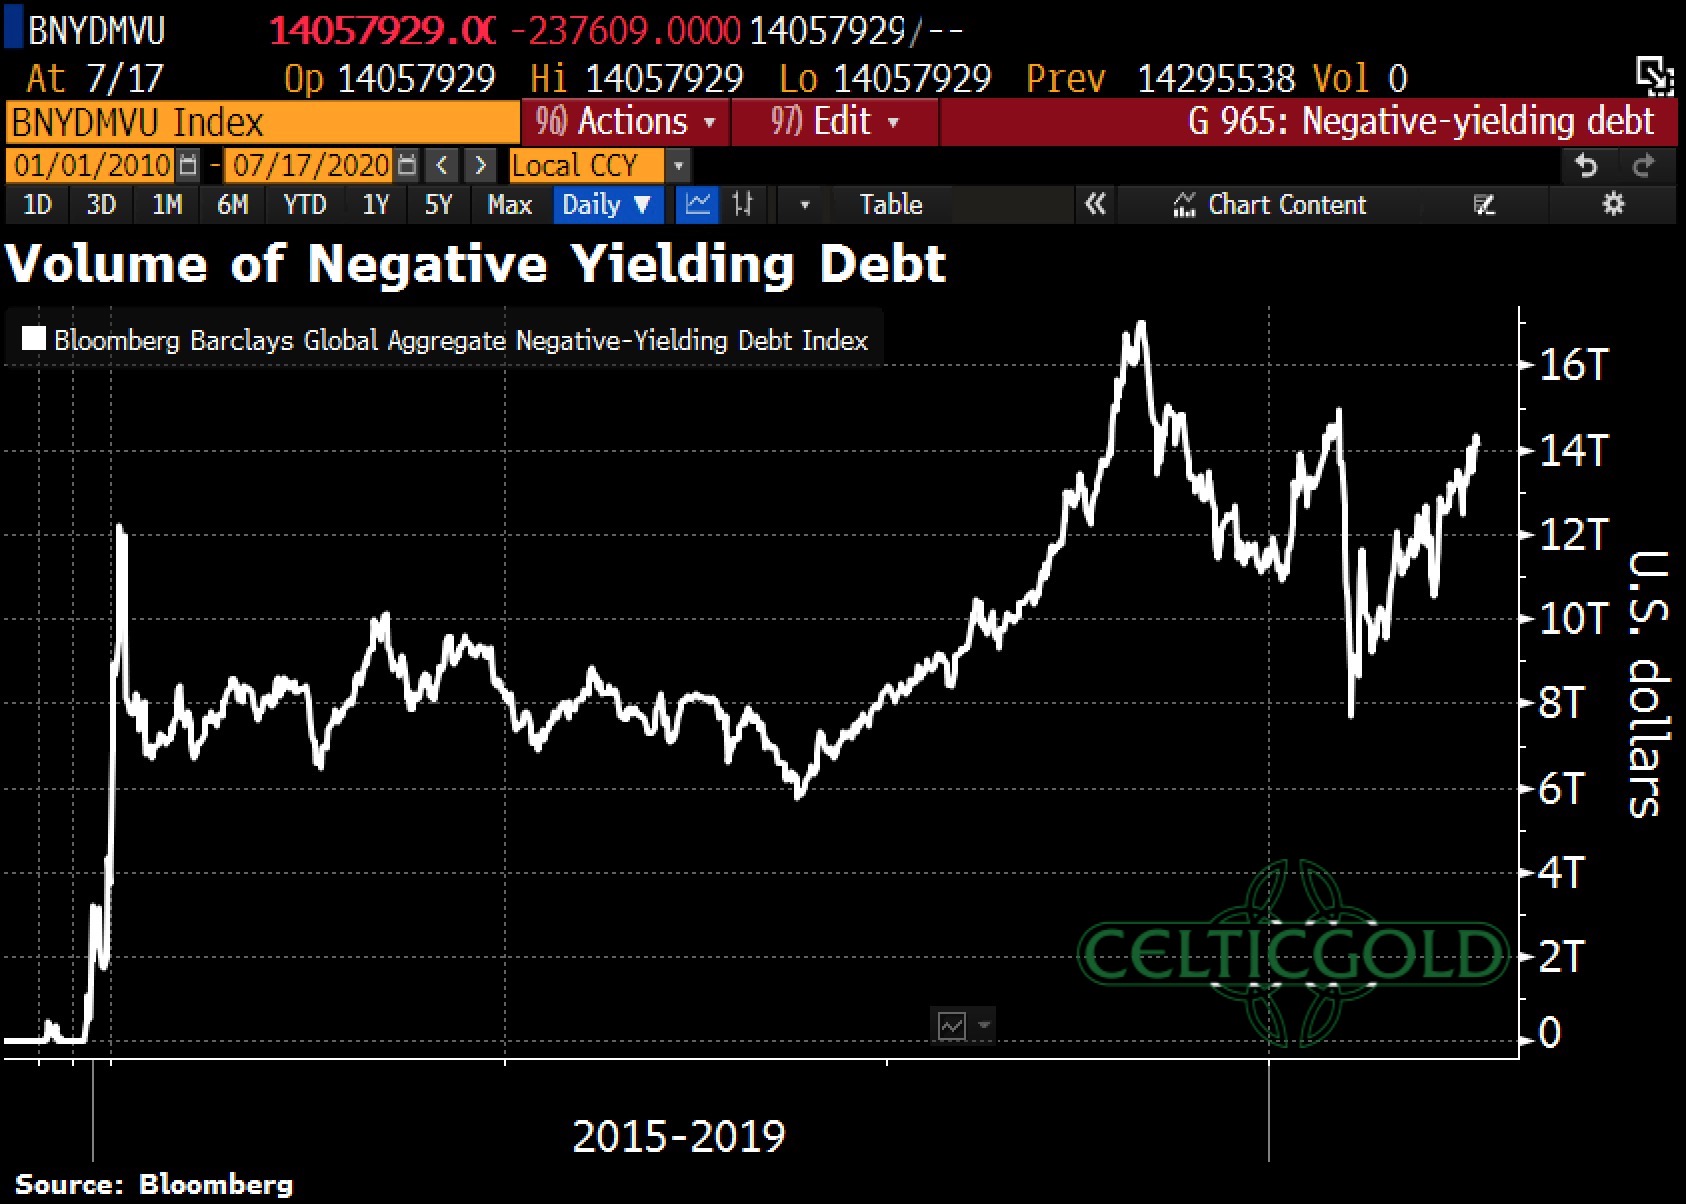
At the same time, the total of negative-interest bonds worldwide has risen significantly again since the Corona crash and currently stands at over US$7.7 trillion.
Since Bitcoin has clearly lagged behind the stock markets and especially the precious metals in recent weeks, there is a lot of catch-up potential in connection with the constant expansion of the money supply. Moreover, since precious metals are probably facing an important interim high, a kind of “regime change” could be imminent in the coming weeks. Speculative money in search of yield could temporarily flow from the precious metals into Bitcoin.
In any case, in terms of charts everything is set for a rise to US$10,000. Beyond that, by mid summer, an increase to around US$11,000 could be expected. Before the US elections, however, Bitcoin is unlikely to experience a price explosion. Unexpectedly weak prices below US$9,000 and US$8,500, and especially below US$7,500, would offer another very good buying opportunity. However, it is very unlikely that such a pullback will occur again, given the intact trend situation.


