


Bitcoin or bonds
When you overhear conversations about Bitcoin, you most of the time find a critique. The new has always been rejected, but next time you find yourself in a conversation like this, ask the critic about his or her wealth preservation solution. The answer will usually be “silence”. There are doers, and there are critics. It is easy to be a critic, but it takes effort to be a doer. And here is where the rubber meets the road since Bitcoin does require work. Understanding it, acquiring it, trusting in it needs work – a lot of work. And that is where the difference lies. It is the doers who more likely make money over the critics. Bitcoin or bonds.
One of the bigger doers is Ray Dalio. A principle-based manager of people and money with US$140 billion under management in his company Bridgewater Associates. Dario recently stated that he’d rather own Bitcoin than bonds. Do we need to say more?
US Government Bonds 30Year Yield in USD, Monthly Chart, Where is it heading?
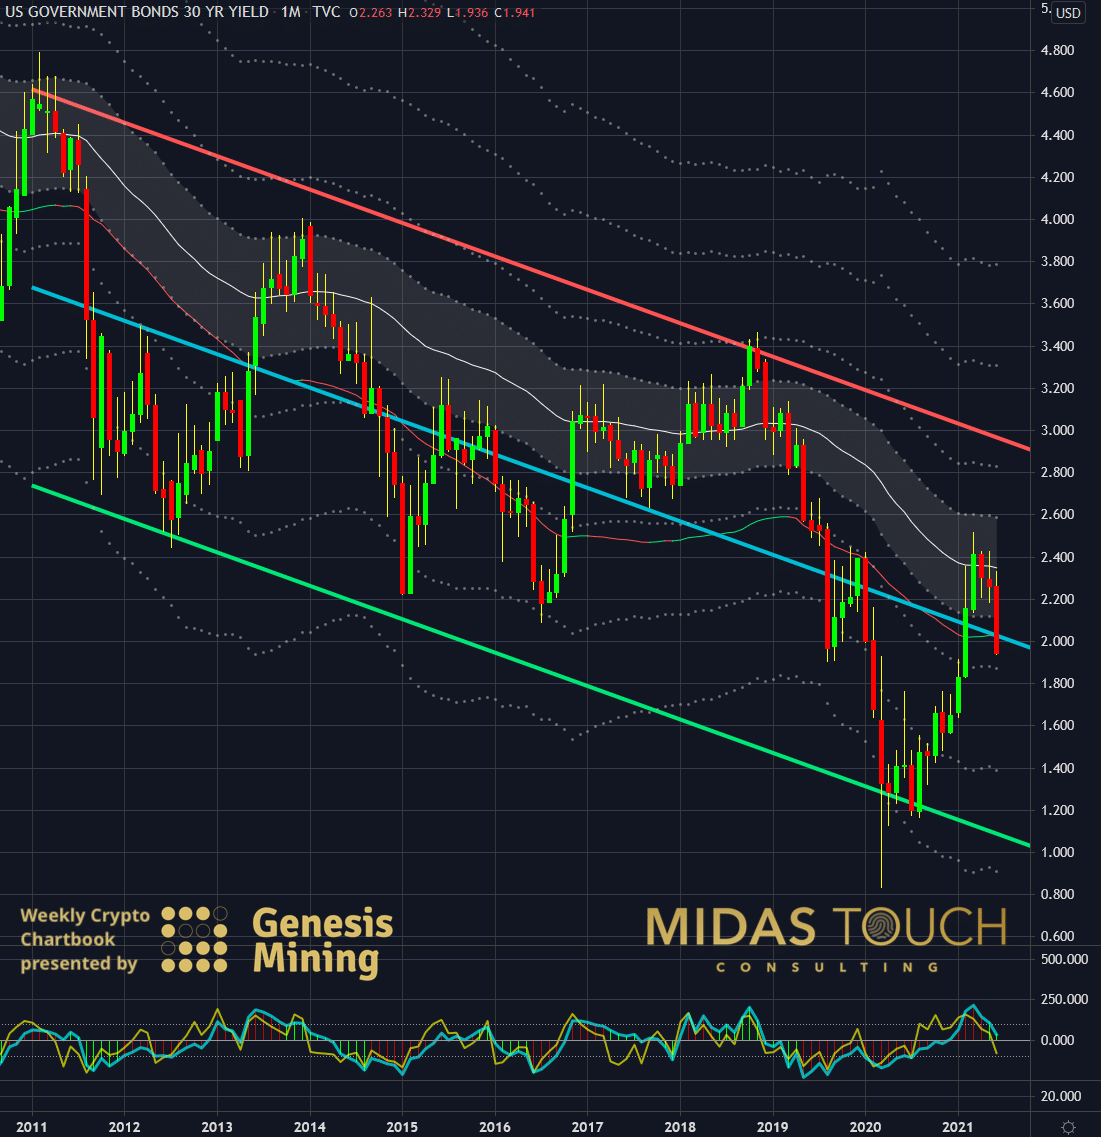
US Government Bonds 30YR Yield in US-Dollar, monthly chart as of June 21st, 2021.
A glance at the 30-year bonds over the last ten years shows a clear downtrend. We used a linear regression channel to illustrate this price decline. In 1987 bonds were trading at US$10 and have been declining ever since.
BTC-USD, Monthly Chart, Strong up-thrusts:
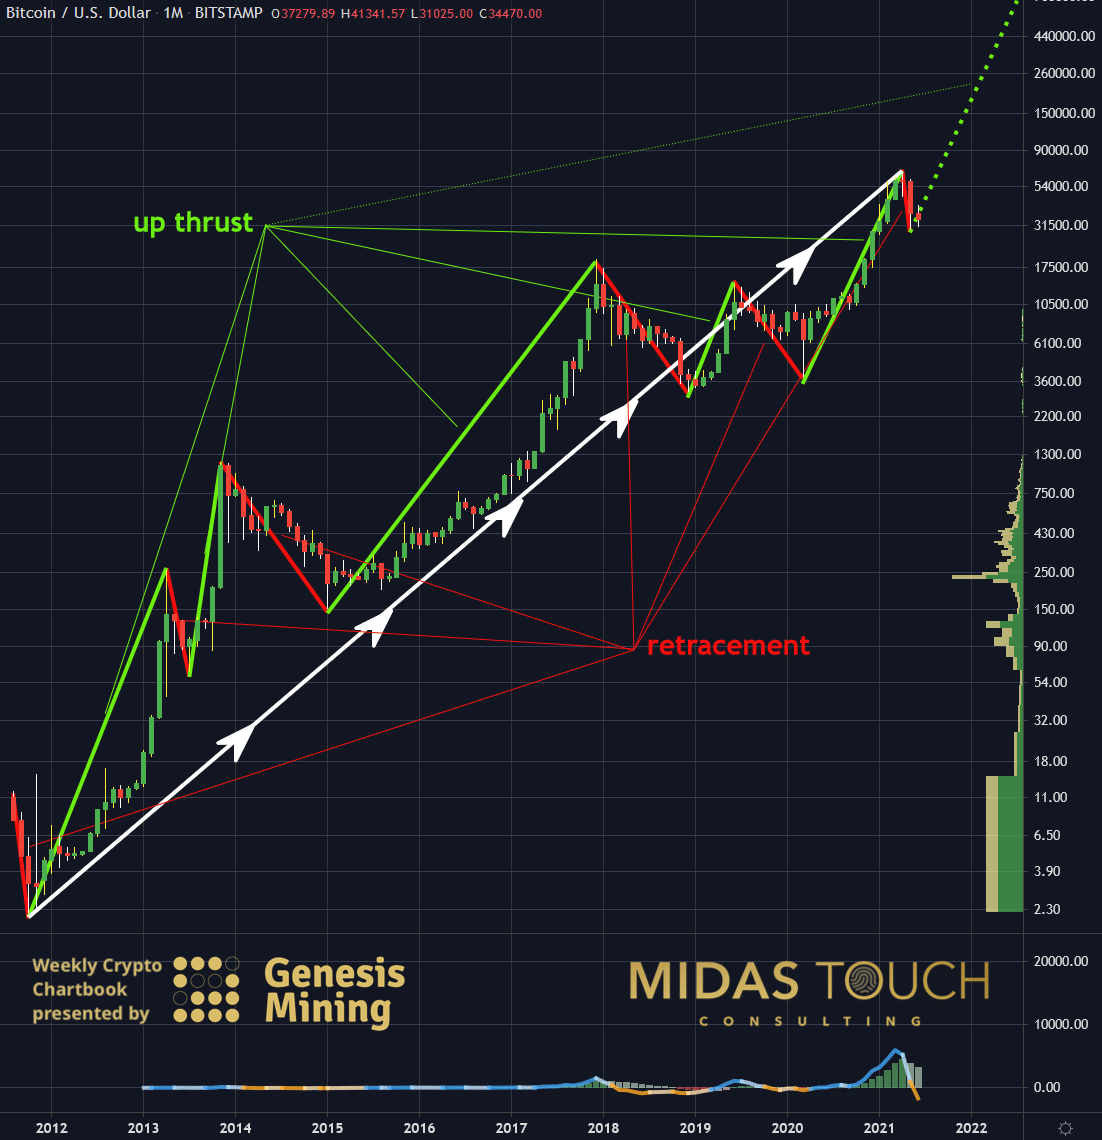
Bitcoin in US-Dollar, monthly chart as of June 21st, 2021.
A logarithmic representation of Bitcoin, on the other hand, over the same time span shows a continuous up movement. But that isn’t all. One of Bitcoin’s characteristic patterns is its strong up thrusts after retracements. This represents very favorable risk/reward-ratios, and eyeballing the figure scale to the right gives you an idea of the potential percentages of these up thrust gains. Thus, we find the recent retracement to be an invitation to participate in this market with low risk and, for the first time, ample confirmations from leaders on Wall Street.
BTC-USD, Daily Chart, One or the other:
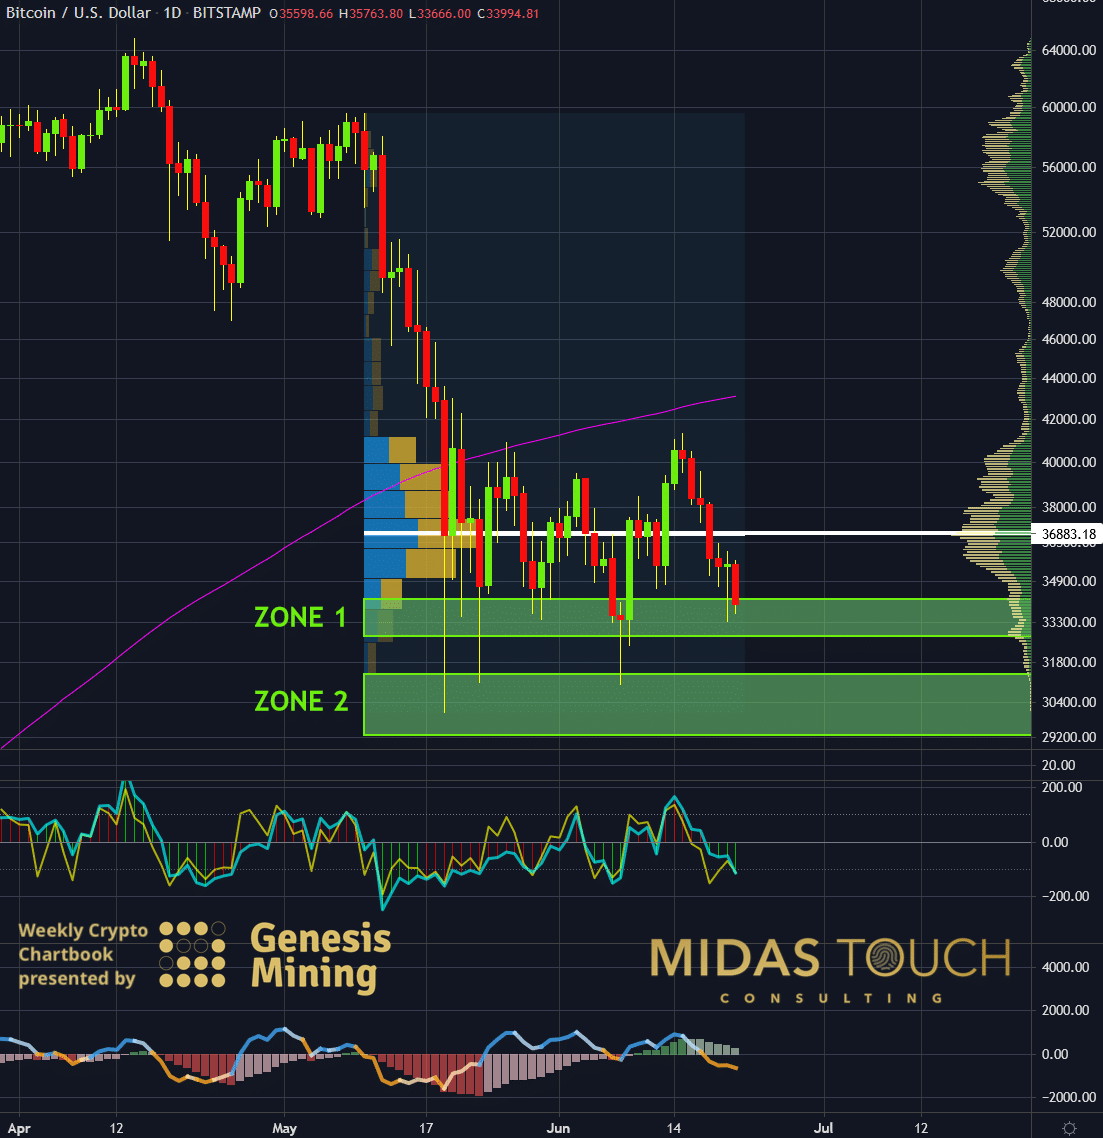
Bitcoin in US-Dollar, daily chart as of June 21st, 2021.
With prices moving away from POC (point of the control-white horizontal line), the rubber band gets stretched in this sideways zone of Bitcoin. The daily chart shows that two support zones are of interest to us, and we are posting our low risk entry attempts live in our free Telegram channel. Prices have just entered zone 1, and we positioned ourselves. Should this support fail to draw prices back to the US$38,800 price region (and beyond), we will again be aggressive buyers in zone 2.
Bitcoin or bonds:
The core problem is leverage. If you are well off, you have earned a level of comfort that provides little incentive to do the work it takes to familiarizes yourself with Bitcoin. The fact is that we are at an inflection point in history where a wealth transfer might be in process that leaves those reluctant to educate themselves out and diminishes their prosperity holdings. We do not share the belief in scarcity motivations. Still, We want to encourage you to consider that the recent increase of prominent players in the financial world stacking up on Bitcoin or, better said, getting public with their beliefs about Bitcoin after they stacked up might be the last time before this rocket is off to the moon.
Consequently, this makes your wealth preservation much more expensive in the not too far distant future. As such, pulling up one’s sleeves to gain some more in-depth knowledge might result in data of what the fuss is all about. Thus, in our humble opinion, it is a strategically smart move.
Feel free to join us in our free Telegram channel for daily real time data and a great community.
If you like to get regular updates on our gold model, precious metals and cryptocurrencies you can subscribe to our free newsletter.

