


Bitcoin, reinvent yourself
We recently got asked why we were super bullish in last week’s chart book, and now we align with the bears. It is this flexibility that’s required to align with the market and its behavior as a trader. Otherwise, the phenomenon that after you buy a blue car, you now seem to see ten times more blue cars in traffic than before your purchase might get a hold of you. A biased mind is deadly within the market observation, which requires a neutral mindset for correct perception. We need to reinvent ourselves every day when stepping up to the plate. Each market movement is unique, and only with the slate wiped clean, proper market play is possible. Bitcoin, reinvent yourself.
The weekly snapshot taking isn’t picked at random.
Each trade should have at least three timeframe components.
- A trade setup time frame where the edges get stacked, and risk/reward is determined, with targets and a stop level.
- A time frame higher than the setup timeframe, which needs to confirm trading direction. If you have a long entry set up on a daily chart, but the weekly chart has a downtrend of price, this setup is invalid and should therefore not be executed.
- And an entry time frame is the next lower time frame below the setup time frame, allowing for more precise entry timing and stacking odds to minimize risk.
For example, suppose you are a position trader with a typical holding period of 2-4 weeks. In that case, you are looking for a trend on the weekly chart. Find a setup on a daily chart in the direction of that trend. And fine-tune the entry on the sixty-minute timeframe.
This makes the weekly chart a part of even the largest time frame market participants and day-traders should not ignore its trend, hence our choice for weekly publications.
BTC-USD, Monthly Chart, Monthly time frame for direction:
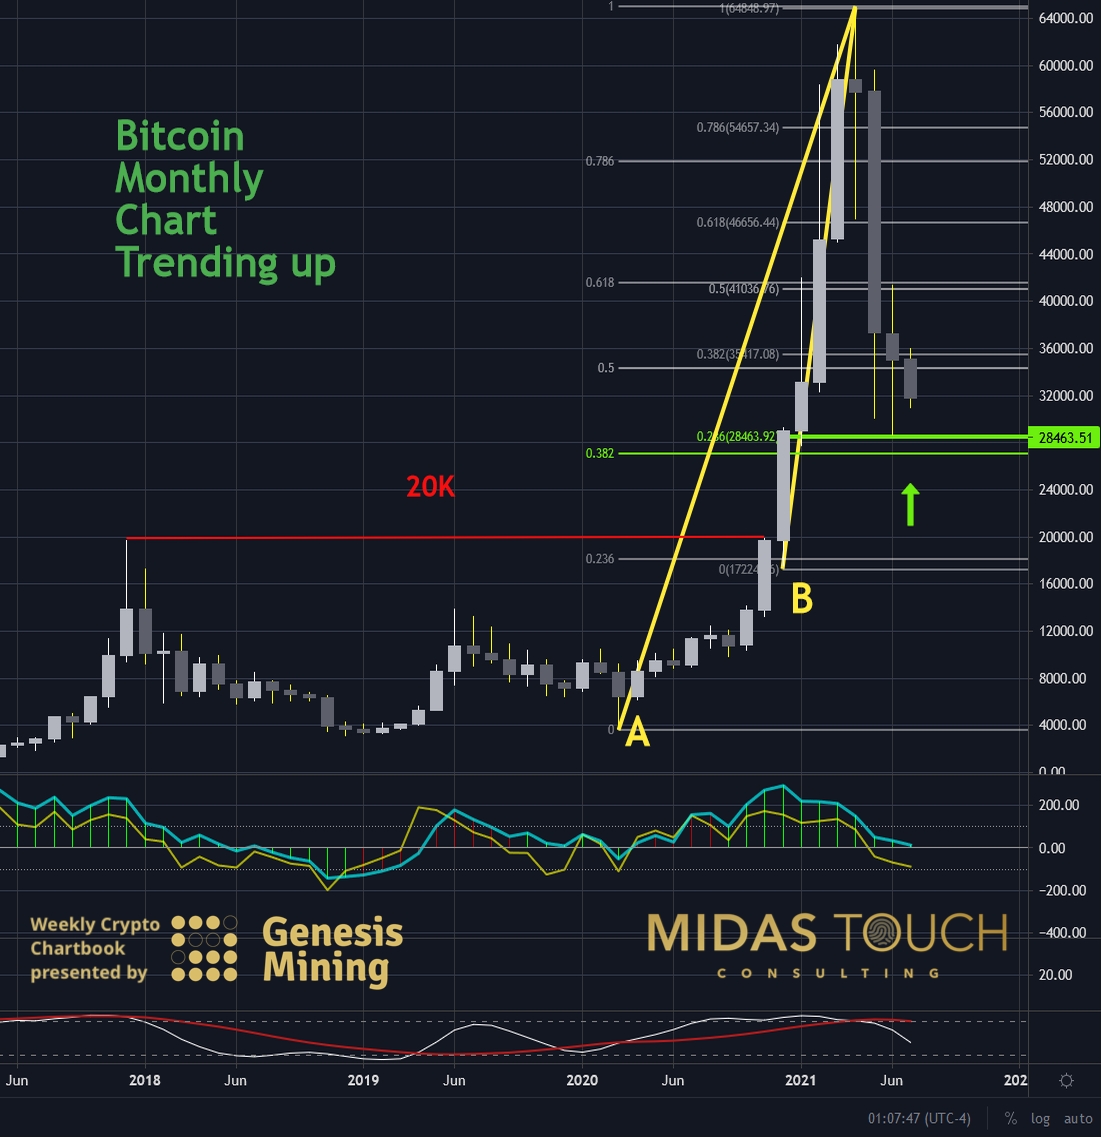
Bitcoin in US-Dollar, monthly chart as of July 20th, 2021.
One of the best ways to reinvent yourself, meaning to get in a proper neutral state, is finding a relatively quiet trading spot within the 24/7 Bitcoin trading environment. Or even better, turn your real-time data feed off, so that the charts can not stimulate you with movement. Start with the largest time frame from your triple time frame set up and get a sense of the long-term direction (sideways, up, steep up, down, steep down) and only consider setups in the time frame below (the setup time frame) that follow this direction.
In this week’s chart book, we take as an example the monthly time frame for a long-term Bitcoin position. Bitcoin, reinvent yourself.
We can see on the monthly chart above a clear long-term bullish note on Bitcoin. In addition, we see good support based on our overlaying two Fibonacci retracements. In retracement A from the absolute lows of the latest strong up-leg from March last year, we get good price support. From the second measurement of the pure breakout leg through US$20,000, we have already had a bounce with a doji indecision bar of last month. Consequently, we are looking for long setups only on the next lower time frame, the weekly chart.
BTC-USD, Weekly Chart, Weekly time frame for setups:
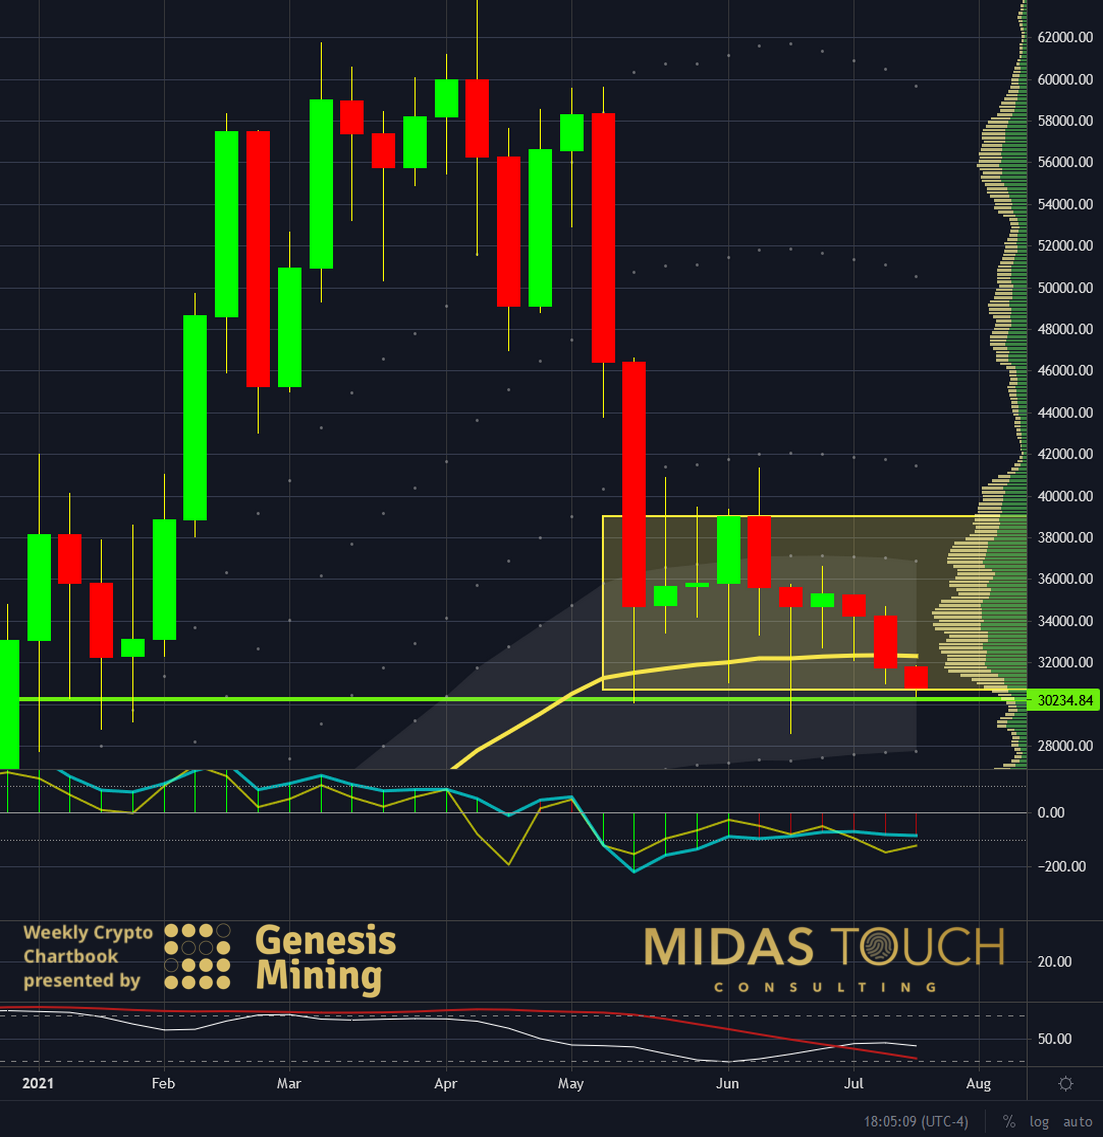
Bitcoin in US-Dollar, weekly chart as of July 20th, 2021.
Having identified the monthly time frame to a bullish trend on Bitcoin, we wouldn’t consider even a beautiful short setup since we insist on all edges stacking in our favor. This already cuts our entry horizon of possibilities in half.
The weekly chart above shows an entry possibility on low risk near prices on the bottom of a sideways range right now (yellow box). This ten-week trading range between US$30,000 and US$39,000 has substantial fractal volume support, as shown in the histogram on the right side of the chart. We also find previous price support (see a green horizontal line). In addition, prices trade at the mean, also a typical reversal and support spot (yellow directional line).
BTC-USD, Daily Chart, Daily time frame for execution:
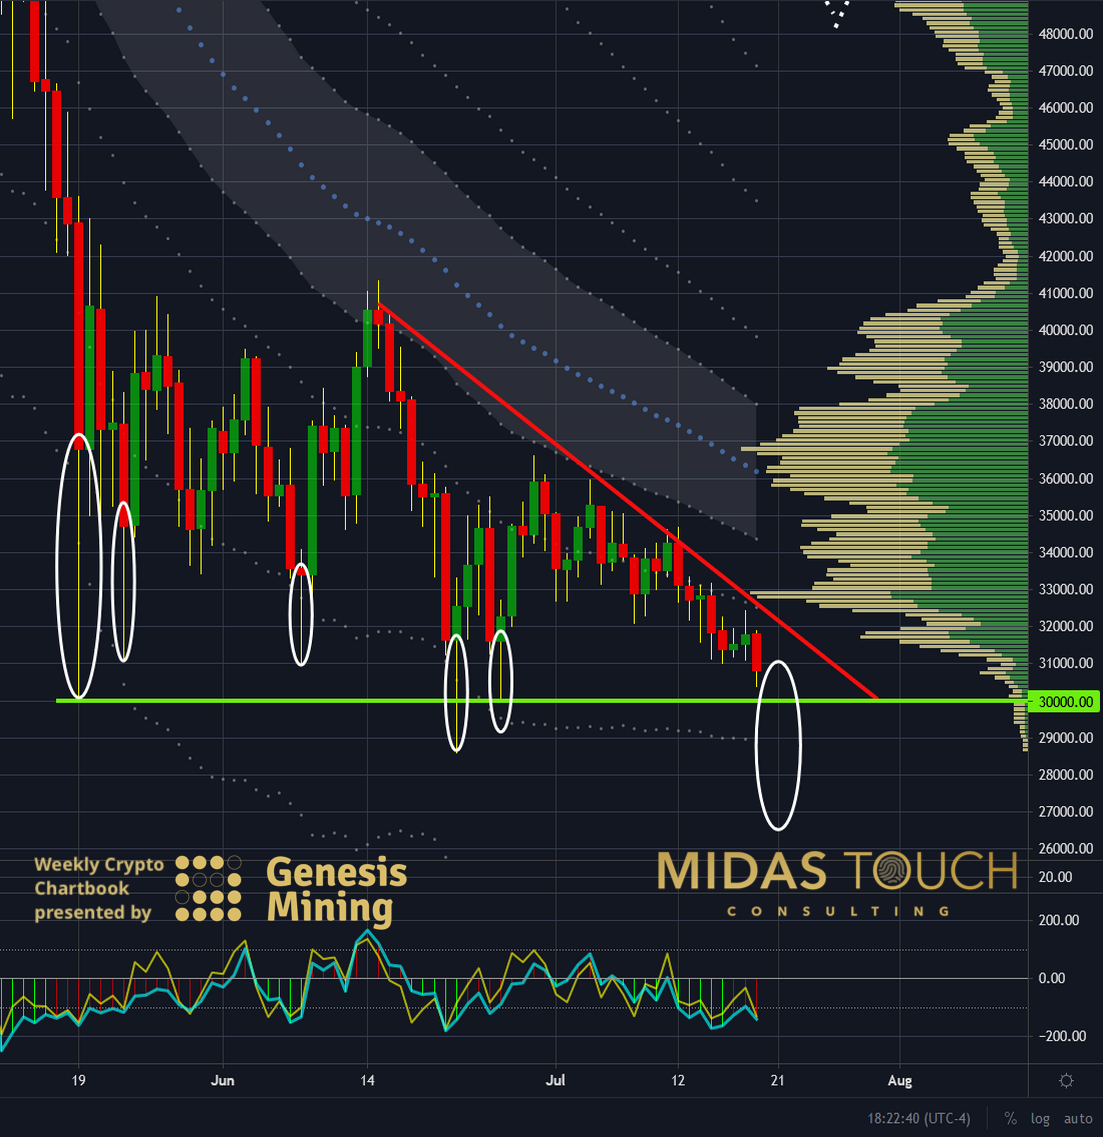
Bitcoin in US-Dollar, daily chart as of July 20th, 2021.
The weekly chart time frame planning sets the tone for our daily calls. A daily review for what execution setups we would be looking for and, most of all, filtering out any trades we are NOT interested in. See our daily call methodology. We post these daily calls for various asset classes daily in our free Telegram channel.
By focusing on what not to do, we avoid the blue car syndrome and use a tool to reinvent ourselves.
In the daily chart above, you can see a possible turning point in the making. We would not be surprised if prices penetrate the range violently to quickly reverse, creating a wick, as it has in the past (white circles).
No matter what methodology you use in fine-tuning your entries and reducing risk, right now is the time to pay attention.
Bitcoin, reinvent yourself:
The neutral mindset isn’t the only aspect of trading that calls for a daily reinvention. The mind that observes is a different one than the mind that executes trades. The observer evaluates, compares, and debates, necessary to find edges and build systems. The executioner must follow a clear set of rules blindly and can’t afford debate. Last-minute evaluation creates stress and an unwanted reach for intuition-an aspect not valuable for a counter-intuitive environment.
Consequently, this means a scheduled daily routine where one reinvents oneself repeatedly to be a valuable tool in market participation or otherwise; the vast sea of choices within the market swallows you and exploits the lack of discipline.
Feel free to join us in our free Telegram channel for daily real time data and a great community.
If you like to get regular updates on our gold model, precious metals and cryptocurrencies you can subscribe to our free newsletter.

