


Failure equals big money
If that be the case we’d be all rich trading the markets. No, what we are referring here to is pattern failure. Chart patterns have probabilities of how often they work. Most bet in favor of the favorable outcome of such patterns. Hence, the crowd, being surprised when a pattern fails, causes prices to run away. It can be very profitable to bet against the common outcome of a chart pattern, if as a professional, you can spot these sort of failures. Failure equals big money.
BTC-USDT, Daily Chart, Amateurs Get Lured Into Breakouts:
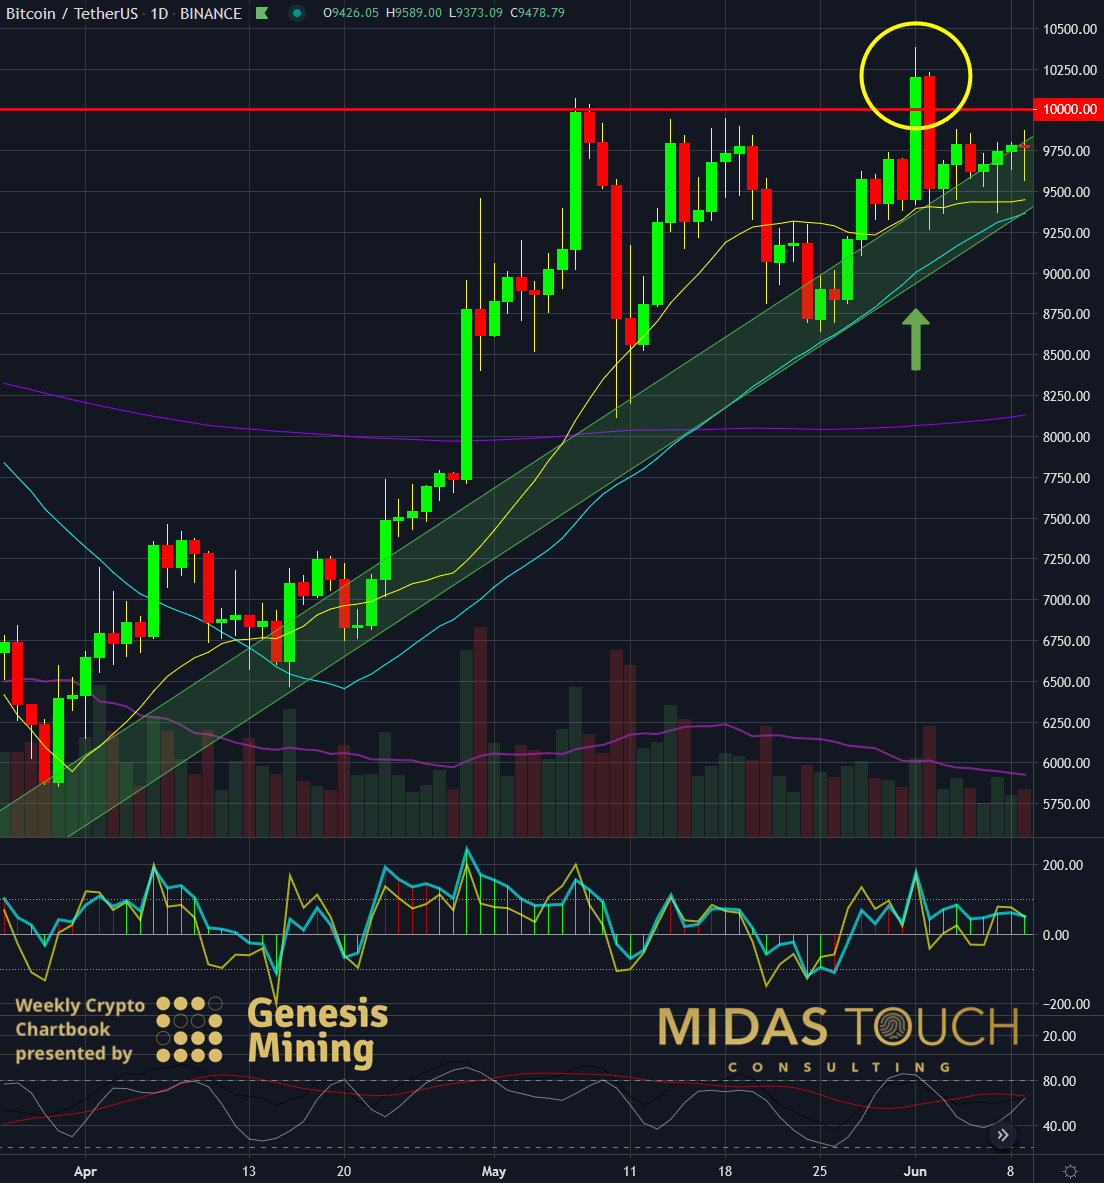
BTC-USDT, daily chart as of June 10th, 2020
This is what amateurs get lured into, a failed range breakout. They go long once 10k breaks in Bitcoin. This means they expose themselves into a high risk, high volume, high volatility zone risking bad fills and large stops. They find themselves in losing trades, their positions are being faded by the professionals.
BTC-USDT, 60 Minute Chart, This Is What Professionals Do:
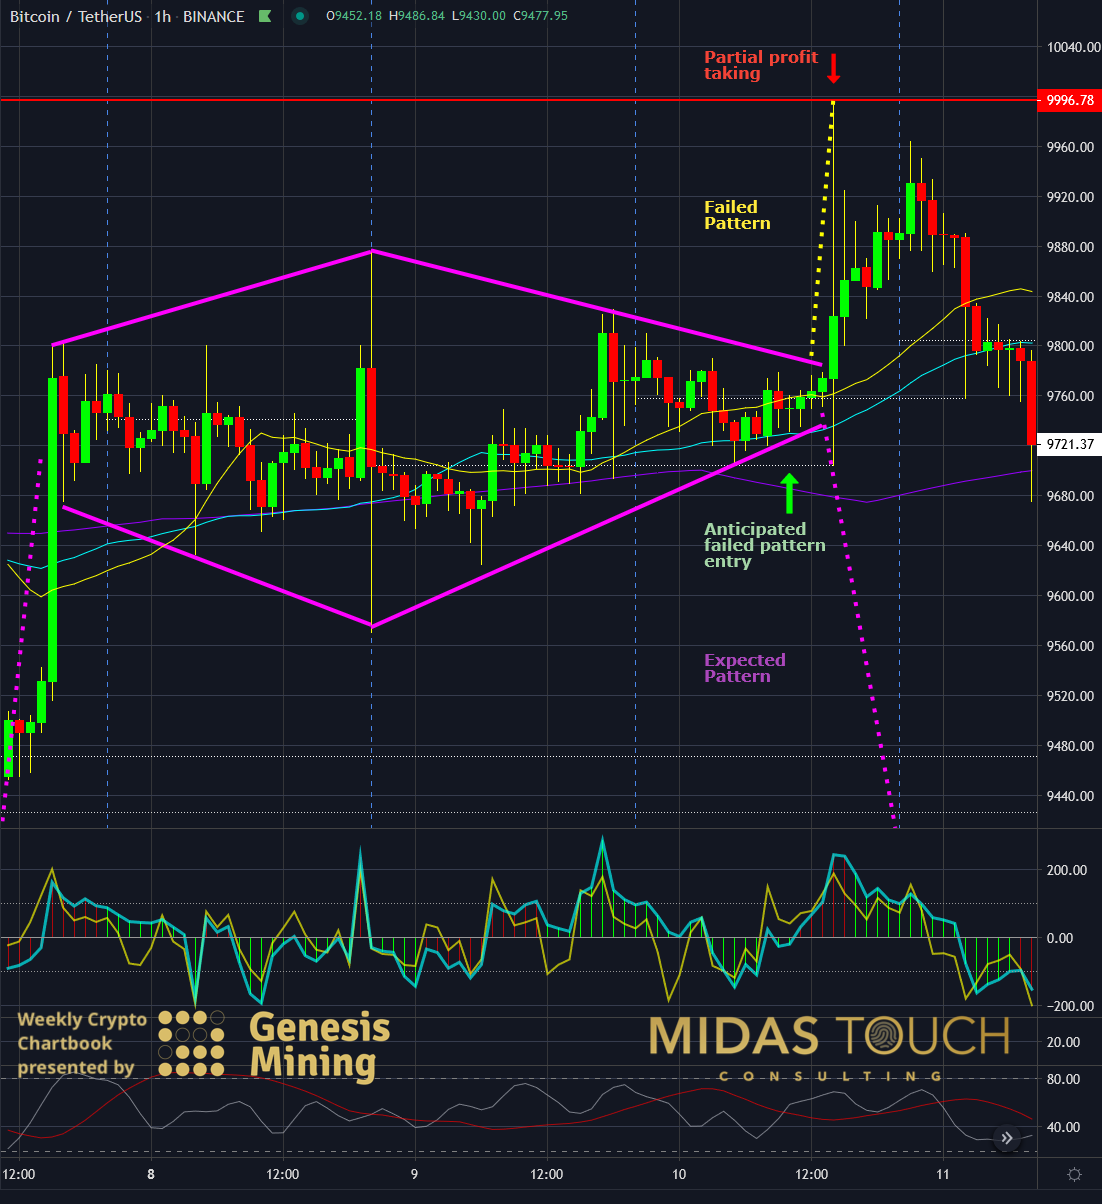
BTC-USDT, 60 minute chart as of June 11th, 2020
This is what professionals do. They anticipate a range break. After that they position themselves into a failing pattern on a lower time frame (in this case a diamond reversal pattern on a 60 min chart) and end up with extremely low risk to be positioned prior to a possible range break.
Once prices explode close to the range zone they reduce exposure risk by taking partial profits (see our quad exit strategy). They ensured themselves to only play from then on with the market’s money. Consequently, from this point on they care little risk if the range break actually occurs or not.
In our example prices got rejected from the 10k level and the rest of the position got stopped out at break even entry levels. Nevertheless, good profits were made even though there was neither a follow through nor did the actual range break.
Daily Chart, BTC-USDT, Failure Equals Big Money:
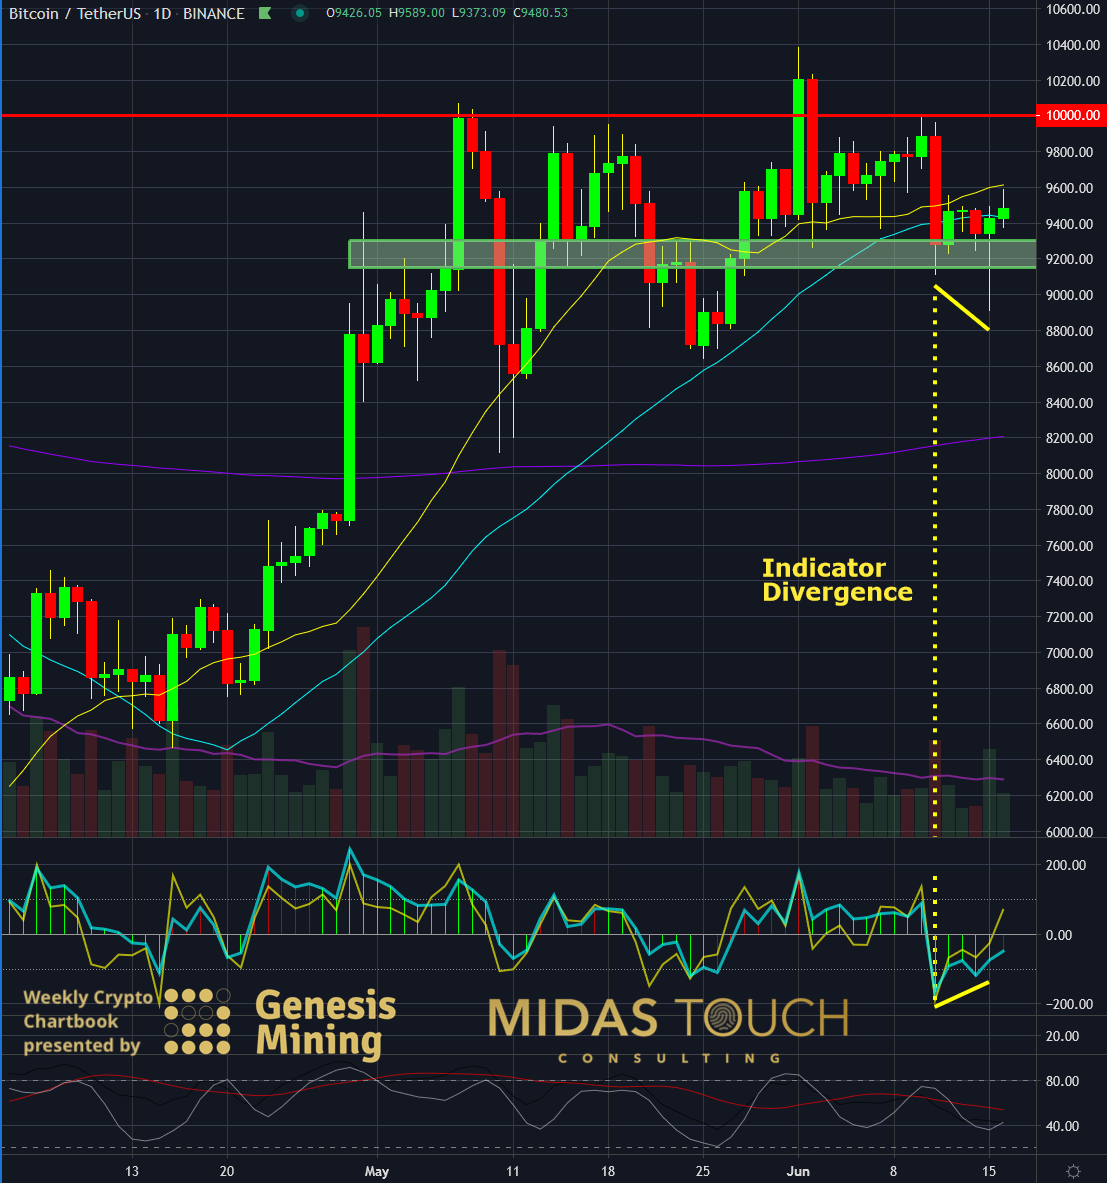
BTC-USDT, daily chart as of June 16th, 2020
With a methodology like this it is a lot easier to anticipate a range break without needing to be right if it actually occurs. We again find ourselves on the daily chart in a bullish price position. Prices are trading above a supply and demand zone (green horizontal box). A bullish hammer formation as a candlestick pattern and a bullish indicator to price divergence allow to again drop down in time frame and go for the hunt of a possible lower time frame set up. May be even an anticipated pattern failure.
Failure equals big money
There is a somewhat common figure of markets only trending 30% of the time. 70% of the time they are ranging. While this is arbitrary since there are already various definitions for trend, various markets and various time frames that skew these numbers by a grand variant, it is fair to say that trending markets are less common than ranging ones. Range breaks (especially if established for long periods of time) are very profitable.
In conclusion, watch for signs of reversal pattern near a range barrier falling apart and then do not hesitate to grab that possible pattern failure. While amateurs trade the high risk breakouts of a rage like this and get creamed more often than not you are already positioned and take part of your position off into the liquidity that these amateurs provide.
We post real time entries and exits for many cryptocurrencies in our free Telegram channel.
If you like to get regular updates on our gold model, precious metals and cryptocurrencies you can subscribe to our free newsletter.

