


Bitcoin – Fail, Learn, Improve
Make no mistake, failure is always an option! And as such, we try to approach the market each week fresh in our chart-book publication. We follow the principle of “never assume” and instead start from a blank page. If you were a carburetor specialist, you were out of work the day fuel injection came onto the market. Nothing is failsafe, and everything can be outperformed. To us, this means a weekly verifying look at fundamentals and newly competing innovative technologies. We align money management in accordance with market behavior, cyclical patterns, and other risk factors. We also take regular profits and build position size with profit capital versus leveraged trading or a pure “buy & hold” approach to maximize profits with minimized risk. Bitcoin – Fail, Learn, Improve.
The good news is: We still see Bitcoin to be the number one asset class in your wealth preservation portfolio. And this with a good chance to see higher prices in the near future.
BTC-USD, Daily Chart, Whatever works:
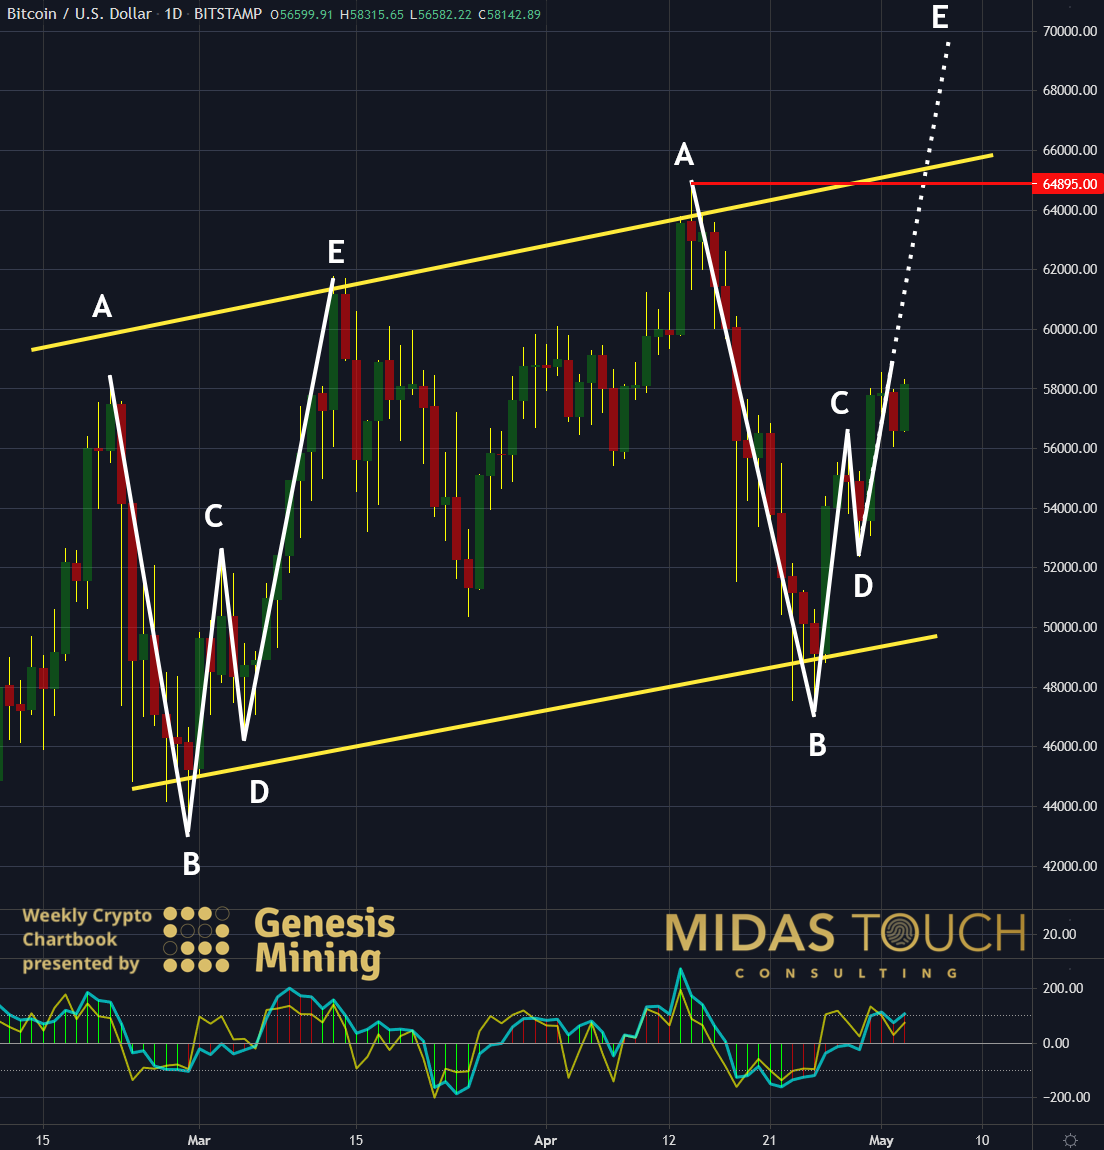
Bitcoin in US Dollar, daily chart as of May 3rd, 2021.
One healthy way for progress is to walk the road less traveled by and be independent of the good opinion of others. Stacking odds means backtesting any and all ways to find probabilities in your favor to stack your odds against the market. In Bitcoin, we found a high likelihood in specific trading patterns. The daily chart isn’t atypical for Bitcoin to produce the pointed-out price movement series (A, B, C, D, E) in sequence. You will find in comparing our lines not only similarities in percentage moves but also steepness of angles. In this case, our future projection is noteworthy because the distance between points C and D in the right side of the chart is much shorter than in the same white-lined picture to the left. This means a minor retracement – meaning a more aggressive step in of the bulls.
What is also essential is that Bitcoin might seem to be ranging and indeed has large retracements but is trading in a wide range up-sloping directional channel (yellow lines), which further indicates strength. We conclude that a progression of price to the upside has a higher likelihood than downward movement and that a taking out of all-time highs is a possibility in store.
BTC-USD, Daily Chart, Don’t trust your feelings:
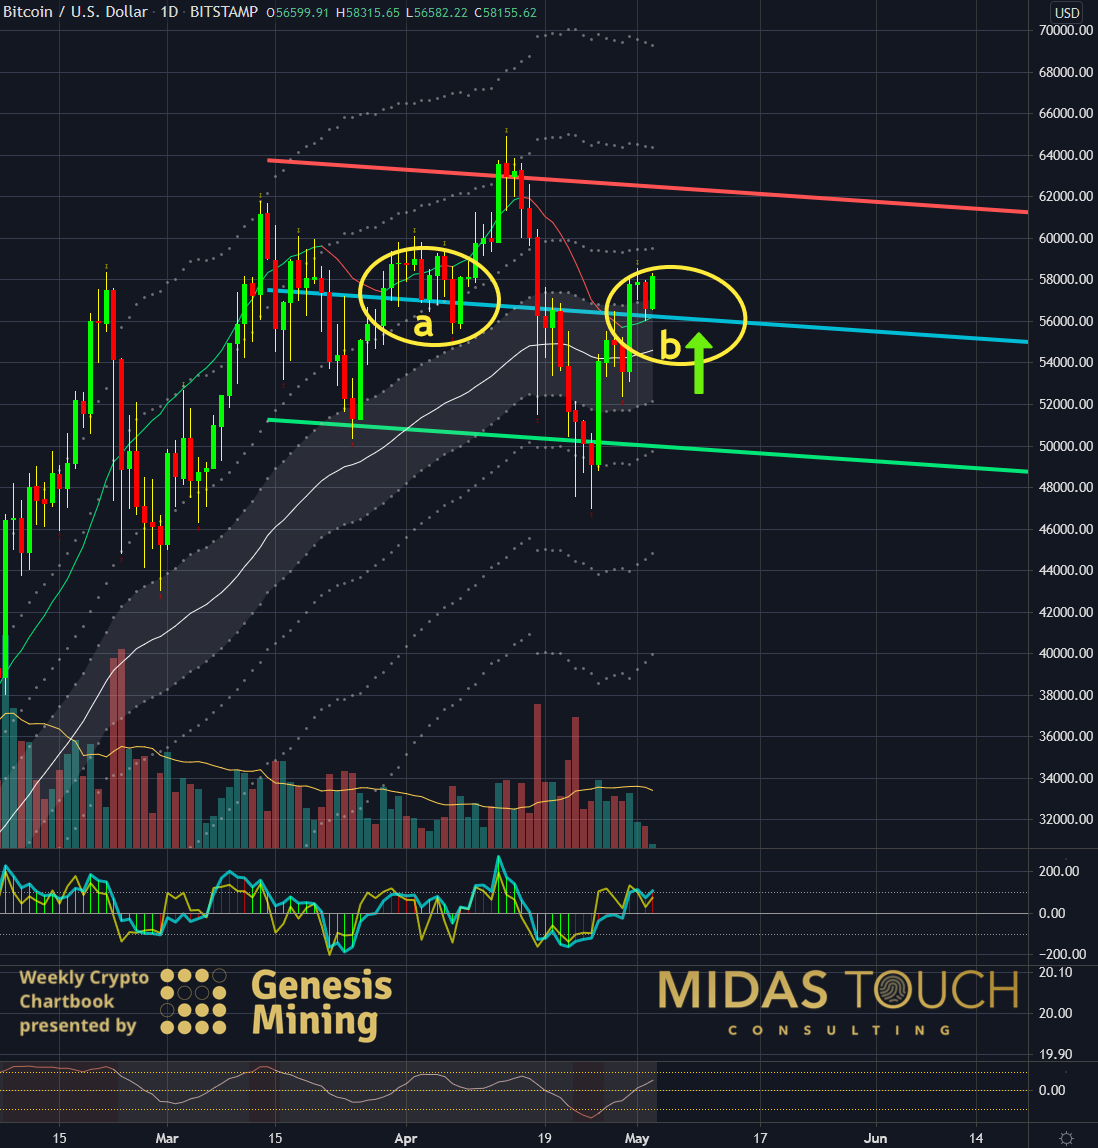
Bitcoin in US Dollar, daily chart as of May 3rd, 2021.
Another glance at the daily chart illustrates another principle we follow: “Don’t trust your feelings.” The linear regression channel indicates short-term drift elements to the sideways/downside. When Bitcoin isn’t advancing, it has temporary sideways periods of a few days where stops are taken out. Observing the market these days, one has the feeling of continuous downward movement. These brief periods resolve when the overall “feel consensus” is discouraged, in an upward jolt trend day.
Looking at “a,” you find such a drift along the midline of the regression channel. We might see a few days following such a movement (similar to the past), but we advise you to look out for low-risk long entry opportunities not to miss a possible next steep leg up. The higher probability nevertheless is an immediate rise of price towards all-time highs as indicated in the prior chart.
BTC-USD, Daily Chart, Last week´s entry:
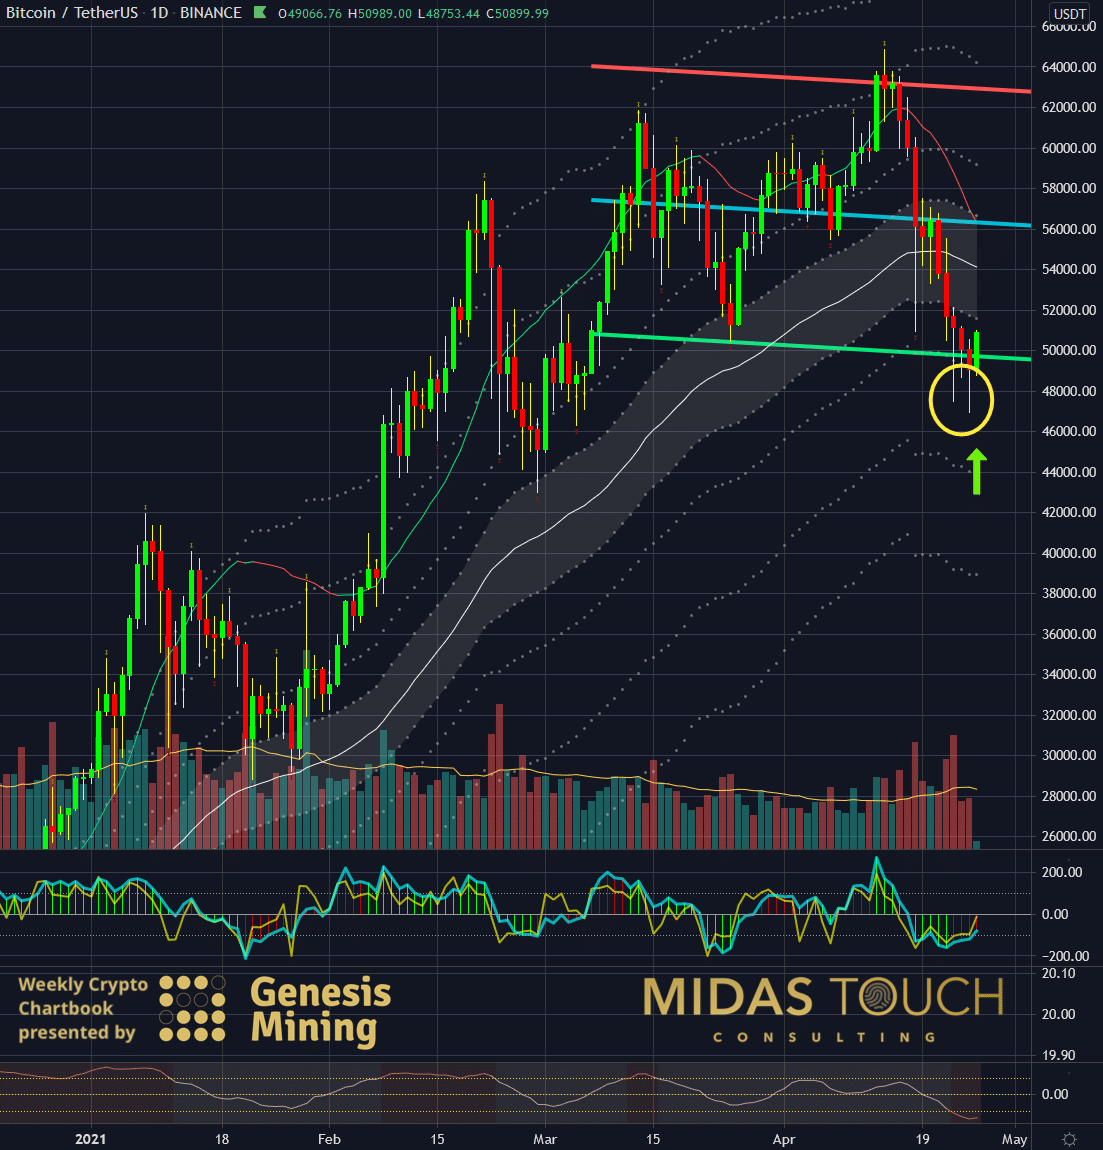
Bitcoin in US Dollar, daily chart as of April 26th, 2021.
We posted this entry chart in our last week’s chartbook publication, and the trade matured nicely through the previous week’s price advances from our entry at US$49,000 near to currently US$58,000. This leads us to the more significant larger weekly time frame observation.
BTC-USD, Weekly Chart, Bitcoin, Fail, Learn, Improve:
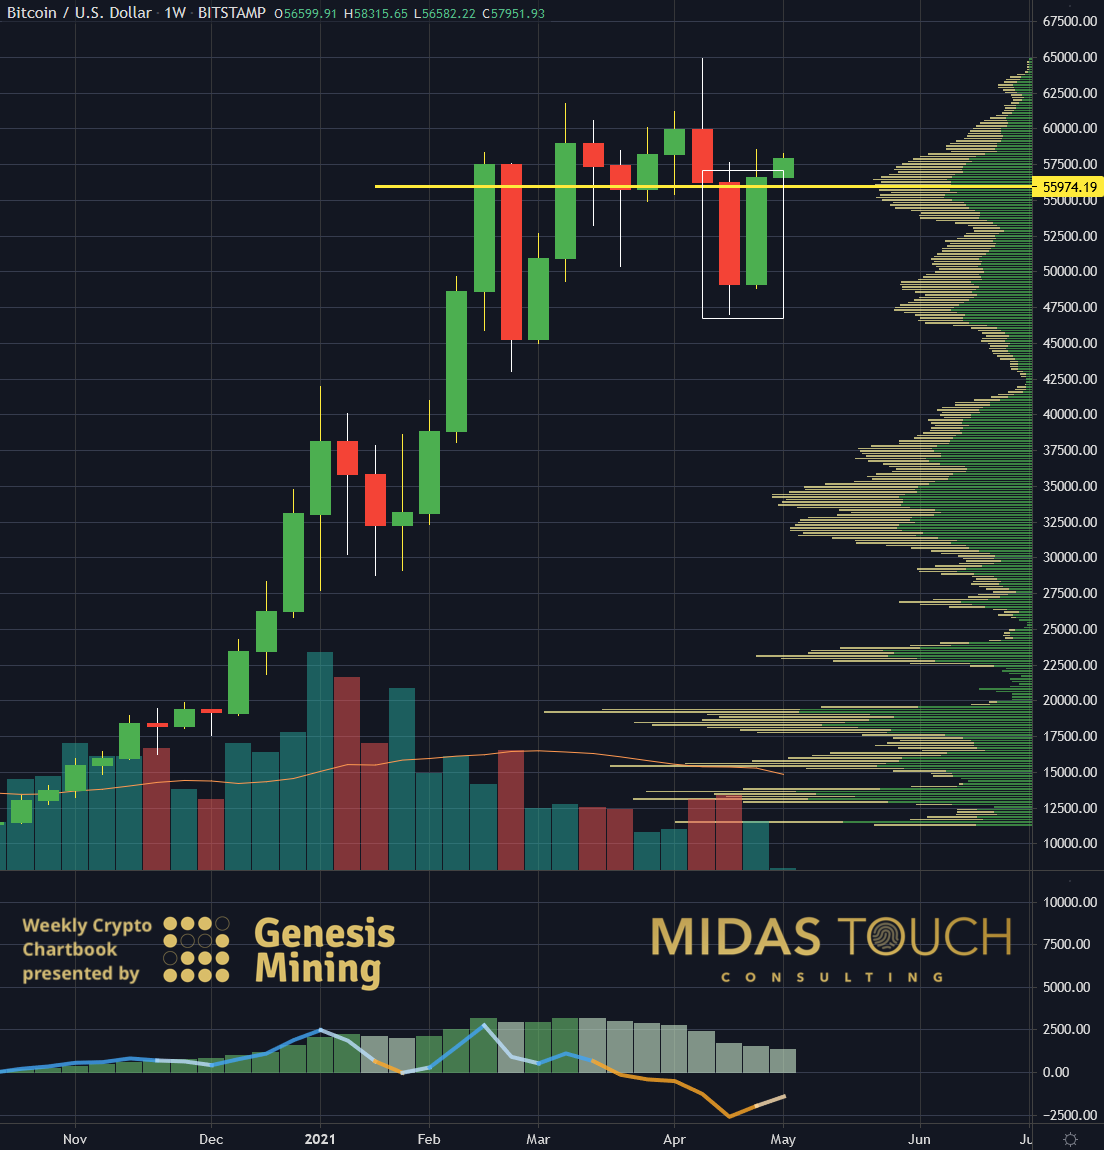
Bitcoin in US Dollar, weekly chart as of May 3rd, 2021.
Here the picture has significantly changed. A bullish engulfing pattern marked within the white square has turned the larger time frame more bullish. This candlestick price pattern states nothing more than all bear traders within the week of the red candle have now been proven wrong. They have either been stopped out or are underwater now. A reversal pattern that gives the bull traders an edge.
More importantly, price trades now above a meaningful supply zone marked in yellow from a volume node transactional analysis point of view.
We are confident that shortly all-time highs will be tested. A spot where we take partial profits and expect follow-through to new all-time highs.
Bitcoin – Fail, Learn, Improve:
In a world changing more rapidly than ever since the start of the industrial revolution, one needs to keep on one’s toes if one wants to be ahead of the curve and bet one’s money on perceptions about the future. Statistical edges in isolation or a purely fundamental approach are just not enough. A flexible mind is required most to accept failure and an immediate process to learn from one’s mistakes and implement the gained wisdom, improving and adjusting one’s bets. The times of “set it and forget it” is from a past that does not equal the future. “Adapt or die” comes to mind. And as much as this might seem extreme, markets are very unforgiving, and wealth preservation is key to ensure in part a happy future for yourself and your loved ones.
Each extra step taken might create that additional edge necessary to beat the game of finance to your advantage.
Feel free to join us in our free Telegram channel for daily real time data and a great community.
If you like to get regular updates on our gold model, precious metals and cryptocurrencies you can subscribe to our free newsletter.

