


Next short-term buying opportunity!
Since our last analysis Bitcoin continued to rally and reached 9,900 USD ten days ago. Obviously our cautious view came a bit early but the last 5-10% of any rally are always the most dangerous ones. At that stage everybody is getting very bullish and weak hands are finally buying while the underlying market moves further into an overbought setup and risk is increasing dramatically.
As Bitcoin moved towards 10,000 USD many of the small highly speculative coins started to move as well. But the resistance at the round psychological number was obvious and it is no wonder that Bitcoin did correct hard reaching 8,200 USD last Saturday. Today it has already retraced nearly one third of this recent pullback as an intraday high was reached at 8,825 USD. As usual the crypto markets are moving so fast that you can not even finish your written analysis before the situation might have changed significantly…
Overall the big question remains whether the strong recovery from the lows in early April around 6,500 USD is just a countertrend bounce within the larger downtrend or whether the crypto sector indeed has bottomed and we are in a new up-leg already. Recent price action is not helpful yet to answer this question. But lets look at the chart to determine the situation and potential scenarios.
Bitcoin Technical Analysis
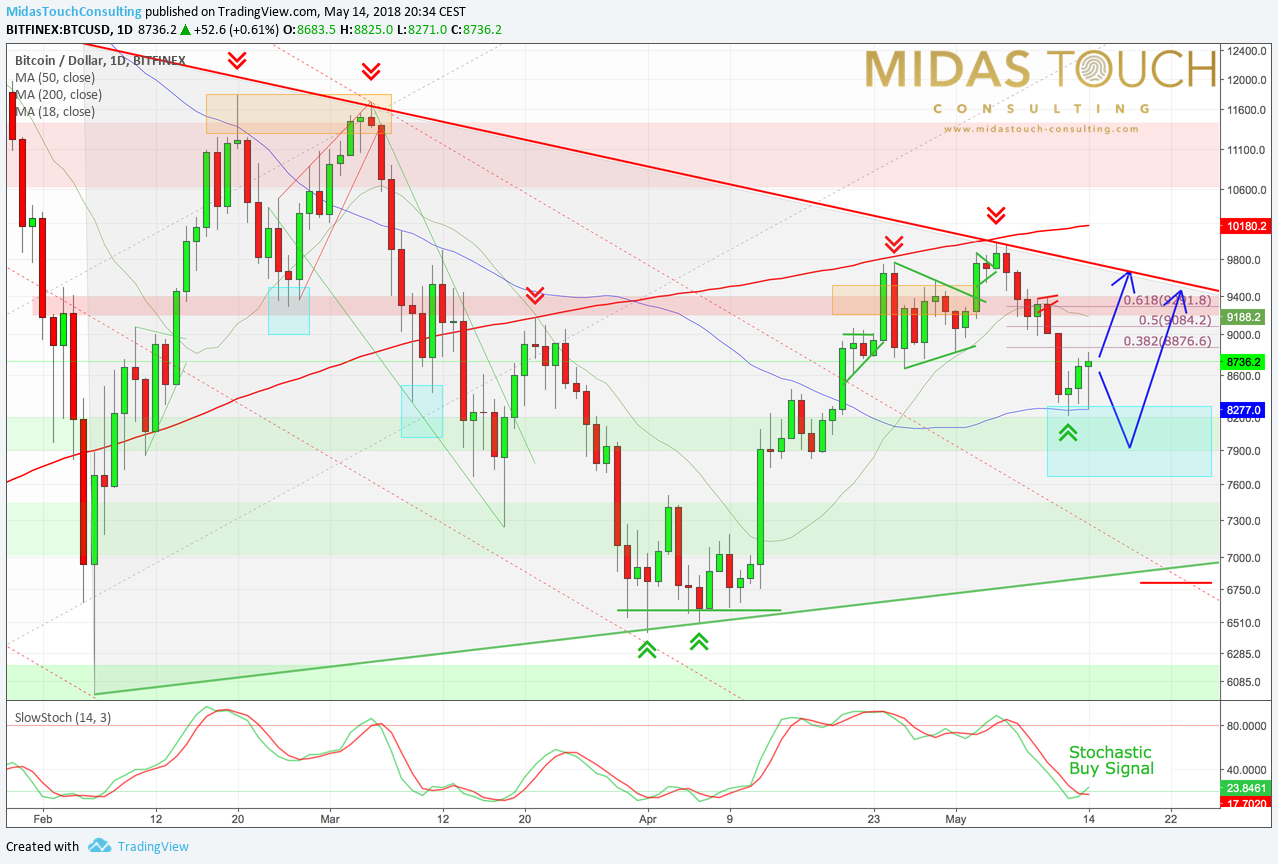
Bitcoin daily chart May 14th, 2018
Over the last four months Bitcoin seems to be running into a large triangle. While on the upside the series of lower highs is still in place, on the downside bears were not able to push prices back towards the low at 6,000 USD from early February. Within the triangle the overall picture remains neutral
The recent peak at 9,990 USD reached not only the downtrend line but also failed just below the 200-MA (10,180 USD). The last pullback consequently brought Bitcoin prices back to their 50-MA (8,277 USD). Here Bitcoin was extremely oversold from a short-term perspective.
Today’s bounce off the 50-MA is therefore no surprise and could take Bitcoin directly back towards the resistance zone around 9,200 USD. As well another attack towards the downtrend line around 9,500 USD is possible. If today´s bounce is a bull trap, the pullback could continue and would bring another buying opportunity between 7,700 and 8,200 USD. But with a new buy signal from the stochastic oscillator, rising prices are way more likely.
Should Bitcoin indeed be able to break out of the triangle, the whole picture would strongly improve and targets at 12,000 USD and 14,000 USD would be activated. In that case, the whole crypto sector should strongly rally too and many alt coins will outperform Bitcoin.
But it is still too early for such a very bullish scenario, because this triangle could also break to the downside. Then Bitcoin prices around 5,000 USD and lower will become very likely.
Looking forward to the next couple of weeks and maybe even months, the most likely outcome is a consolidation within the triangle.
Bitcoin CoT-Report
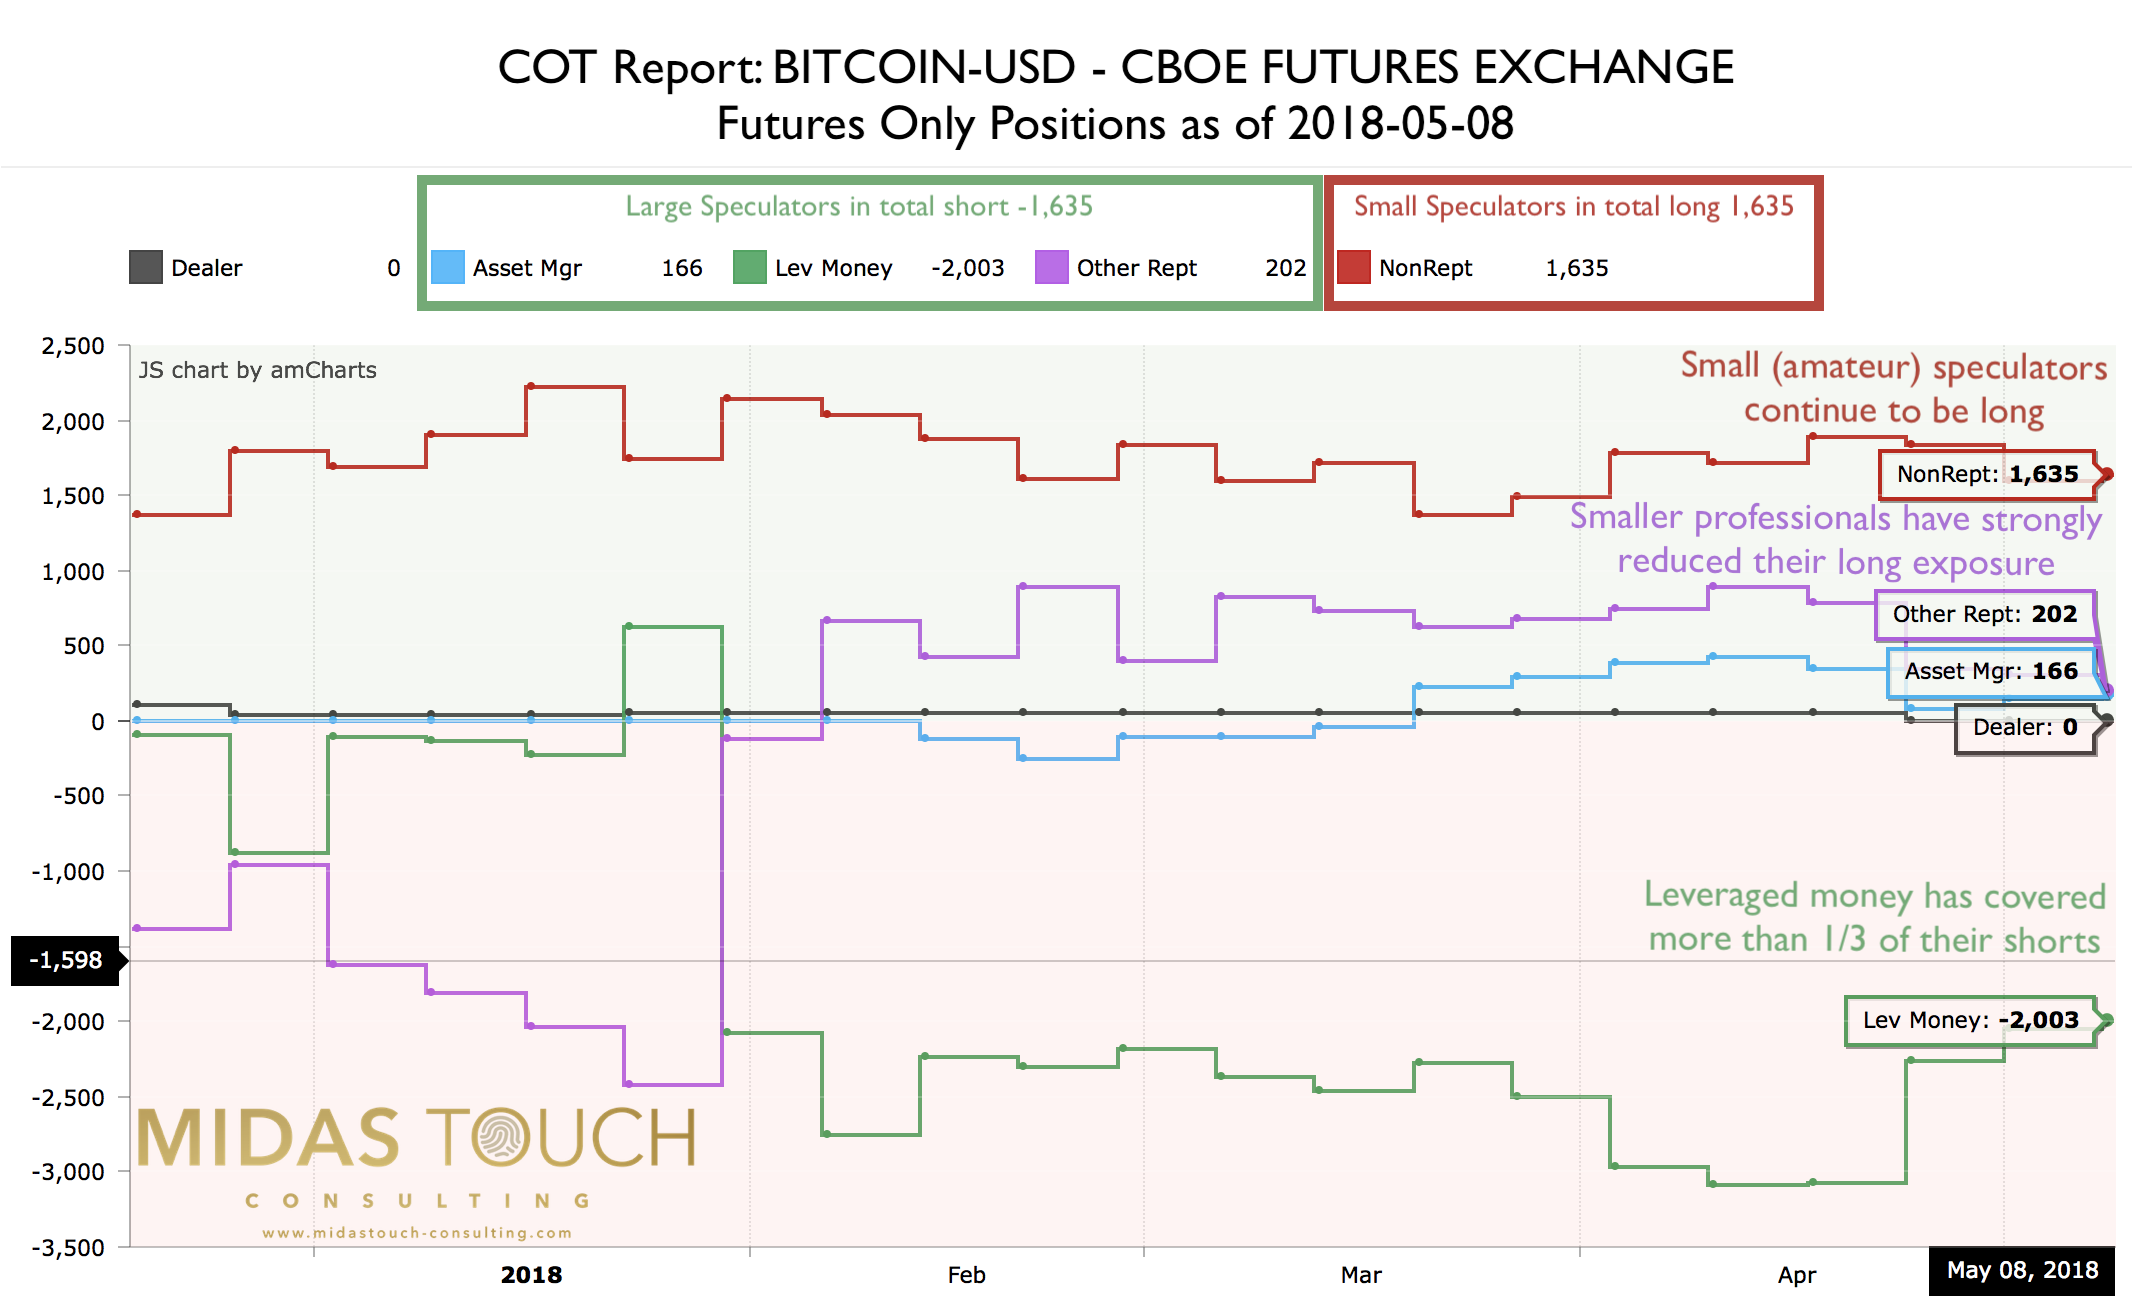
Bitcoin Commitment of Trades as of May 8th, 2018
According to the latest CoT-report the large speculators have covered a significant amount of their shorts. Especially the leveraged money (as part of the large speculators) has covered one third of their shorts since early April. Due to rising prices in Bitcoin they were probably forced to cover their shorts (short squeeze). The group of small amateur speculators in contrast continue to be net long while commercials (market markers or dealers) are not yet active.
All in all, the commitment of trade data paints a mixed picture. Usually large speculators are often on the wrong side. The leveraged money could therefore being forced to cover even more of their shorts. But being wrong is also a typical character trait of the small amateur speculators. This group is notoriously long and shows no sign of weakness so far. Looks like they represent the convinced “hodlers”.
Summarized, the CoT-report begins to allow us more insights into whats really going on. At the same time we still need more data points to evaluate the young Bitcoin futures market.
Bitcoin Sentiment
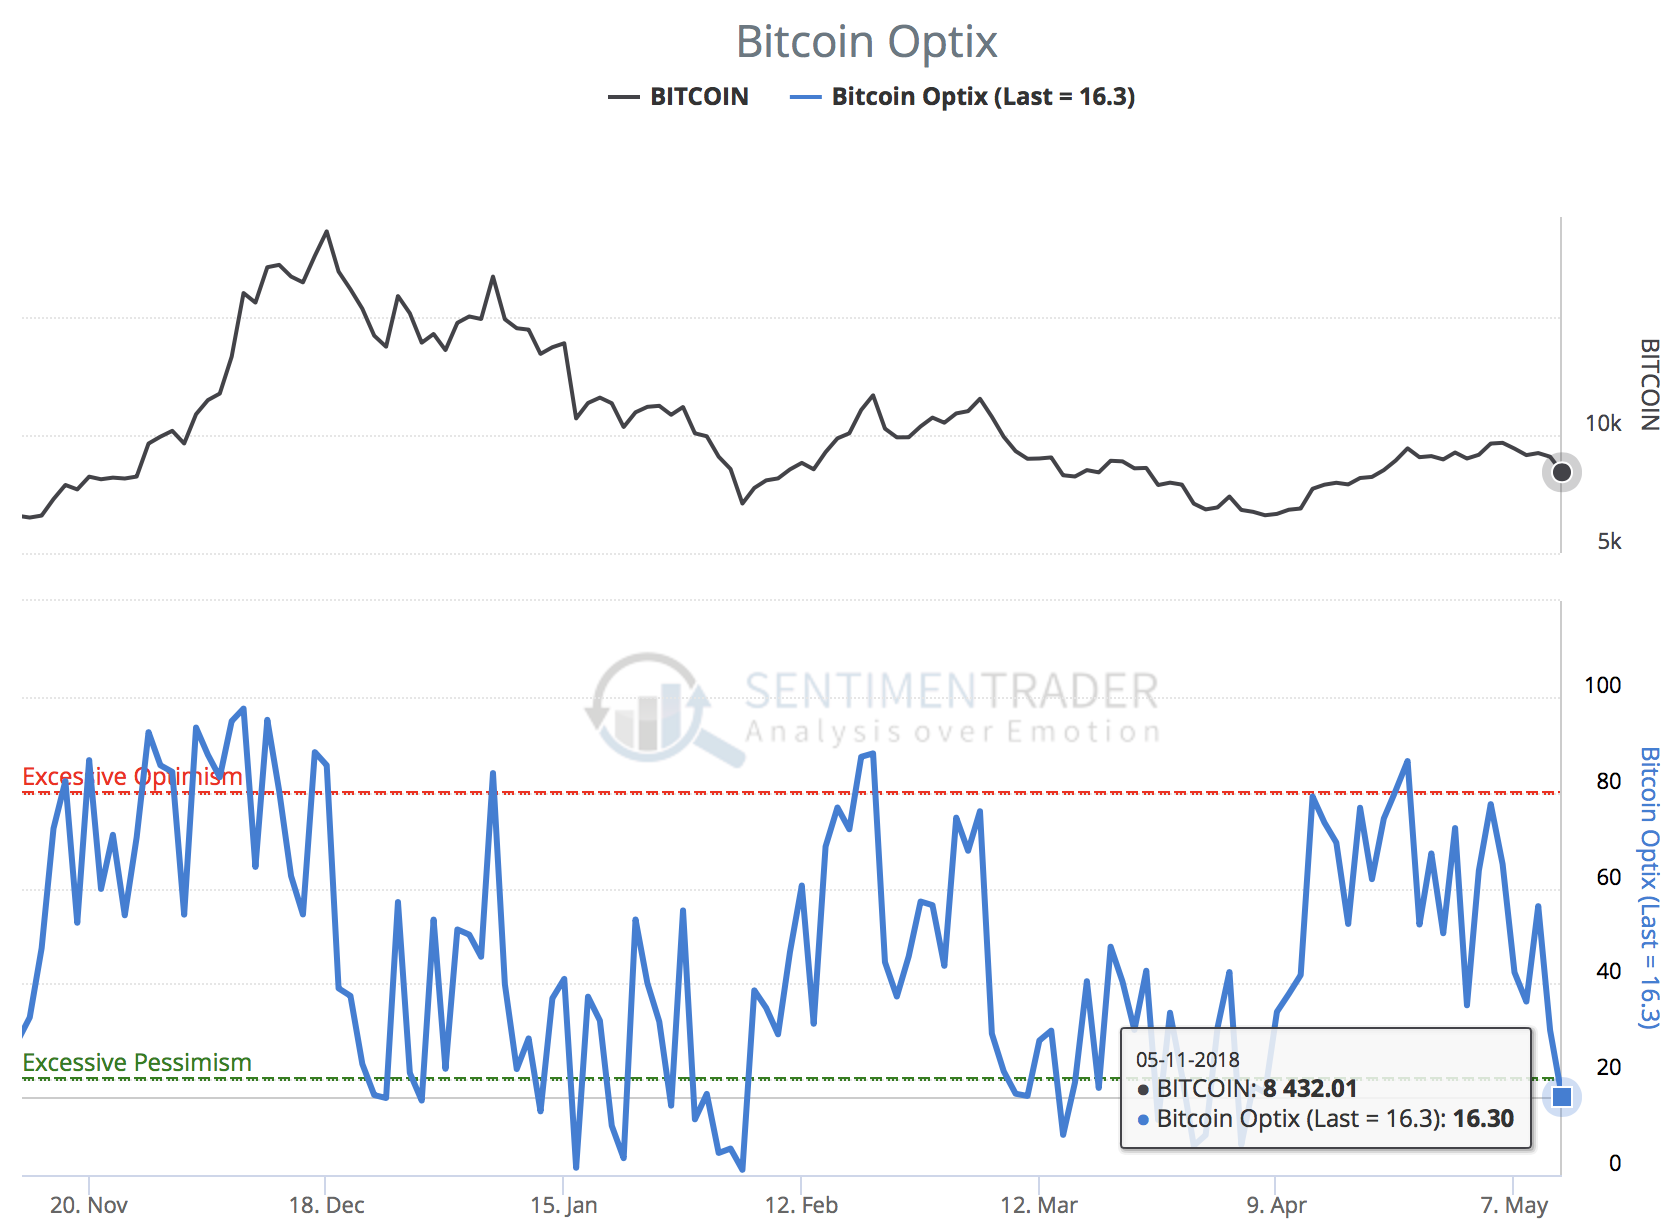
Bitcoin Sentiment as of May 13th, 2018
Last Friday, when Bitcoin dipped below 8,400 USD, sentiment data showed extreme pessimism. Today its already clear that the last three days offered a good short-term buying opportunity into the sector. To push the perception back towards overly optimistic levels Bitcoin and the whole crypto sector could certainly rally quite a bit from current levels.
In the very big scheme of things it seems to me, that skepticism towards cryptos is still very high too. This is a good foundation for rising prices over the next couple of years.
Short-term the current excessive pessimism argues for rising prices once again. But it could take some more days before the final bottom indeed is in.
Conclusion
With the strong recovery and a series of higher lowers the big picture has certainly improved for Bitcoin and the crypto sector. But it is too early to call the end of the crypto winter. The triangle will likely determine price action over the next couple of weeks and months. First as a consolidation within its boundaries. Then later, once a breakout has happened, it will probably reveal the direction for the rest of the year.
Disclaimer: I am personally long BTC, therefore I am biased! Please do your own due diligence..

