


You snooze you lose
The required skill level to prosper trading is treading light footed. This is only possible with confidence. Confidence comes from a knowing. Knowing settles in after a long time of experience. However any professional can get shaken up, hence the saying “when in doubt stay out”. Moves to the downside are vastly shorter in time than long legs. It takes less time to destroy something than building it. Fear is more forceful than greed on the short term. Consequently, when markets change and are going down it requires a speedy learning process. As a professional trader one needs to adopt fast. This means little sleep in market crash times and many hours behind the screen for back testing and analyzing markets. In other words, when markets truly change one better hits the ground running. Otherwise You snooze you lose.
As a market speculator one can not afford to take a break or sit out a market crash without a steep learning curve. The main goal is a consistent equity curve. You can’t just go into cash if for example this new situation might render cash worthless due to a possibility of hyperinflation. This sport requires one to be consistently on top of things. Let us share a finding that might be worth your time.
Time is of the essence
S&P 500 Monthly Chart, Prices Tumble Faster:
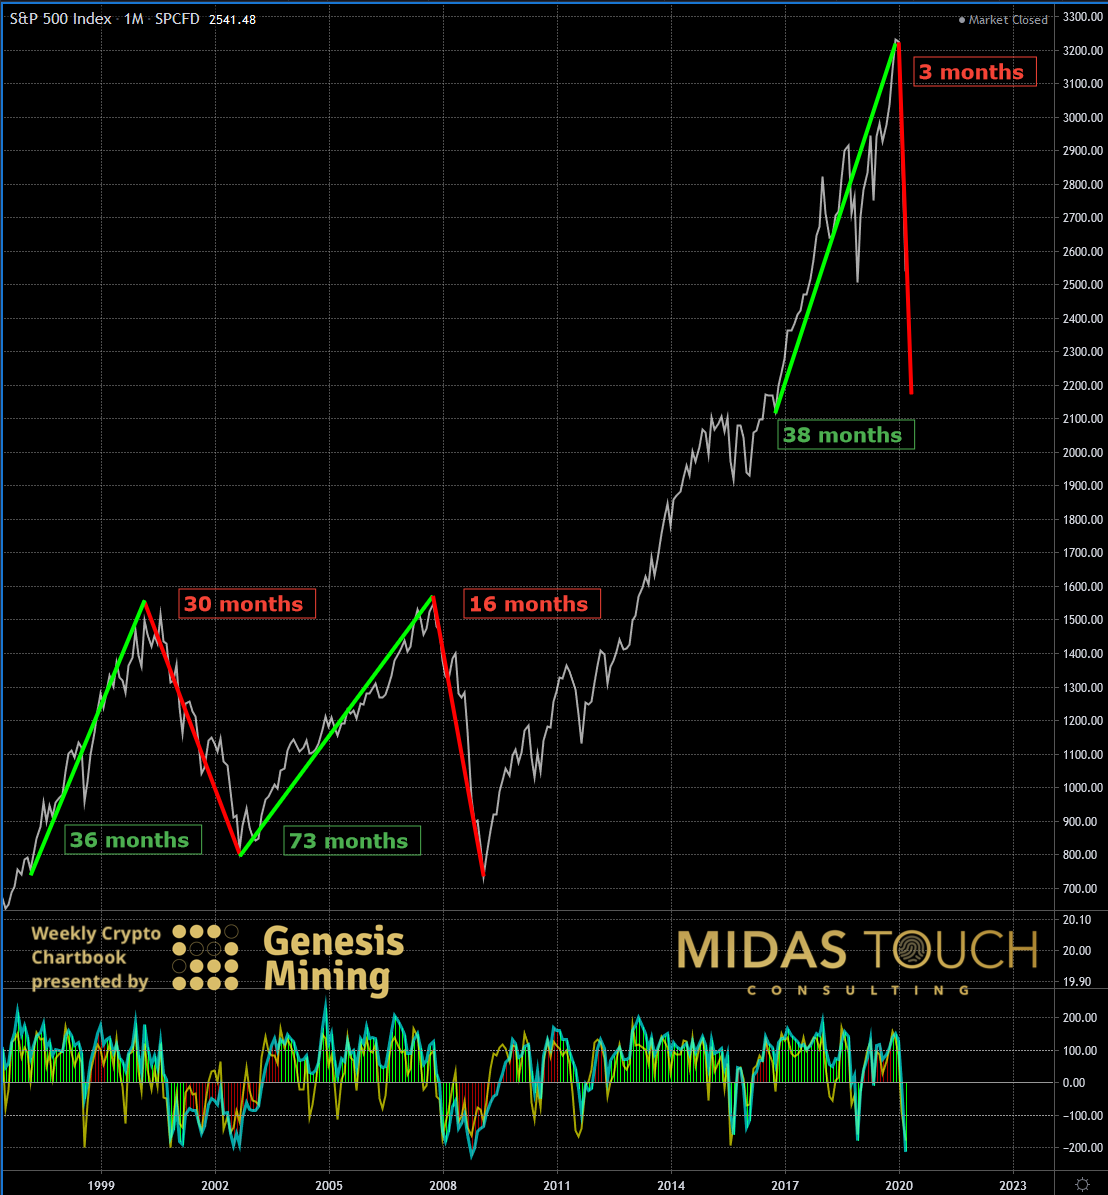
S&P 500 monthly chart as of April 1st, 2020
The monthly chart of the S&P 500 illustrates the relationship of time used for up legs versus down legs. We compared identical price growth versus price decline. Not a true comparison since a 50% decline already needs a 100% profit just to break even. So declines are much more meaningful to the investor. Nevertheless, we assumed identical moves and reviewed the last three crashes.
Clearly just like a sandcastle (and everything else), it takes much more time to build than to destroy. No matter if you short the market, or need to protect long holdings only, since the short legs are more meaningful they deserve exceptional attention. They require a quick understanding of things while they are happening or You snooze you lose.
Markets versus Bitcoin
Daily Chart, Relationship Between NASDAQ And Bitcoin:
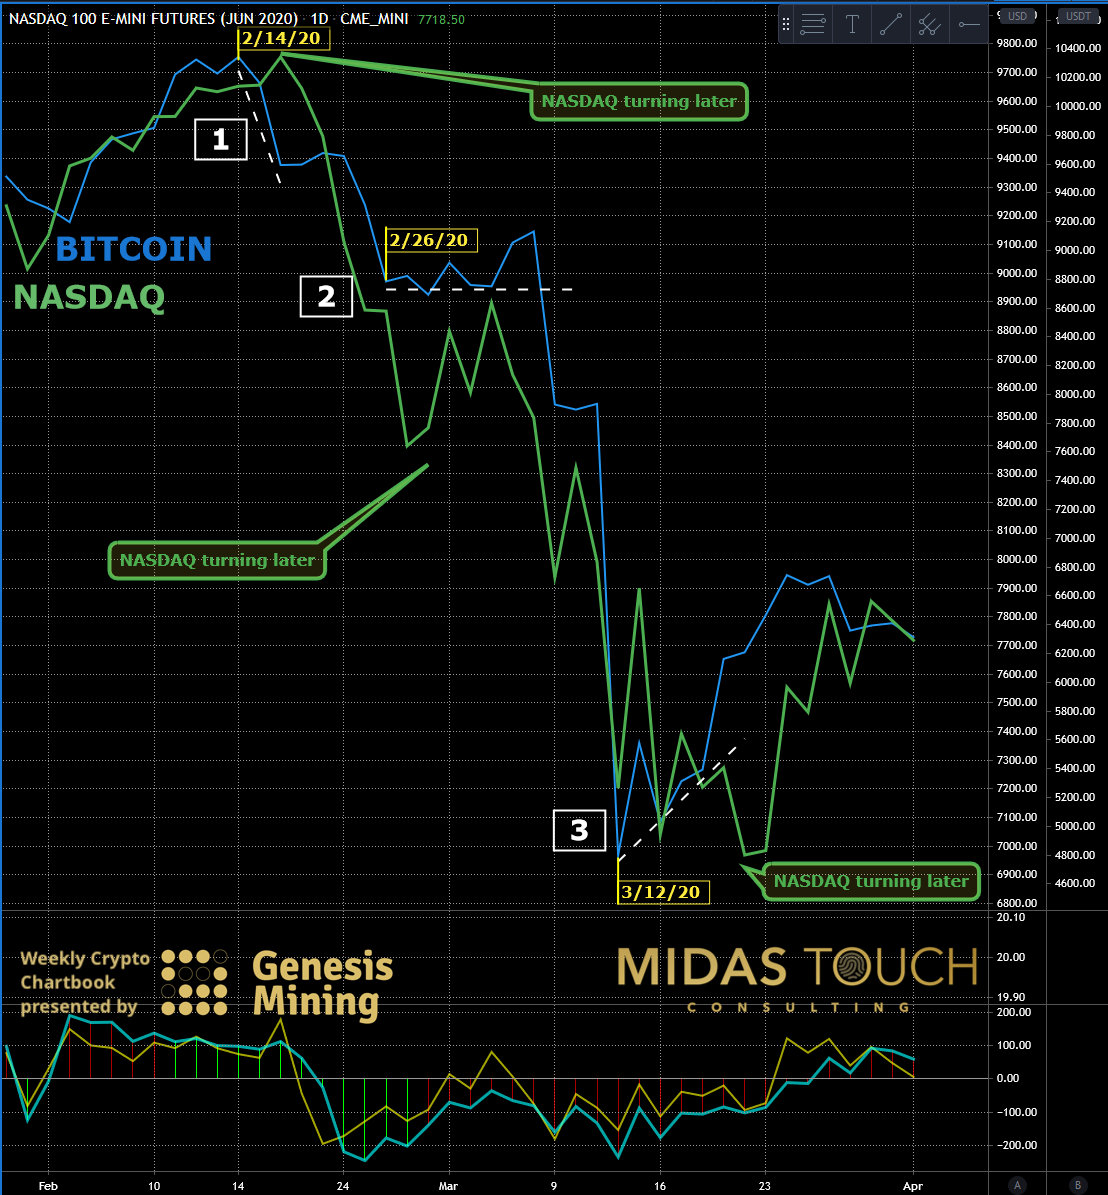
NASDAQ 100 futures versus BTC daily chart as of April 1st, 2020
The daily chart above compares the price behavior of Bitcoin (blue line) and the NASDAQ 100 (green line).
If you take a look at scenario one, you will find that Bitcoin made its turning point towards lower prices on the 14th of February. The NASDAQ had its high five days later before it turned south.
The second scenario shows Bitcoin starting to bottom build on the 26th of February while the NASDAQ still further declined and took two more days before advancing.
Scenario number three has Bitcoin print its low of a declining leg on March 12th while it took the NASDAQ a whole eight more days to do the same.
It is a small sample size that requires further forward testing, but it is a strong case for Bitcoin leading important turning points in the overall markets. Information like this can be highly valuable for various scenarios of exploitation and risk management, should this theory proof right. More importantly with the confidence of analysis like this being done and hip-pocketed to ones overall experience, one steps into the market with the required confidence. Prepare, to not be surprised should such events repeat themselves and confidently act upon these opportunities with proper execution!
Daily Chart, BTCUSDT, You Snooze You Lose, Inter Market Relationship Guidance:
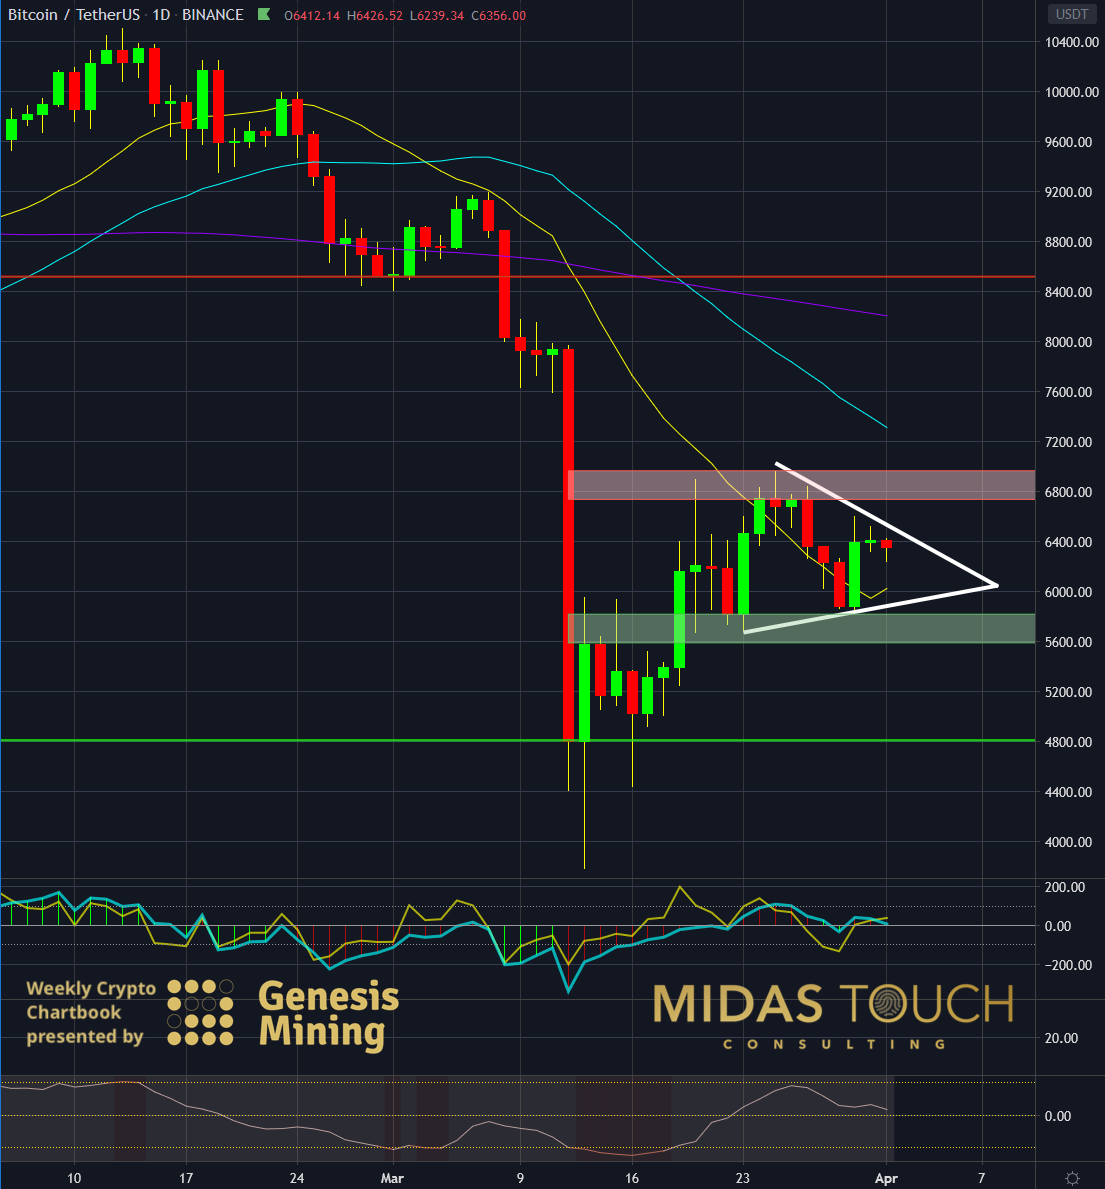
BTCUSDT daily chart as of April 1st, 2020
For example: The daily chart of Bitcoin above shows a congestion zone with a slightly higher probability towards the downside as a resolve. Assuming the previous concepts to be accurate, lightening up on ones overall market exposure in the S&P or NASDAQ components could be a way to reduce risk. With our Quad exit strategy you can lighten up on positions that you might find uncomfortable holding through a possible upcoming down leg. Another way to use this slightly leading indicator is to use it as a confirmation tool for a different market. We post all our Bitcoin market entries and exits live in our telegram channel with quite successful performance statistics. Even if you are not operating in the crypto space yet, you could use our entries as a tool to support your entries in a different market. Just like you would use an indicator. Truly, the possibility of application is vast and we just pointed out here a couple options. Inter market relationships can be highly useful in trading.
You snooze you lose
It can be challenging to keep ones head over water in a fast paced environment that confronts with new market behavior, but it is mandatory. One can not simply wing it in the markets. One needs true confidence to execute and as such a knowing, not a guessing or assuming. You certainly do not want to start out getting your feet wet as a newbie trader in a highly volatile steep declining market environment. Screen time spent at these times for analysis outside market hours (outside execution times in the case of Bitcoin being a 24/7 market) pays off. The sooner one adopts to market behavior never seen prior, the higher the likelihood to first of all not losing money and secondly making some more.
If you like to get regular updates on our gold model, precious metals and cryptocurrencies you can subscribe to our free newsletter.

