


Bitcoin – New fantasy despite summer lull and uncertainties
With prices reaching nearly USD 31,000, Bitcoin’s recovery rally hit its peak on April 14th. This resulted in a doubling of prices within a span of five months. Our initial two price targets of USD 25,000 and USD 30,000 were achieved. Bitcoin – New fantasy despite summer lull and uncertainties.
Review
However, since mid-April, Bitcoin has been drifting into a sluggish consolidation, reaching lows of around USD 24,750 last Thursday, which represents a decline of over 20%. As a result of this correction, the overall market capitalization of the entire crypto sector decreased from USD 1.26 trillion down to USD 1.02 trillion, a decline of approximately 19%. Due to the significant downward pressure on most altcoins in recent weeks, the Bitcoin dominance has risen to 48%.
Strong bounce in the last two days
Nevertheless, in the past two days, Bitcoin bulls have made a comeback. With a sharp recovery, prices have already rebounded by around 8.2% to approximately USD 26,850. While it is not yet a sustainable trend reversal, it is at least a clear sign of life!
The reason behind this increase is likely the announcement that Blackrock, the world’s largest asset manager, has filed an application with the US Securities and Exchange Commission (SEC) for a Bitcoin exchange-traded fund (ETF) based on spot prices. The approval of such an ETF by the SEC is highly uncertain, as previous Bitcoin ETF applications have faced significant resistance and concerns from regulatory authorities. If the SEC does approve Blackrock’s application, a flood of new Bitcoin ETF products could enter the market.
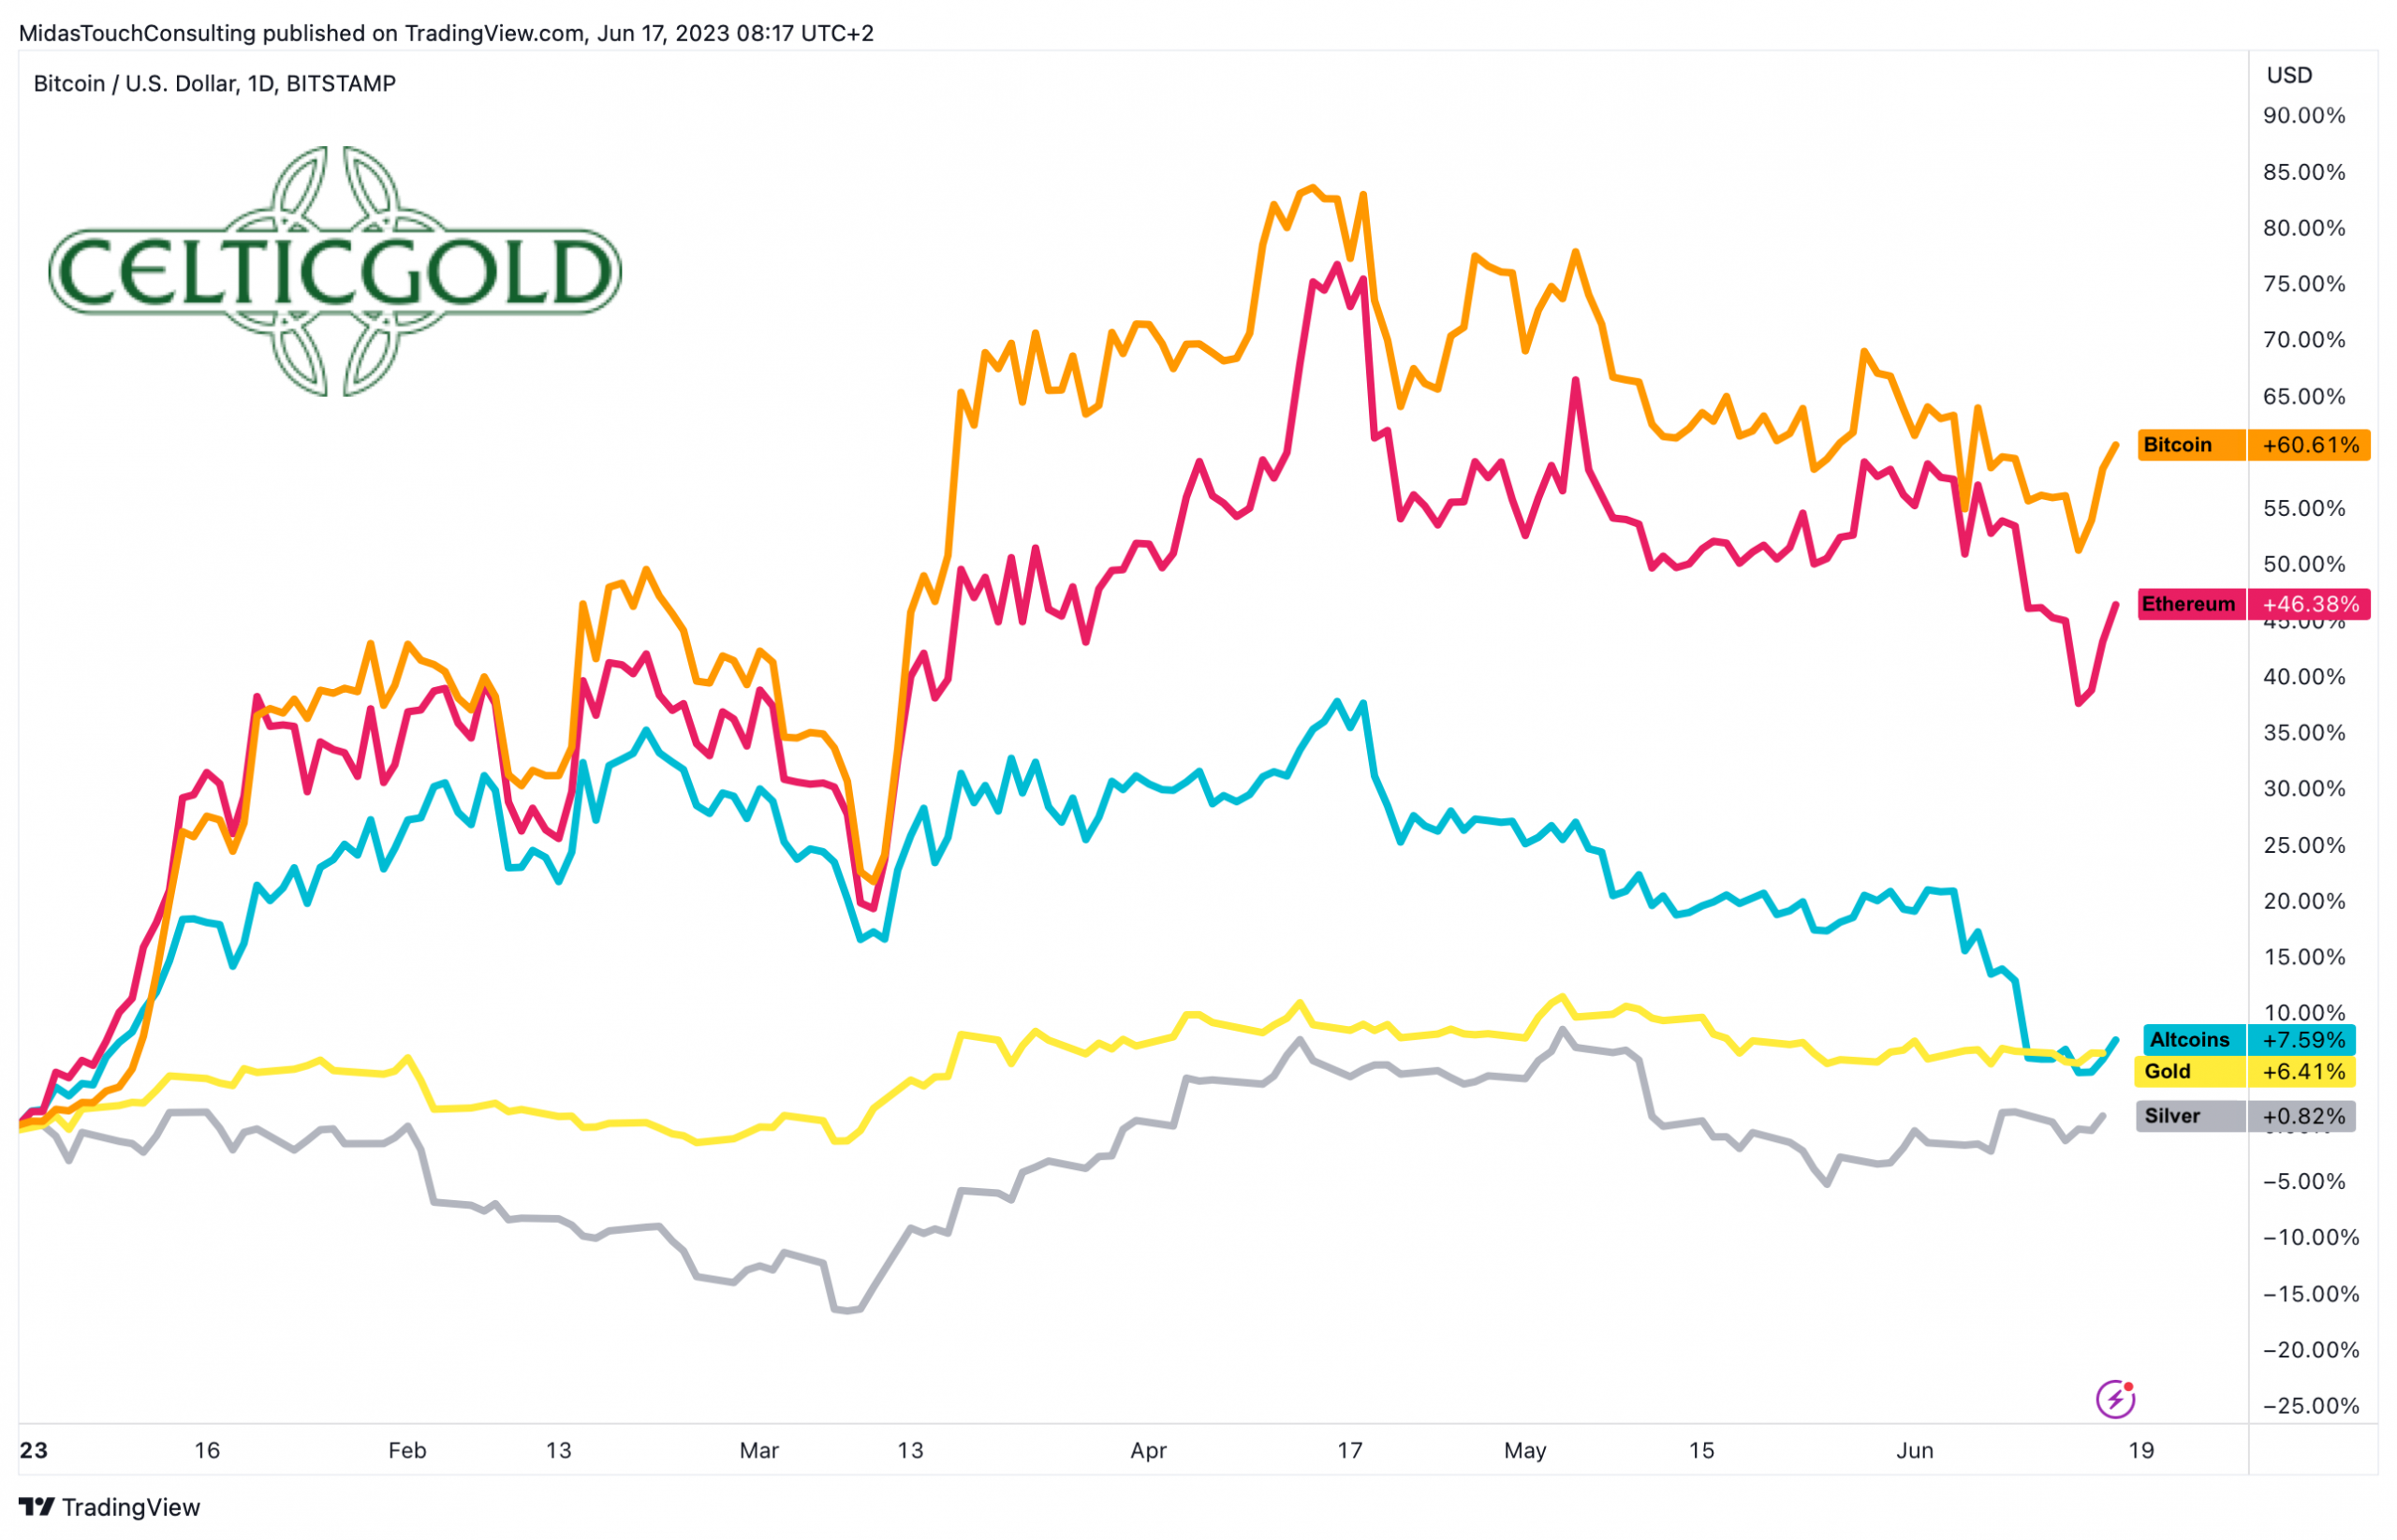
Bitcoin vs. Ethereum vs. altcoins vs. Gold vs. Silver in USD year-to-date, as of June 17th, 2023. Source: Tradingview
Overall, the price development since the beginning of the year has been clearly positive for both Bitcoin (+60%) and Ethereum (+46%). However, altcoins have given back almost all of their gains (+7.59%) due to the upcoming delisting on the Robin Hood trading platform. Gold has gained 6.4%, while silver has made little progress so far this year, with a gain of only 0.82%.
While the SEC, under the leadership of Garry Gensler, has been intensifying its scrutiny of major crypto exchanges such as Coinbase and Binance in recent weeks, the sector has lacked momentum and positive catalysts. Even before the traditional summer lull, the sector was severely impacted by high uncertainty. However, with the Blackrock application for a Bitcoin ETF, the sector could regain momentum, as a Bitcoin spot ETF is expected to bring significant new inflows of capital and purchasing demand.
Technical Analysis for Bitcoin in US-Dollar
Bitcoin Weekly Chart – Tenacious and healthy correction so far
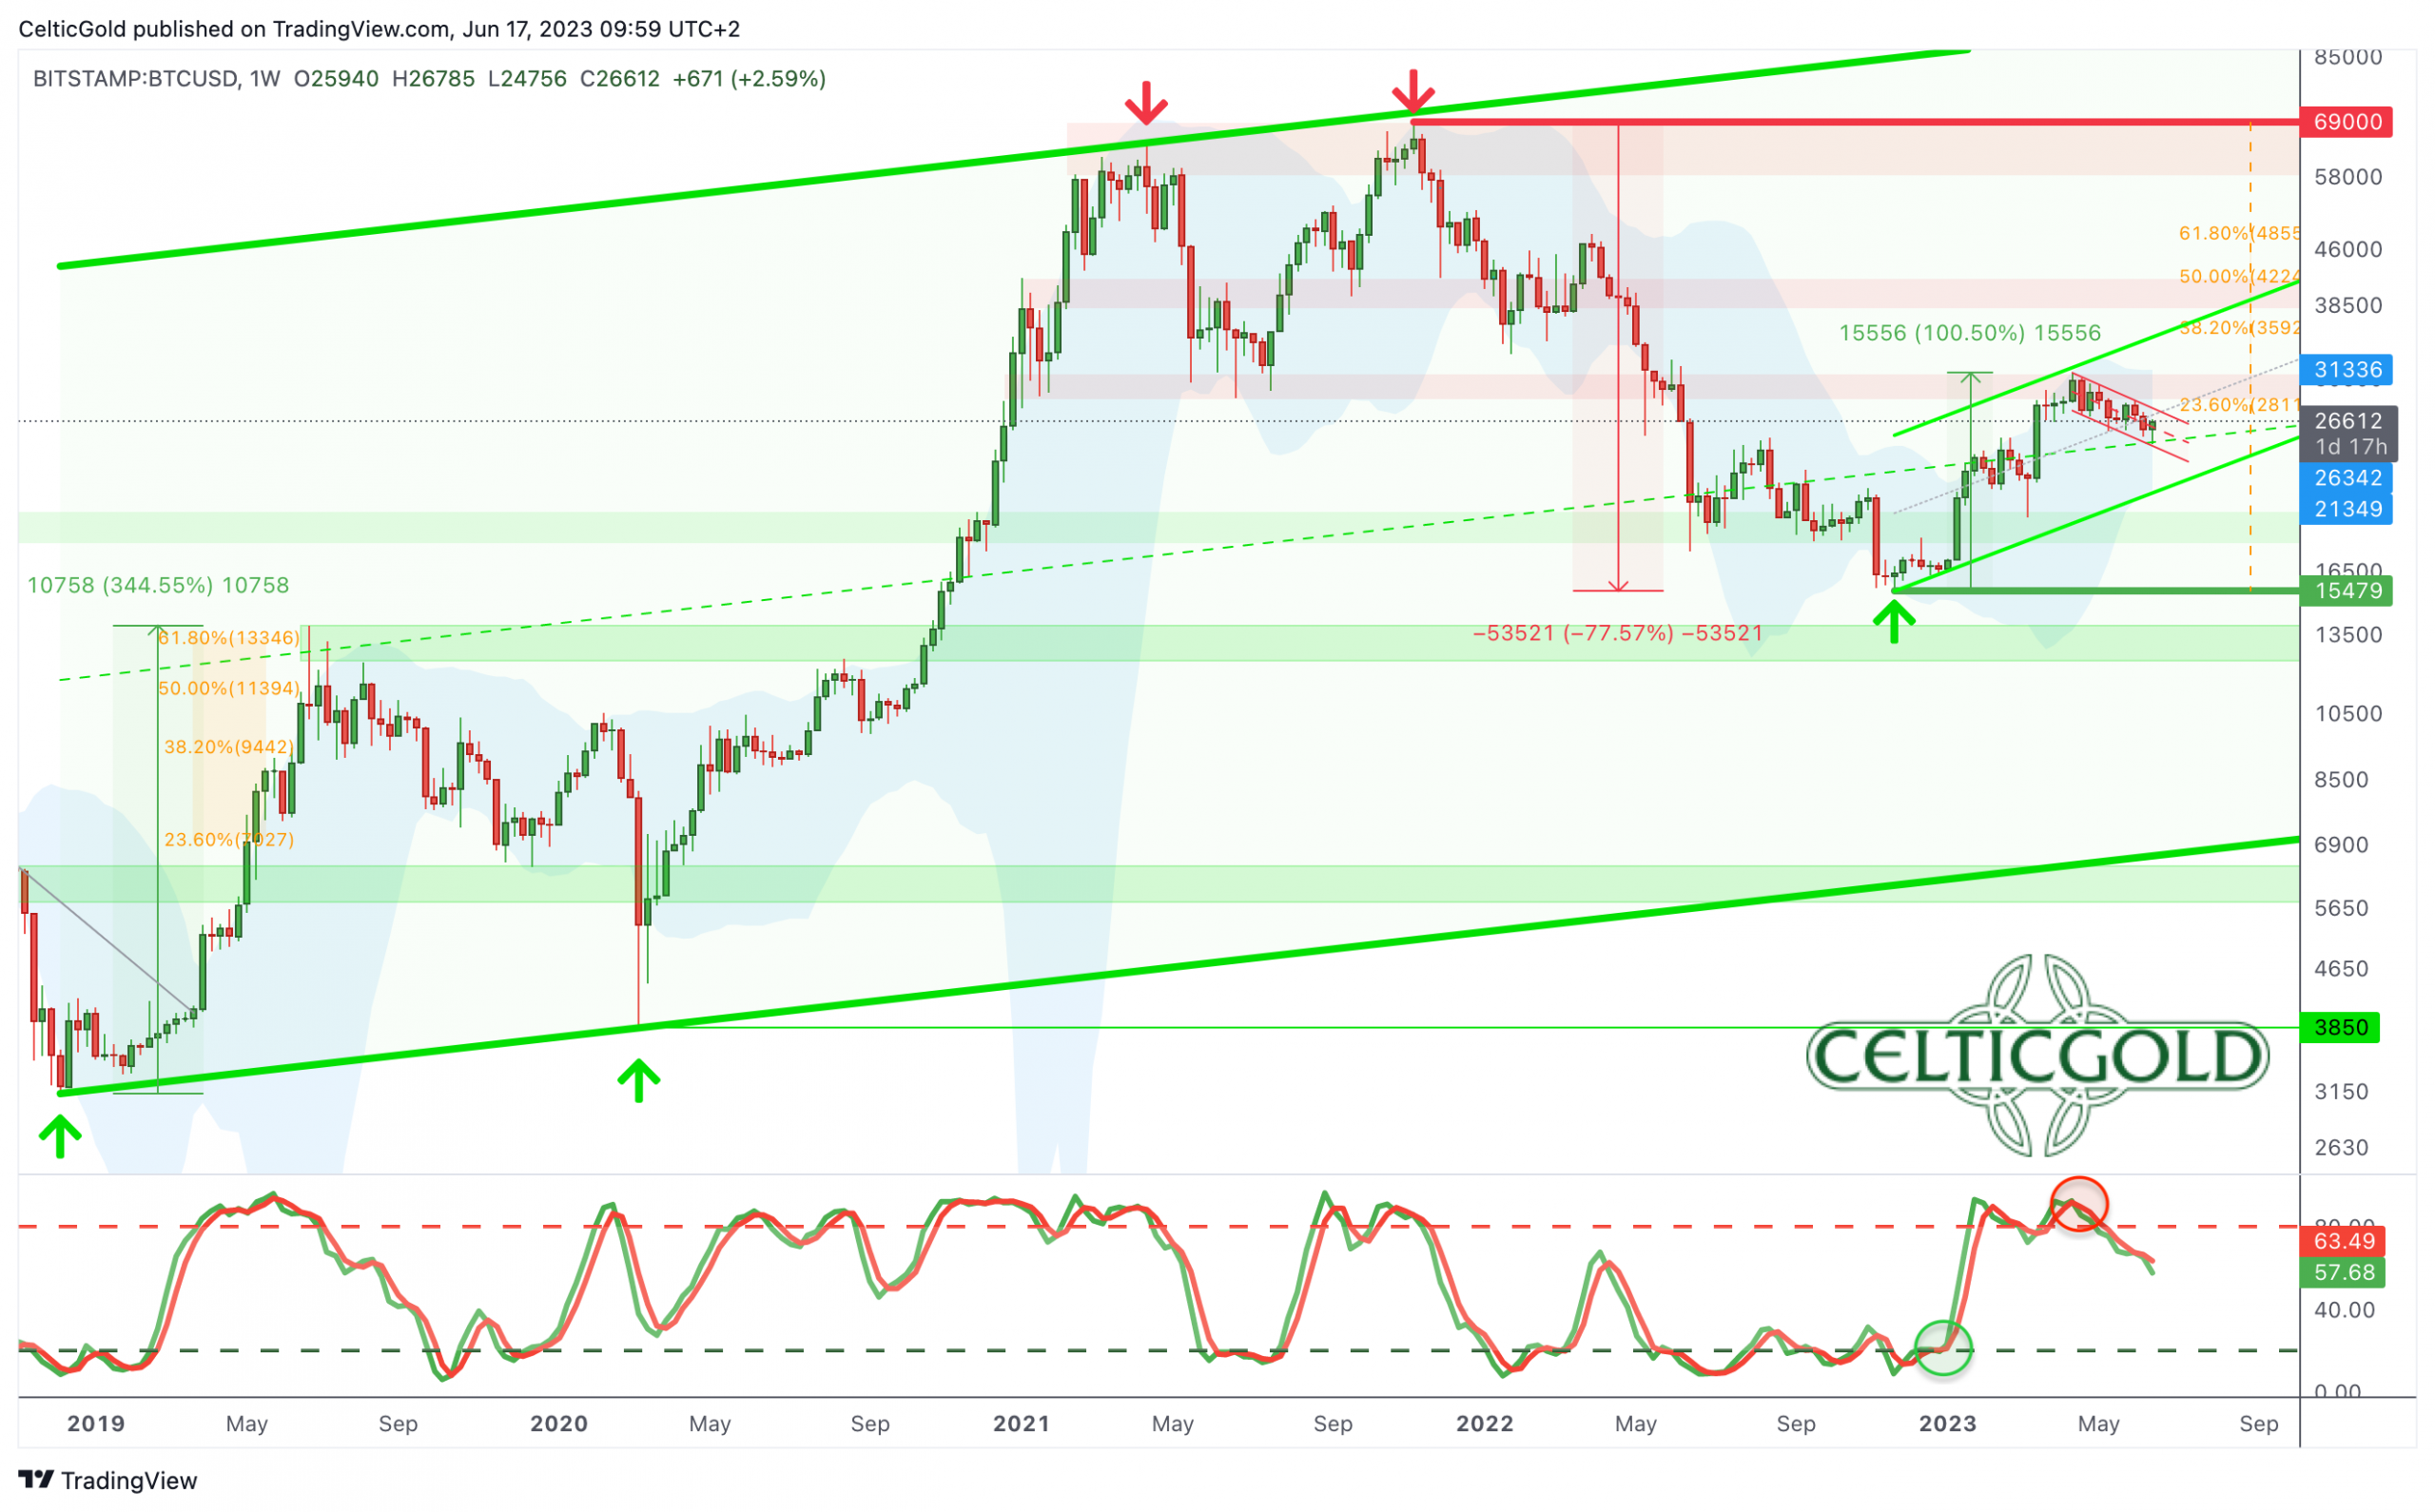
Bitcoin in USD, weekly chart as of June 17th, 2023. Source: Tradingview
Starting from its low point on November 21st at USD 15,479, Bitcoin was able to recover quite vigorously until April 14th. However, the bulls ran out of steam at USD 31,000, while crypto speculators indulged unabashedly in the meme coin hysteria surrounding Pepe and others. In hindsight, this was an unmistakable sign of the approaching end of the first wave of recovery and a short-term peak.
Although Bitcoin has retraced by 20.2% to USD 24,750 in the meantime, there was a clear lack of panic or a sharp wave. Instead, prices slid slowly and rather leisurely south for the last two months. However, the downtrend remains intact. Yet, the psychological level of USD 25,000, along with the mid-term trendline of the larger overarching uptrend channel, at least temporarily halted the bears’ progress.
However, a look at the weekly stochastic indicator still shows an established sell signal, and the oscillator still has plenty of room to move further down towards its oversold zone. Thus, the next strong support on the weekly chart is likely to be found only at the lower Bollinger Band (USD 21,352) and the lower edge of the uptrend channel (currently around USD 21,460 USD) of the past eight months.
In summary, the weekly chart is bearish, and a medium-term decline towards approximately USD 21,750 and USD 22,250 still needs to be anticipated.
Bitcoin Daily Chart – Reversal above the rising 200-day moving average
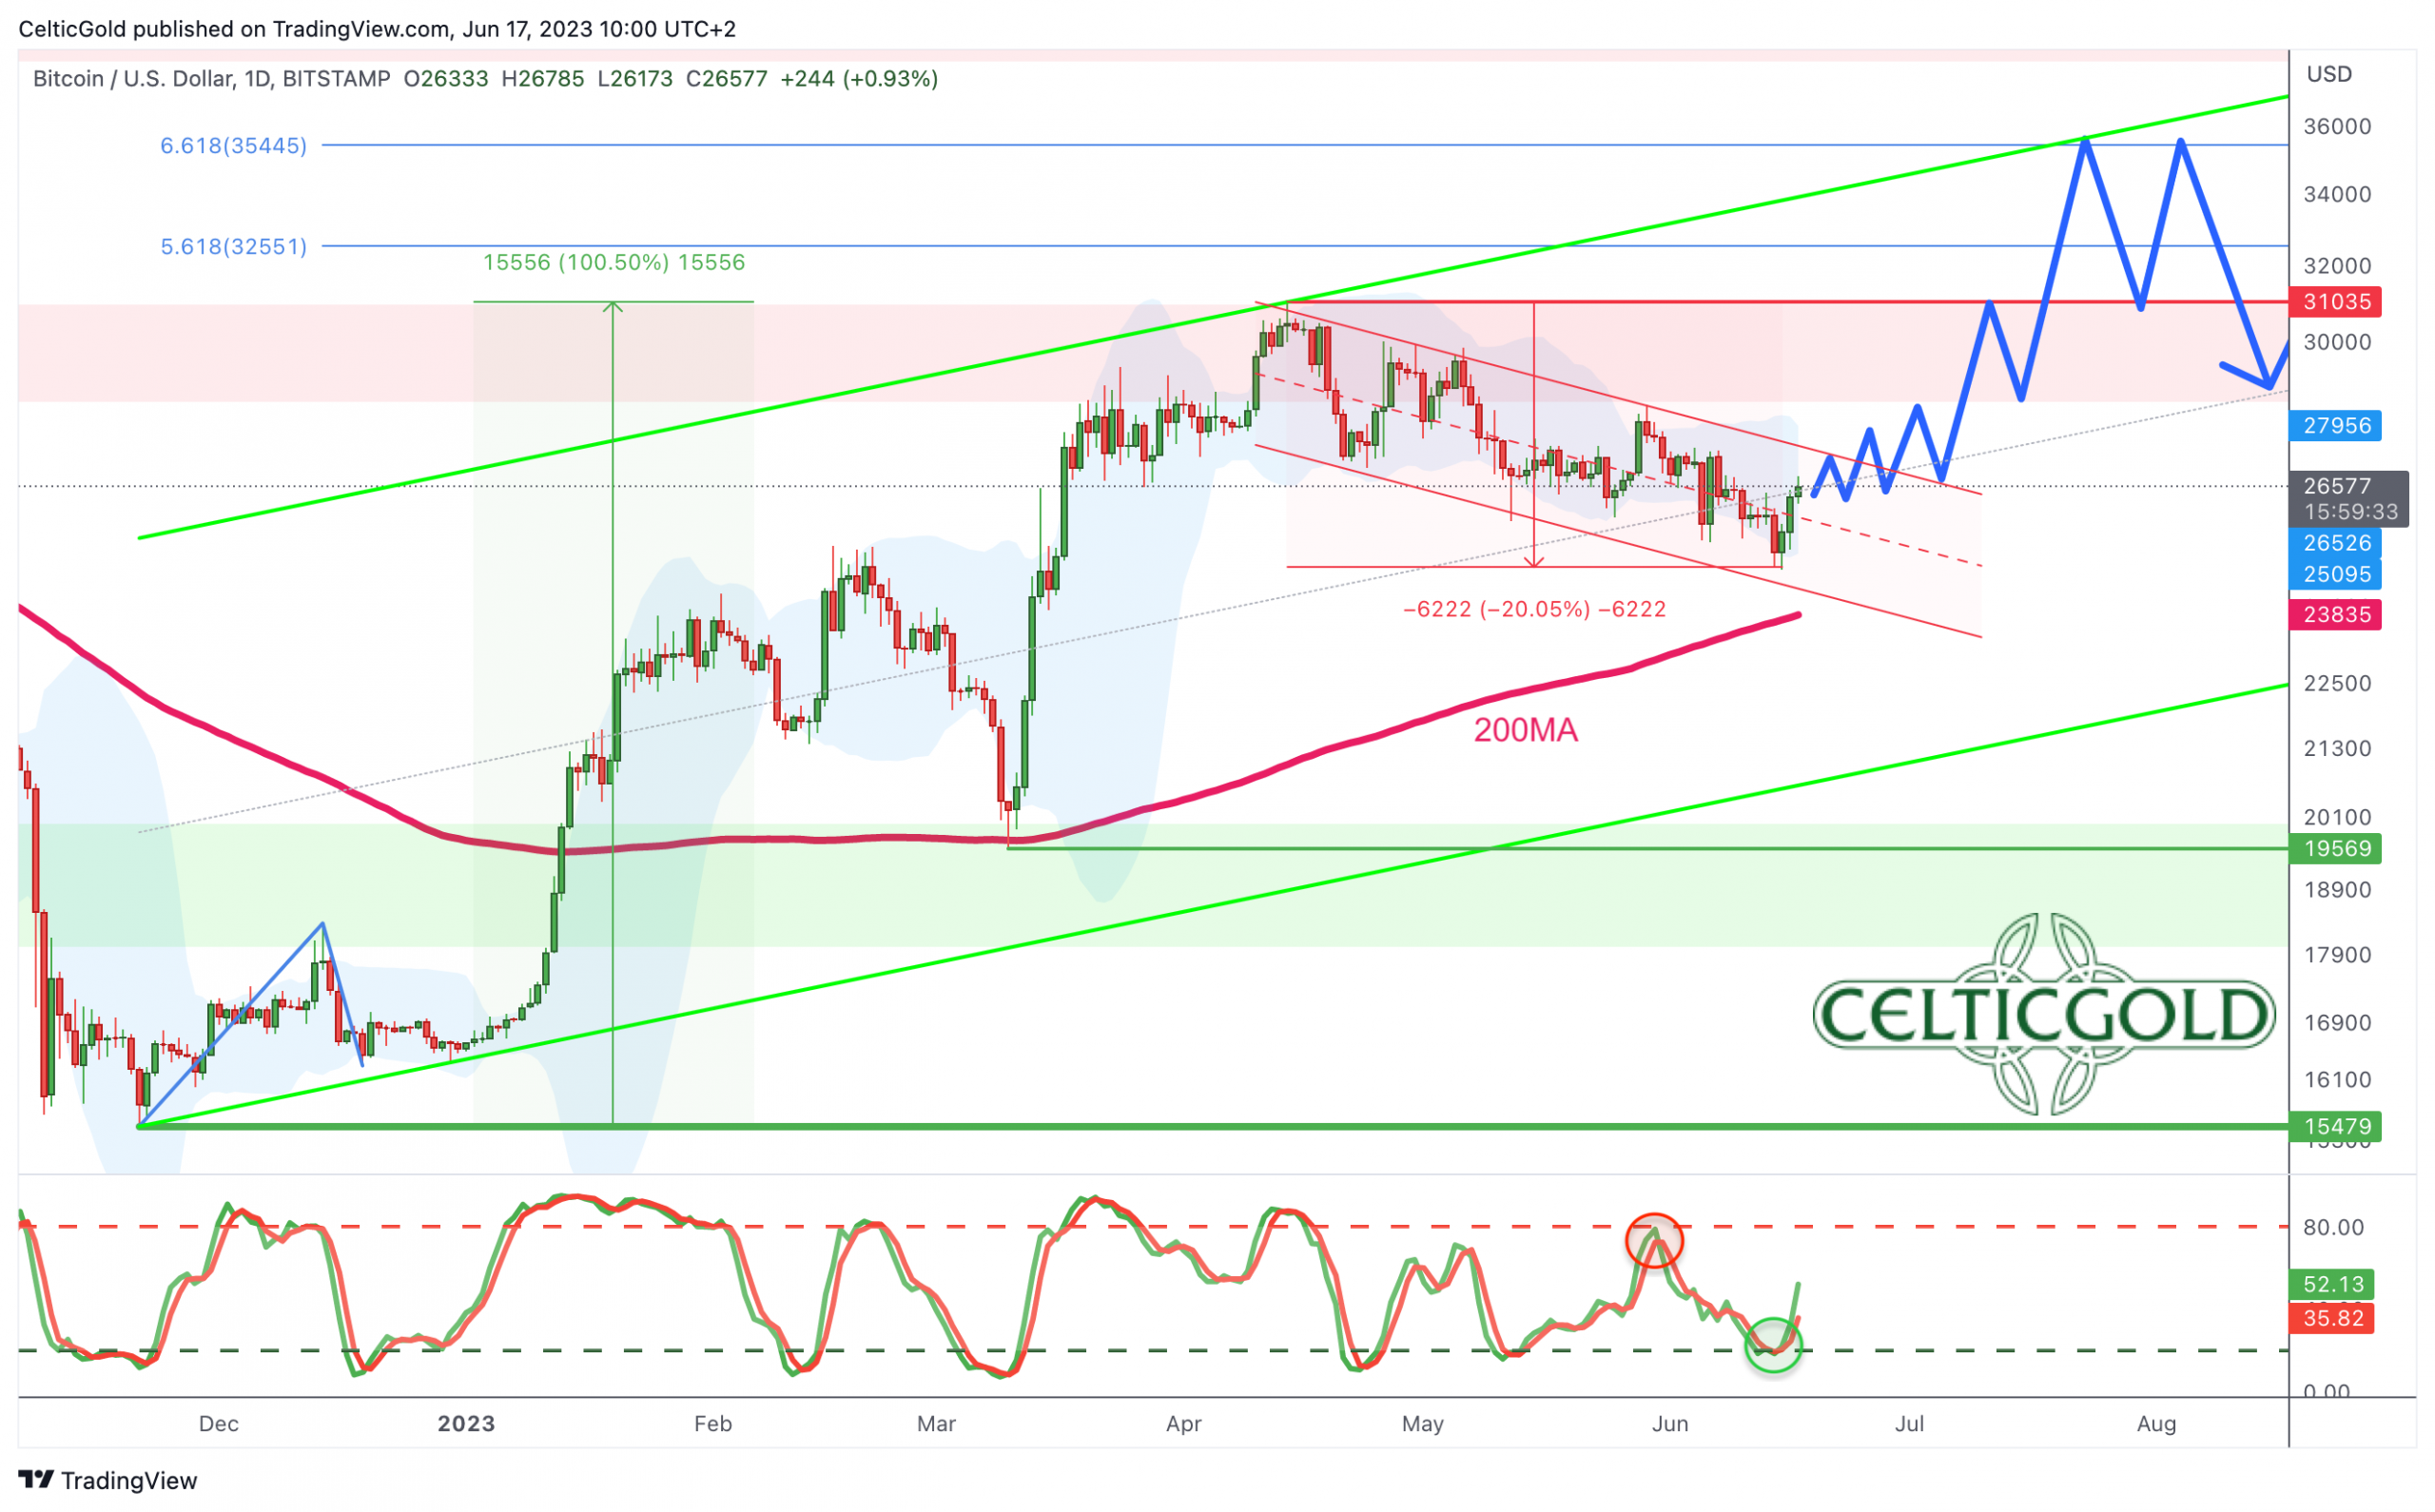
Bitcoin in USD, daily chart as of June 17th, 2023. Source: Tradingview
On the daily chart, a downtrend channel has formed over the last two months, which would currently allow the bears some room on the downside until approximately USD 24,200. At the same time, the 200-day moving average (USD 23,835) swiftly caught up with the current price action from below. A reunion with this widely watched moving average seemed highly likely. However, Bitcoin has already turned up before reaching it, and the daily stochastic indicator is showing a new buy signal. Immediate and significant price declines are therefore not likely in the near term, and the encounter with the 200-day moving average may have been postponed indefinitely.
Overall, the daily chart has switched to a bullish stance. The down-wave appears to have found its low point at USD 24,750. The ongoing recovery should provide us with more insight into the state of Bitcoin shortly. If a clear trend reversal and a breakout from the downtrend channel will occur with prices above USD 27,500, the path to the upside would be clear. Another attempt to break through the resistance zone between USD 29,000 and USD 31,000 could be possible in mid-summer already. However, if the ongoing bounce remains weak, the arguments for a continuation of the correction towards USD 22,500 and lower would strengthen.
Sentiment Bitcoin – New fantasy despite summer lull and uncertainties
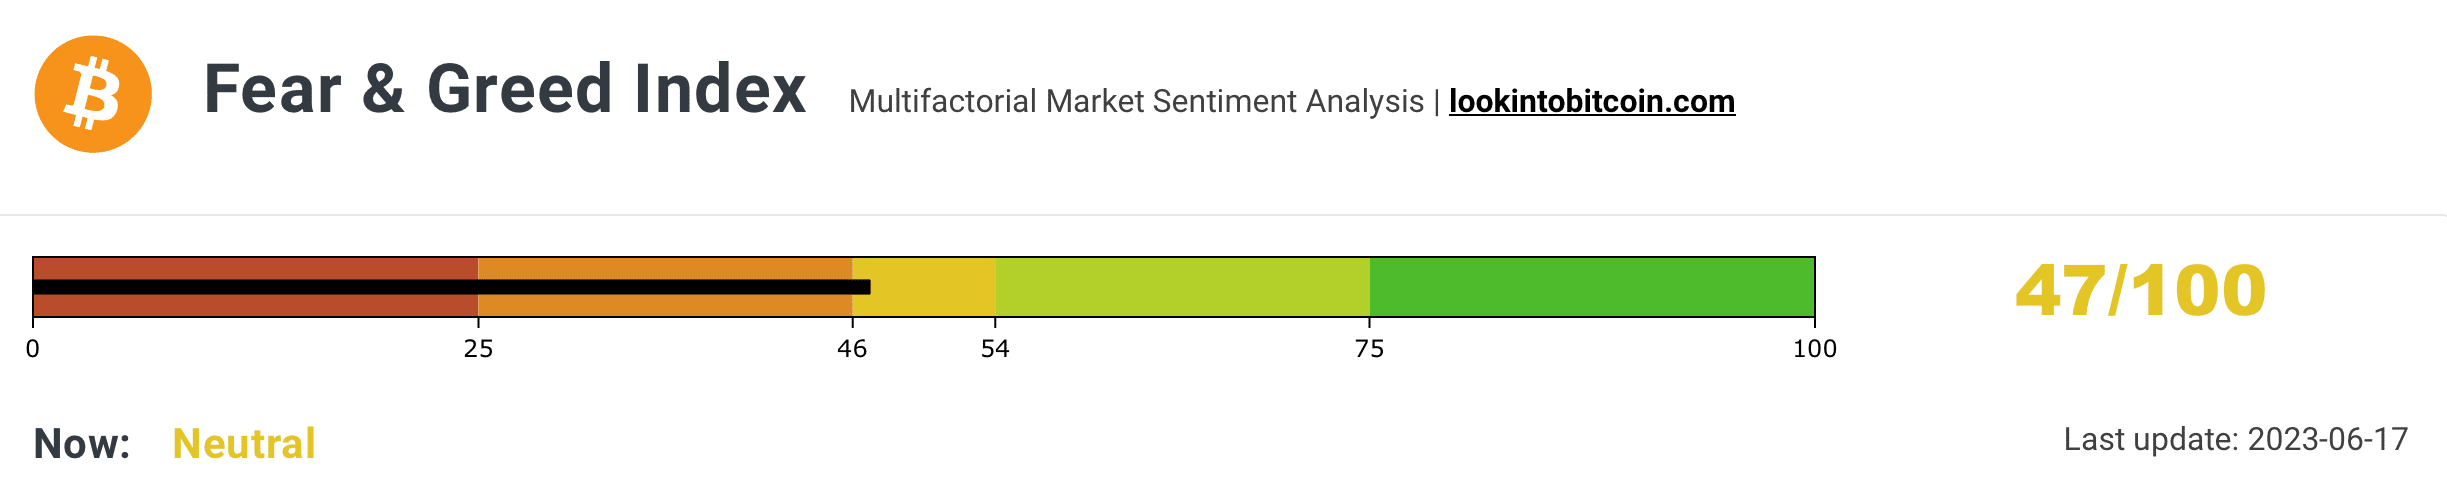
Crypto Fear & Greed Index, as of June 17th, 2023. Source: Lookintobitcoin
Sentiment in the crypto sector has cooled down in line with the declining prices in recent weeks. According to the “Crypto Fear & Greed Index,” the sentiment is neutral with a value of 47.
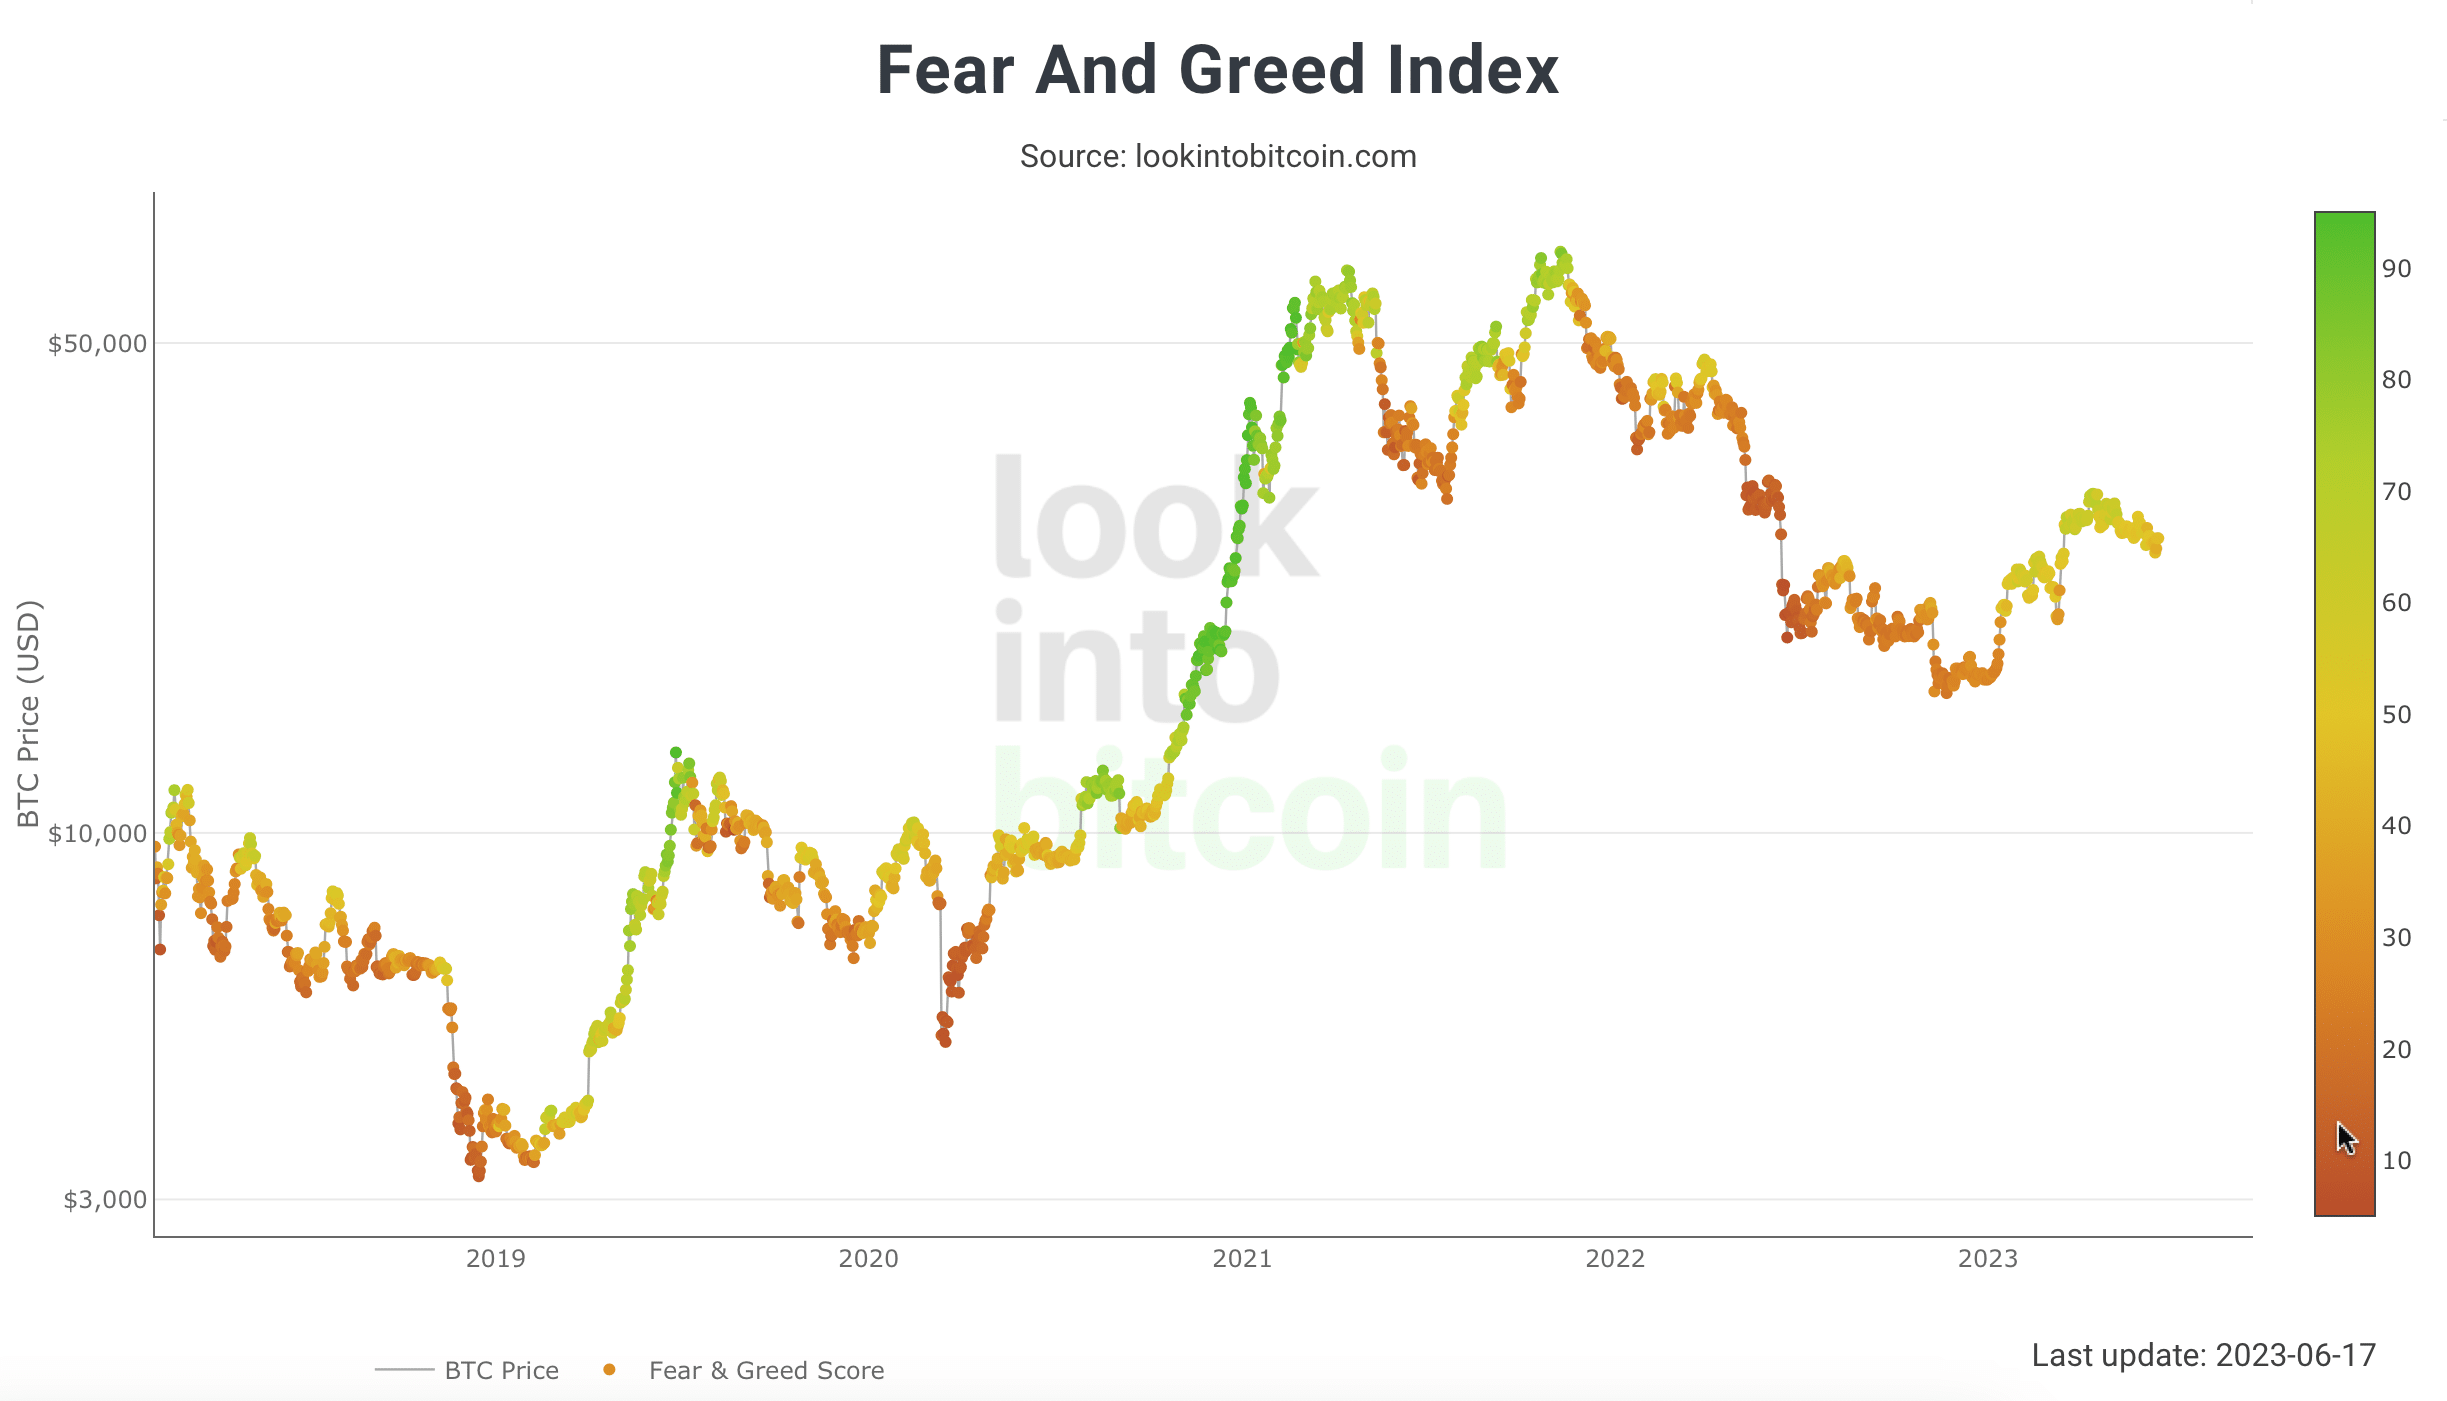
Crypto Fear & Greed Index long term, as of June 17th, 2023. Source: Lookintobitcoin
In the larger picture, the recovery wave in April already failed to reach extreme sentiment levels. Therefore, sentiment-wise, Bitcoin remains in a state of uncertainty. From this perspective, the end of the bear market cannot be declared yet, as the recovery movement between January and April was still relatively weak. At the same time, the current sentiment does not impede a continuation of the recovery.
Overall, Bitcoin is far from euphoria and excessive optimism. However, there is no contrarian buying opportunity due to high levels of fear and panic either.
Seasonality Bitcoin – Is the early summer rally starting now?
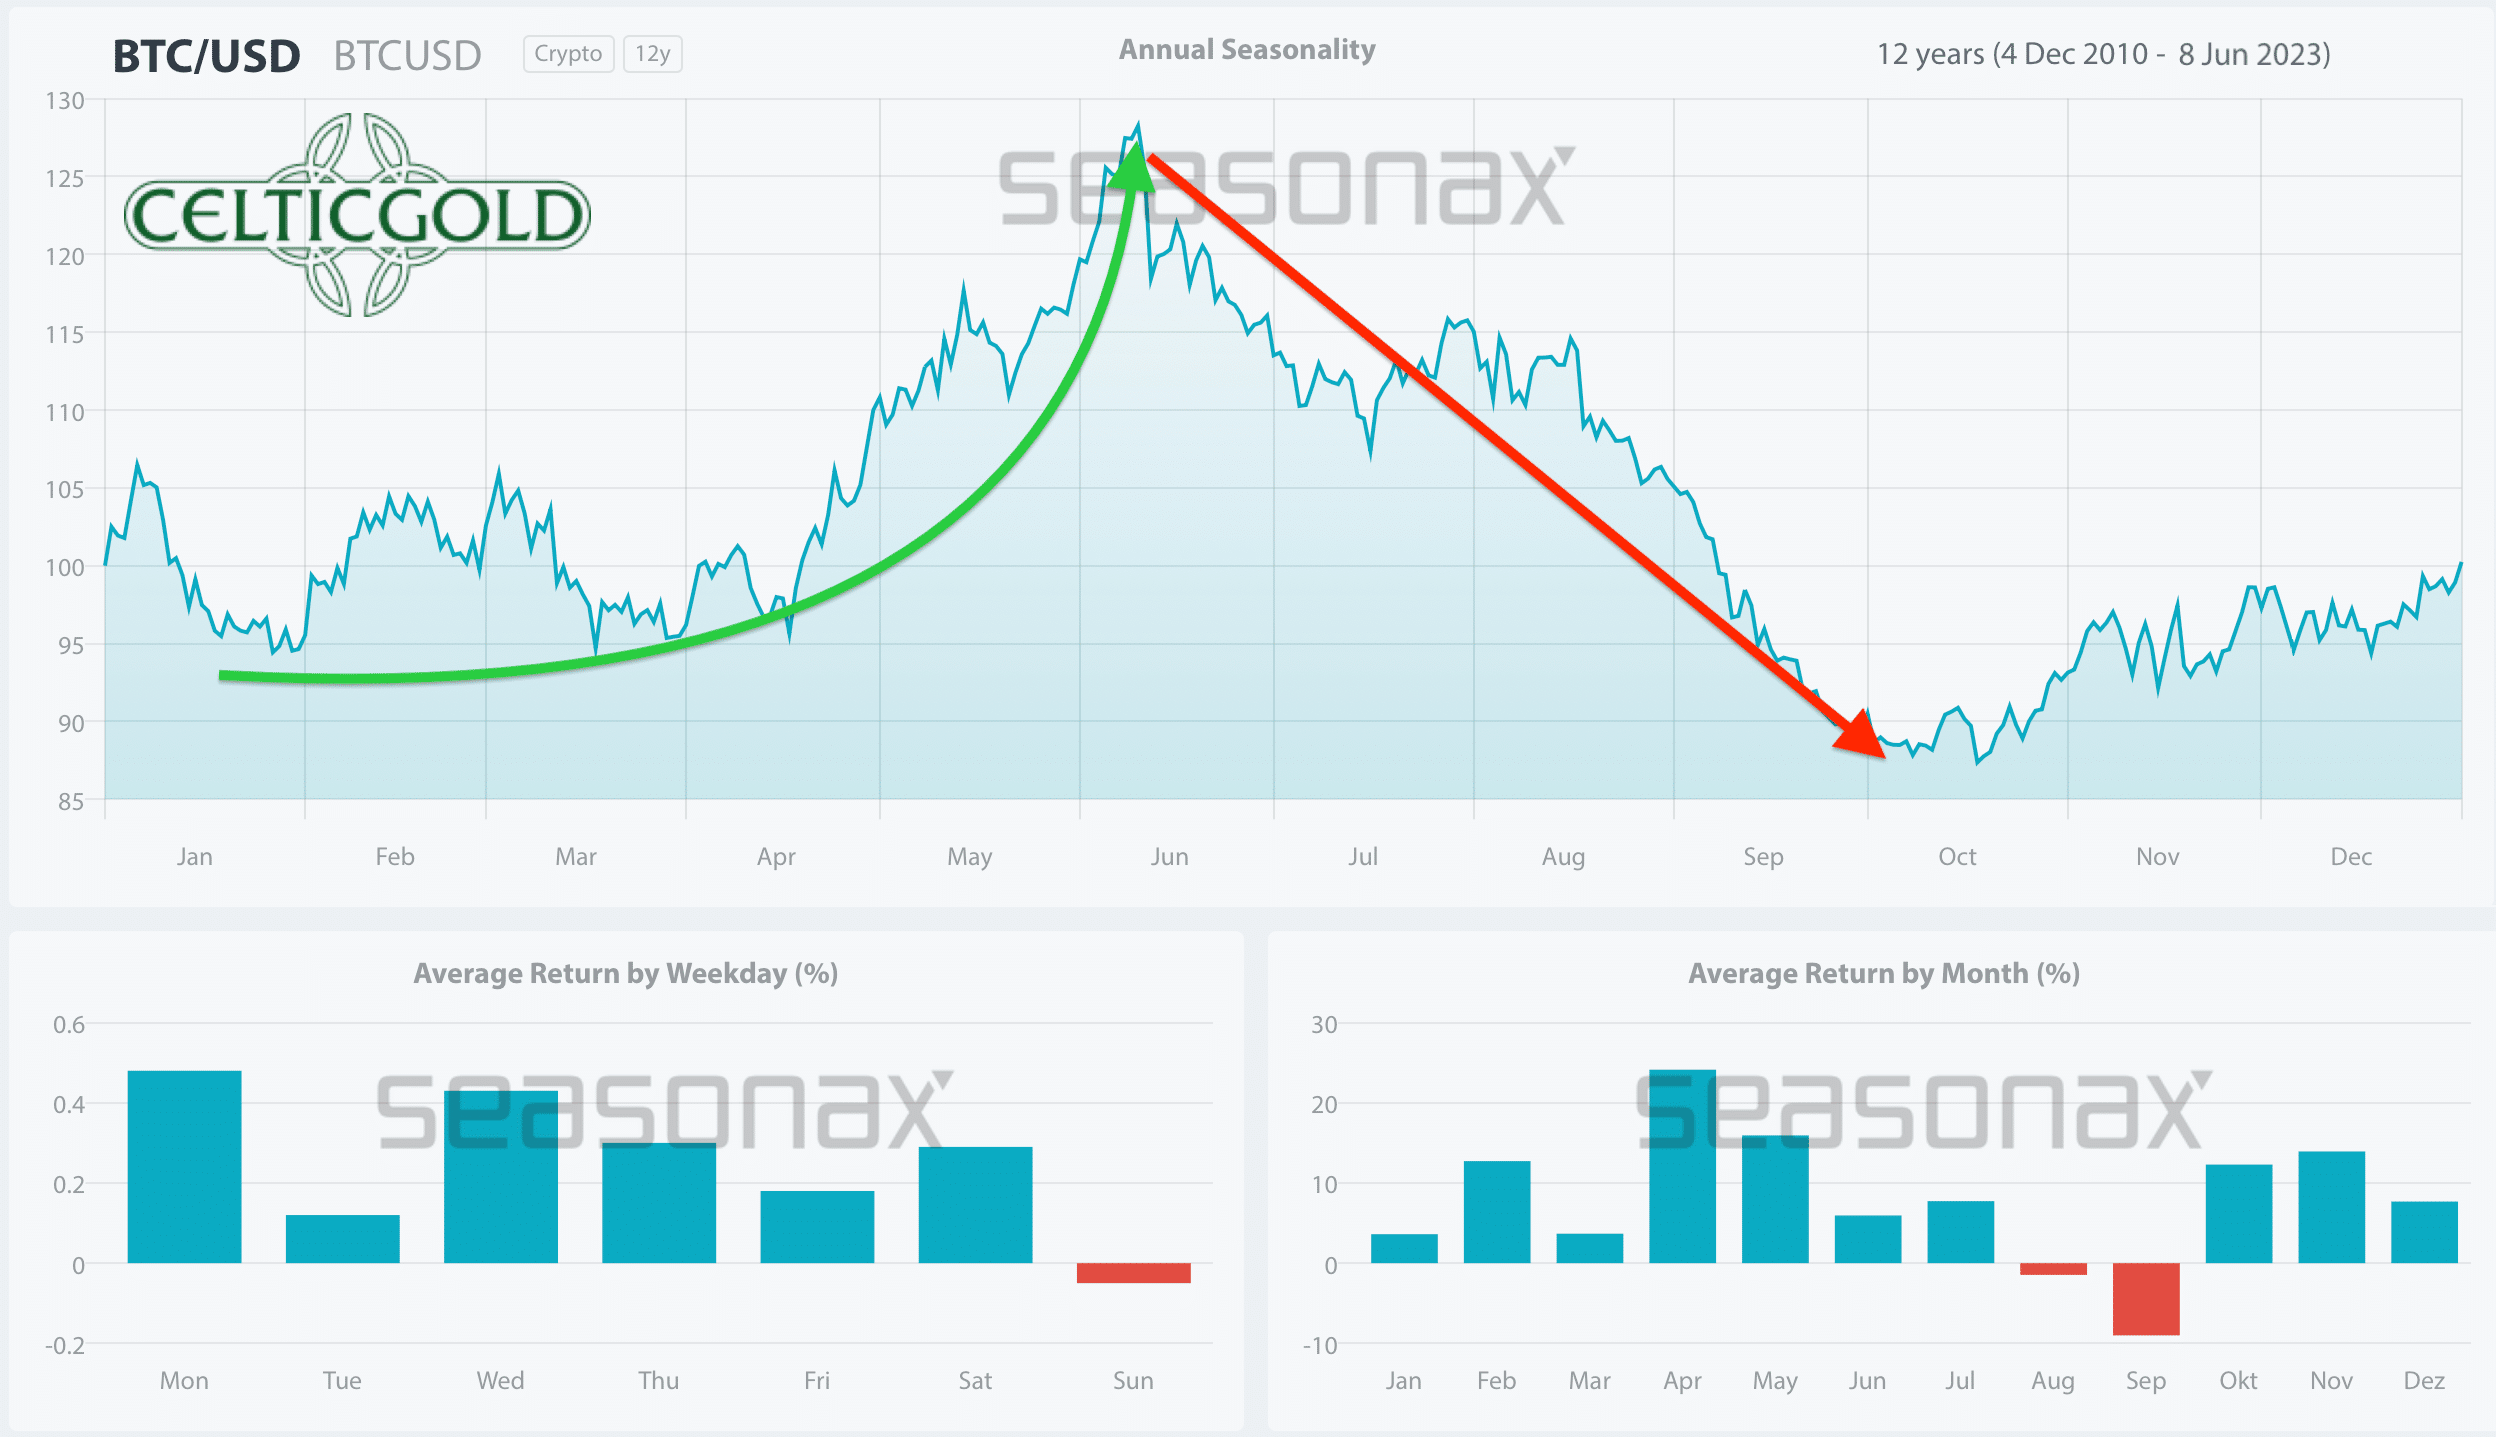
Seasonality for Bitcoin, as of June 8th, 2023. Source: Seasonax
The seasonal pattern has only partially played out this year, as Bitcoin reached its high point in April already and has been falling since then. Perhaps Mr. Gensler disrupted the typical rally in May and June. However, the recovery of the past two days may have now provided the delayed start signal for the strength phase in early summer. In that case, the next two months should deliver a strong rally in the sector.
Alternatively, if we stick to the early peak in April, according to the seasonal statistics, an average correction of approximately four months should follow. In this scenario, Bitcoin may potentially reach an important low point not before early August.
Overall, the current situation actually contradicts the seasonal pattern, which would be unfavorable from now until autumn. However, it’s possible that this year, the typical rally between mid-April and mid-June simply occurs two months later.
Sound Money: Bitcoin vs. Gold
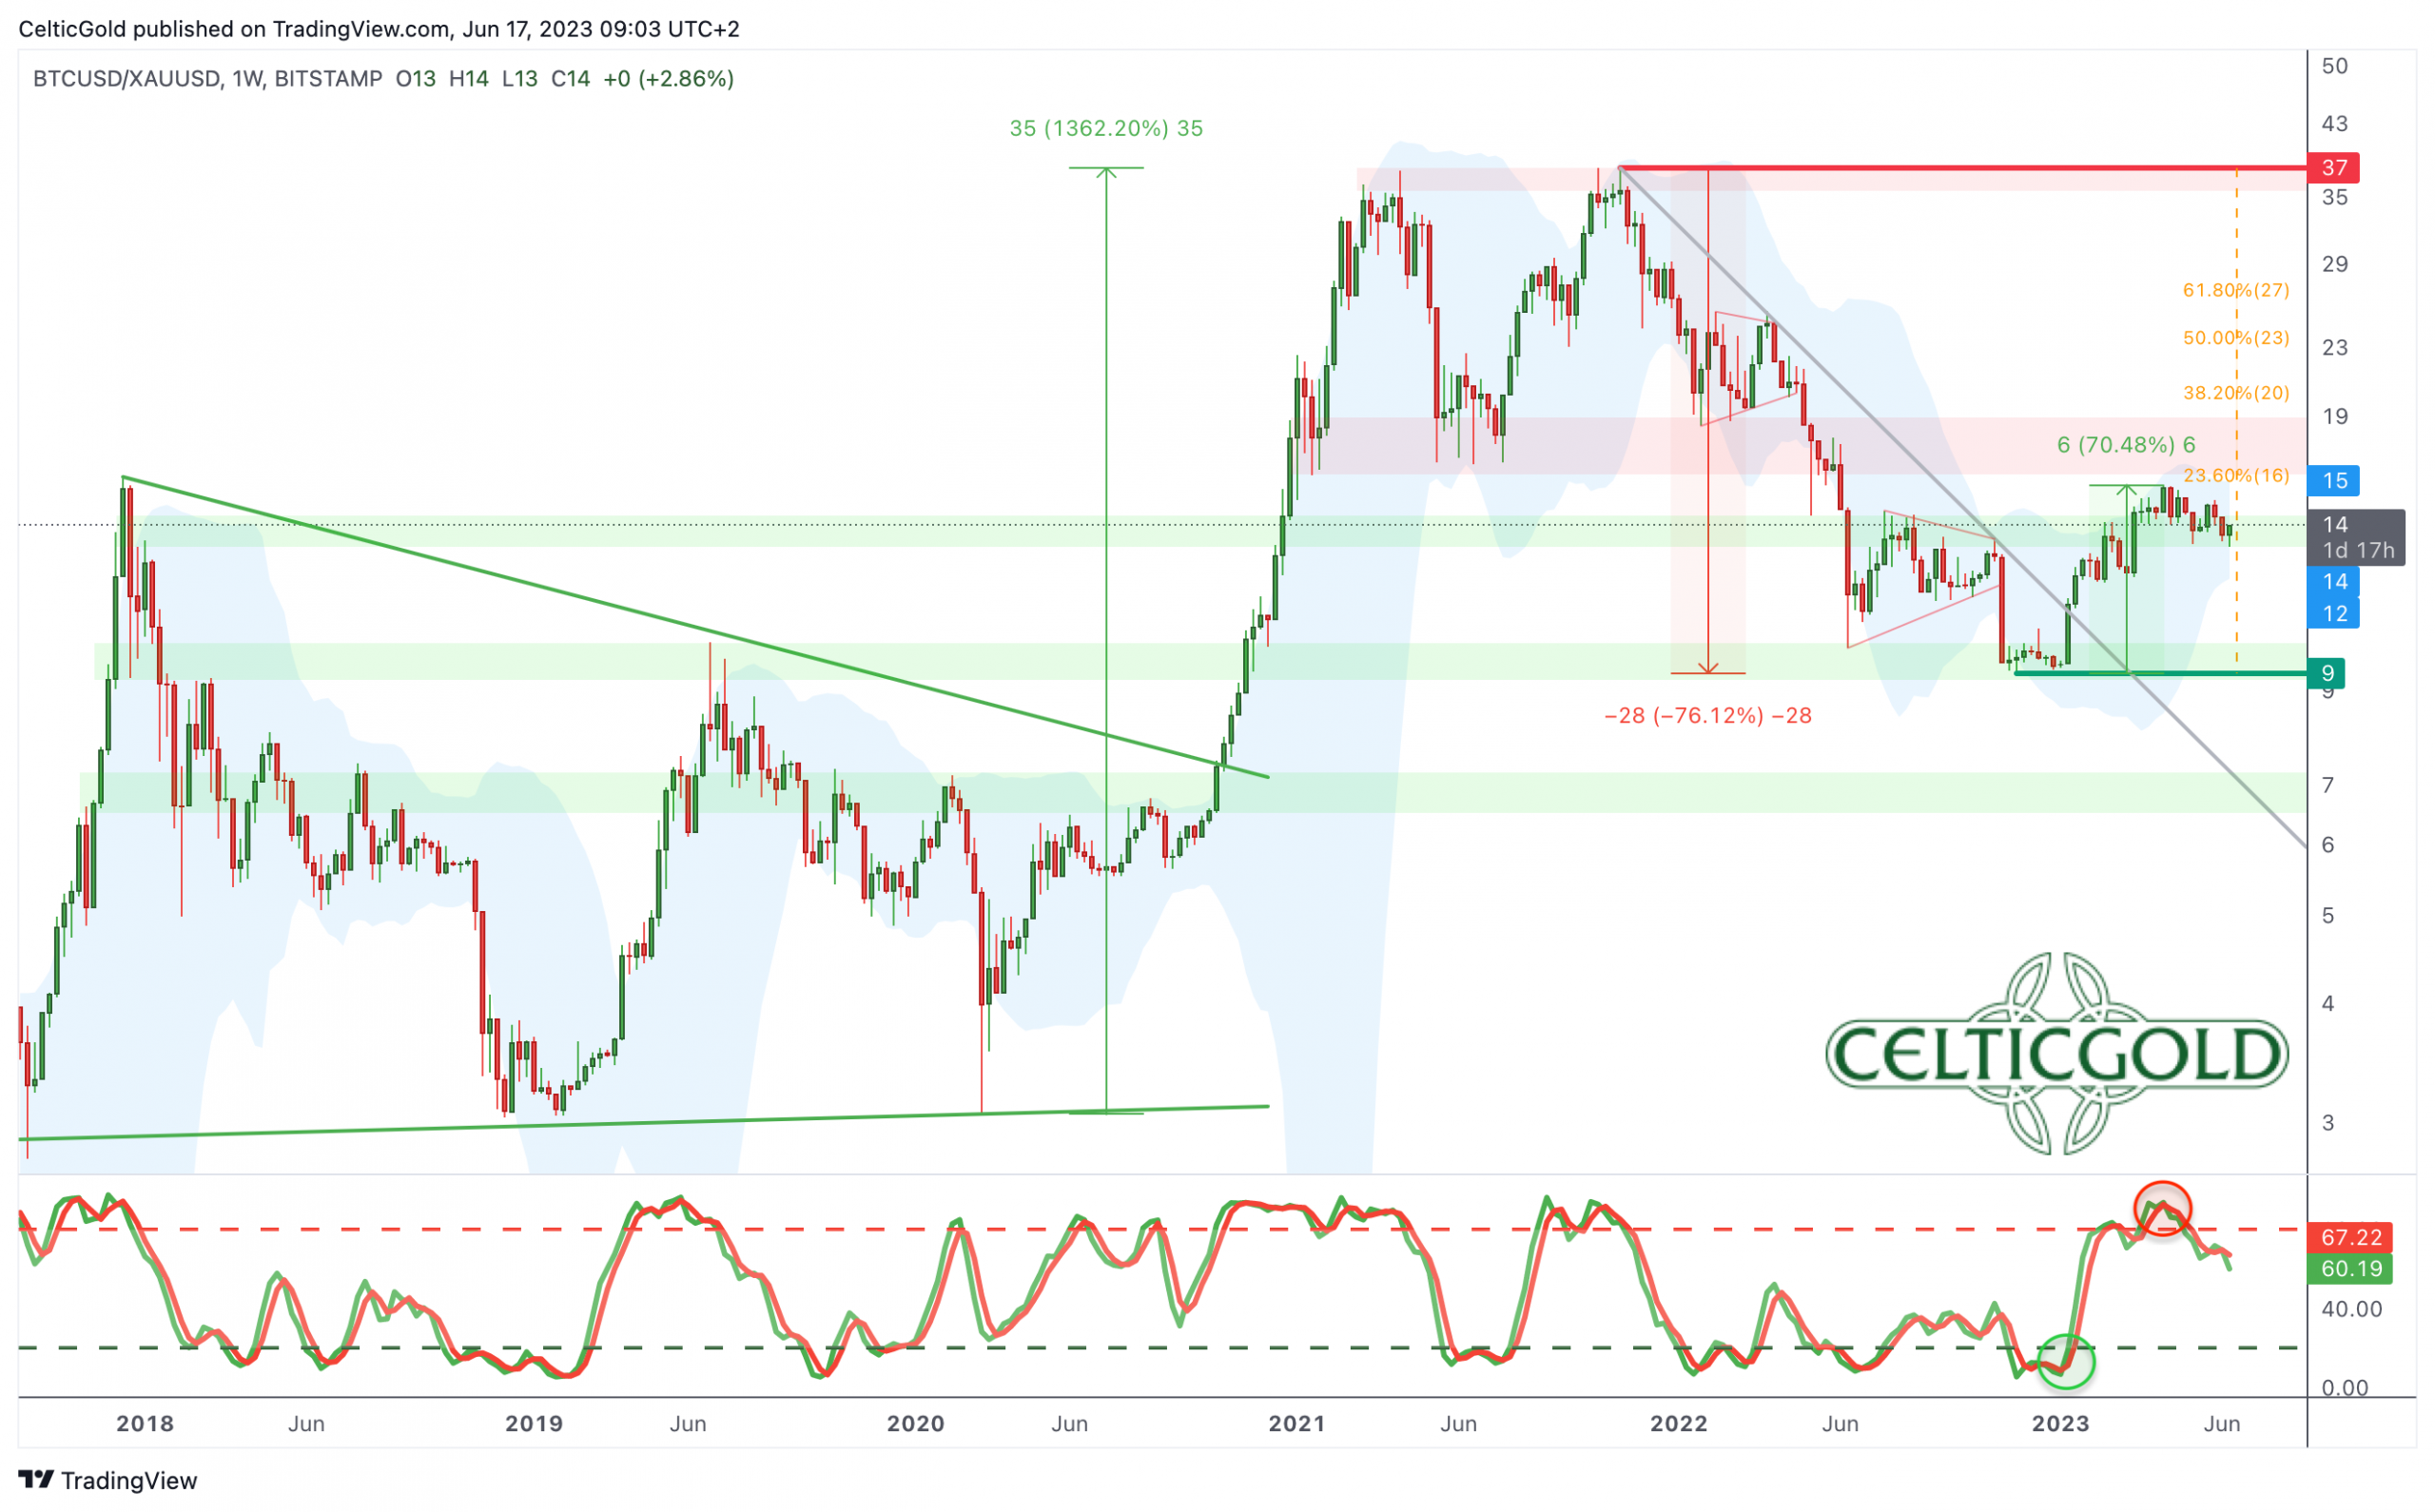
Bitcoin/Gold-Ratio, weekly chart as of June 17th, 2023. Source: Tradingview
In spring, Bitcoin reached its peak more than three weeks before gold. During the recovery, the Bitcoin/Gold-ratio initially climbed to 15.25. With Bitcoin trading at around USD 26,650 and gold at USD 1,957, currently, one Bitcoin costs approximately 13.62 ounces of gold. Vice versa, one ounce of gold currently costs about 0.073 Bitcoin. Overall, since the beginning of the year, Bitcoin has clearly been the faster horse, outperforming gold by a factor of 10!
During the correction, the ratio recently dropped back to 12.8. However, since Thursday, Bitcoin has been turning upwards again, and the recovery since the beginning of the year may continue. Additionally, the lower Bollinger Band on the weekly chart opposes significantly lower ratio values (below 12). Therefore, for those who wish to adjust their “safe haven” allocation in favor of Bitcoin, now, or at ratio values around 12, would likely be a suitable time to do so.
In summary, the Bitcoin/Gold ratio has corrected as expected. Although the weekly stochastic indicator is far from being oversold, we anticipate a recovery over the next two months, with ratio values around 15.
Macro Update – Deceptive calmness
After numerous bank collapses in March, which even led to a bank run in the U.S., the situation has significantly calmed down in recent weeks.
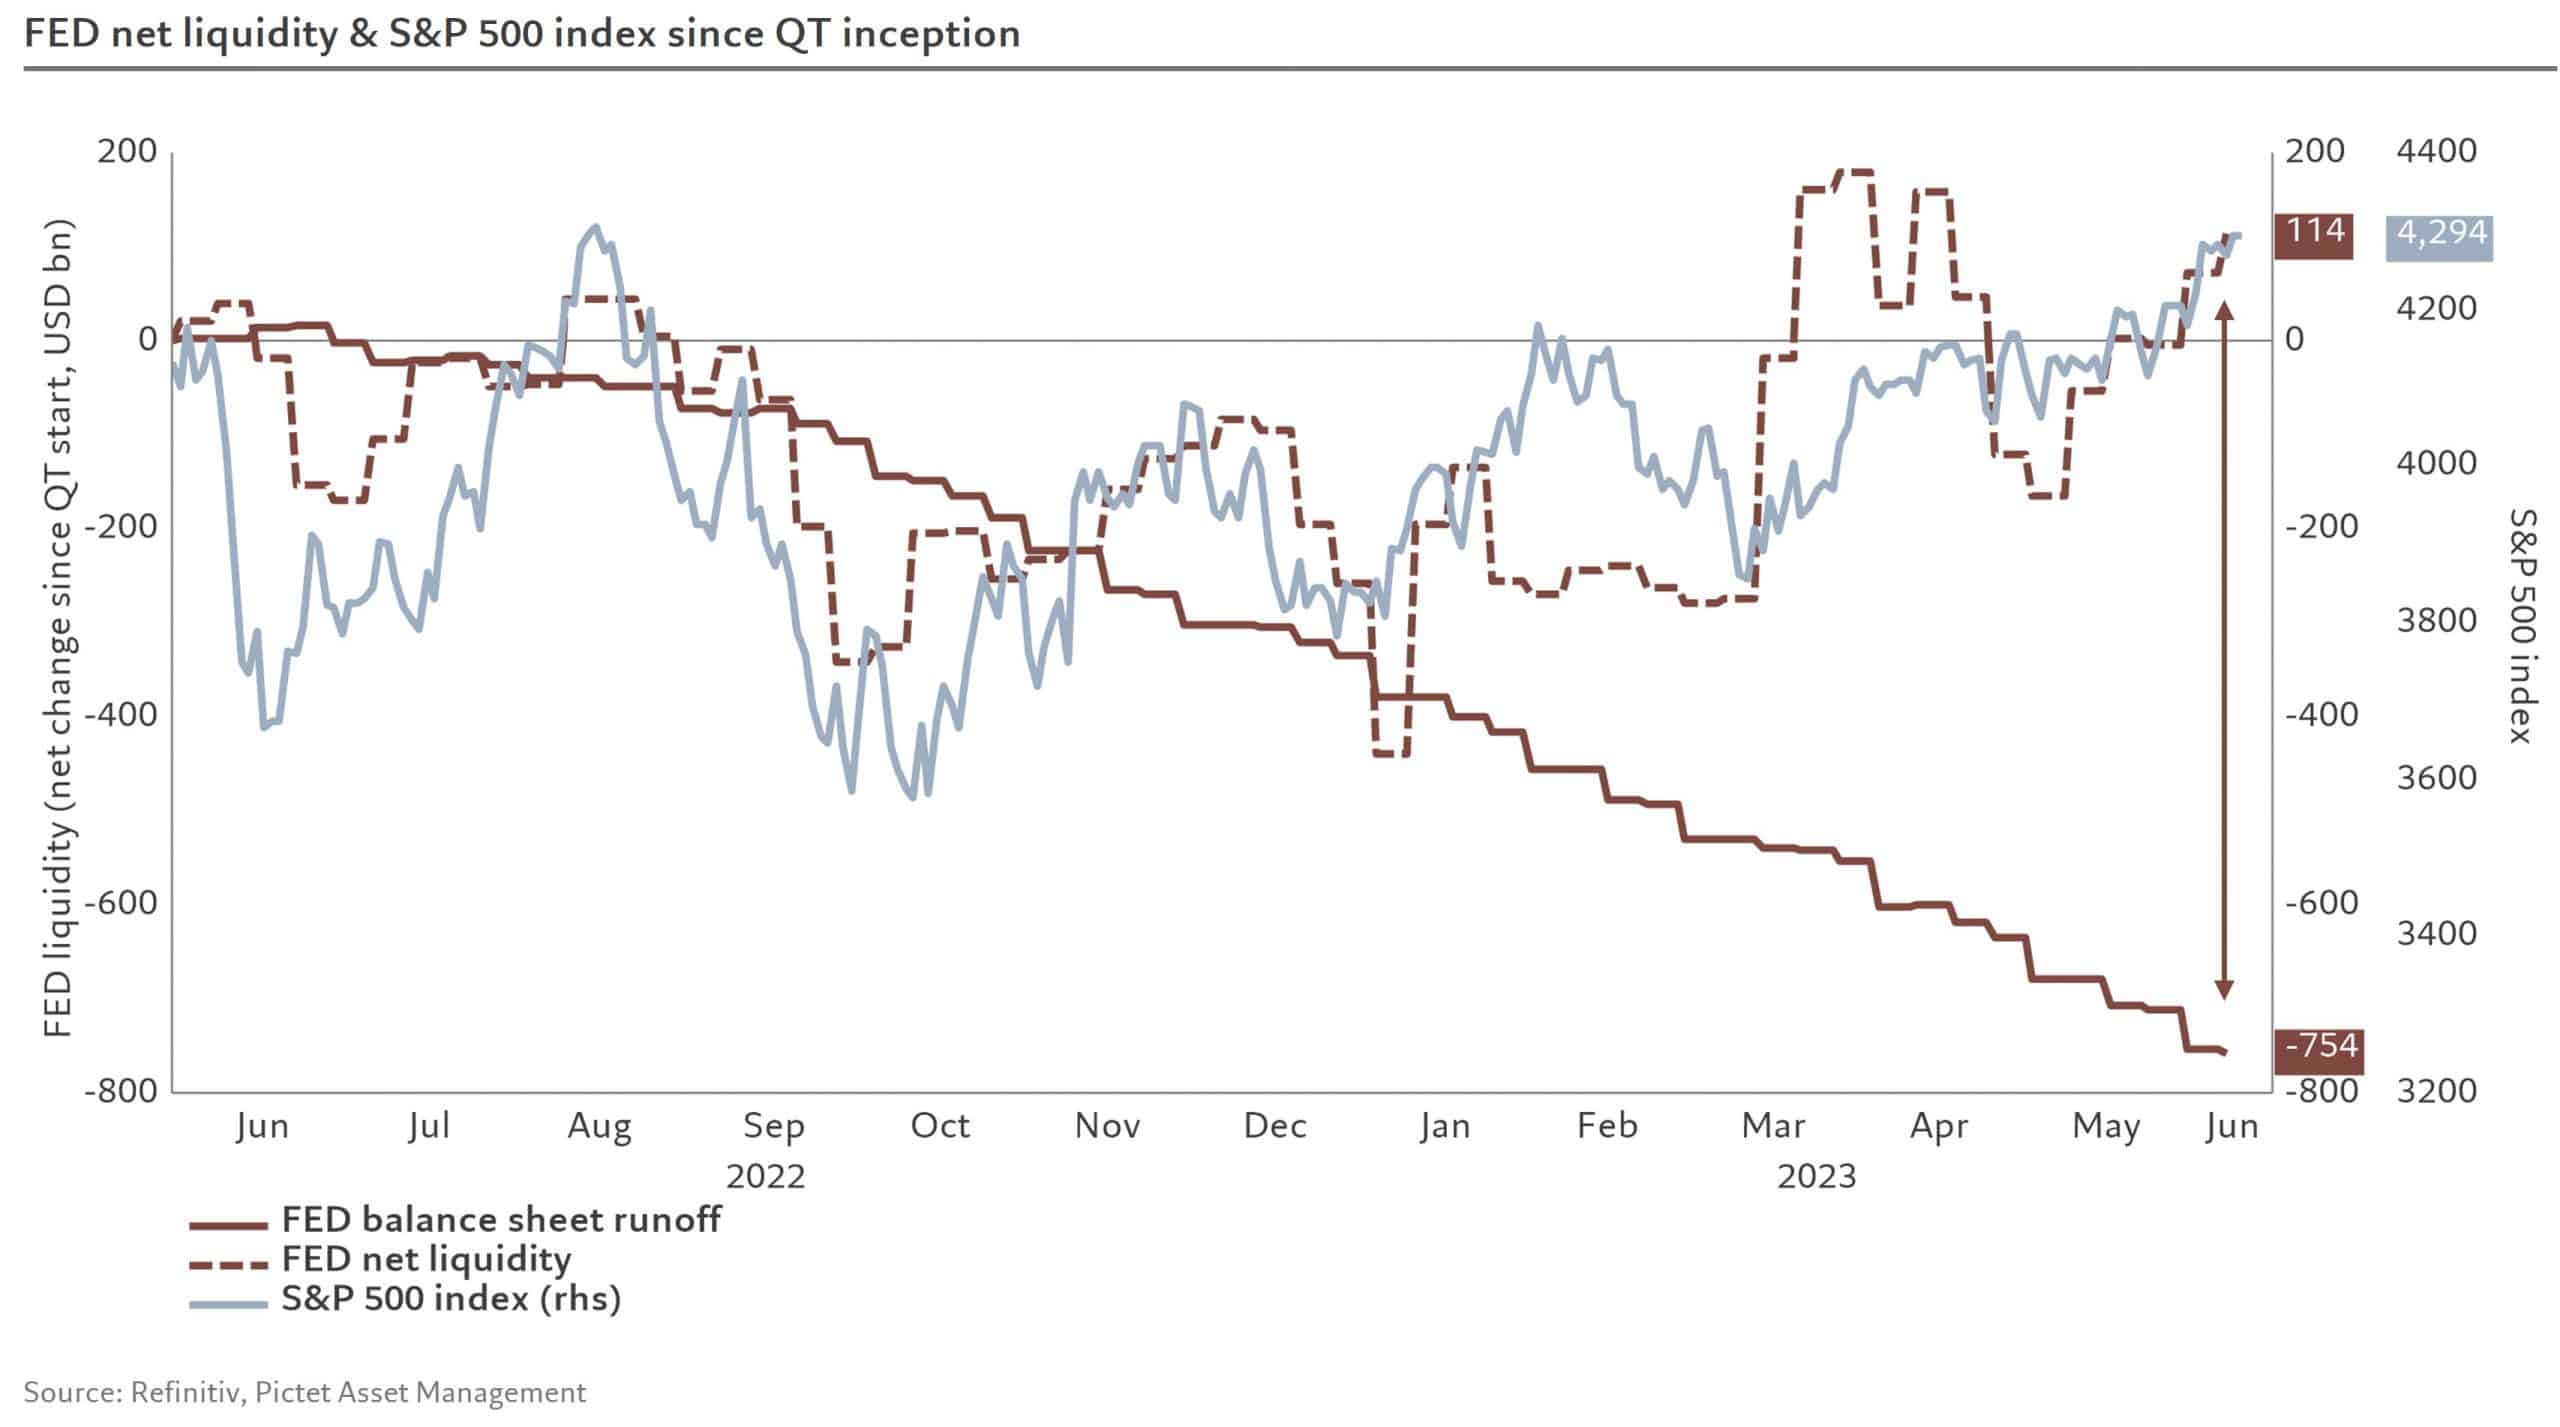
FED balance sheet vs. net liquidity vs. S&P 500, as of June 9th, 2023. Source: Pictet Asset Management
The reason for this deceptive calmness can be attributed to massive liquidity injections (Bank Term Funding Program) by the American central bank. Instead of implementing the planned “Quantitative Tightening” of USD 750 billion, there is now, in essence, a form of “Quantitative Easing Light” of approximately USD 100 billion! The increase in net liquidity is a result of US banks being able to borrow from the Federal Reserve (FED) at a credit cost of 5% interest per year to cover their significantly decreased bonds at USD 1.00 instead of their real value of USD 0.50. While this credit incurs interest, it has temporarily pushed the problem into the future and avoided a liquidity crisis. This is why the stock markets are rising, as the S&P500 is up more than 27.5% since last November. No doubt, the crack-up boom is underway!
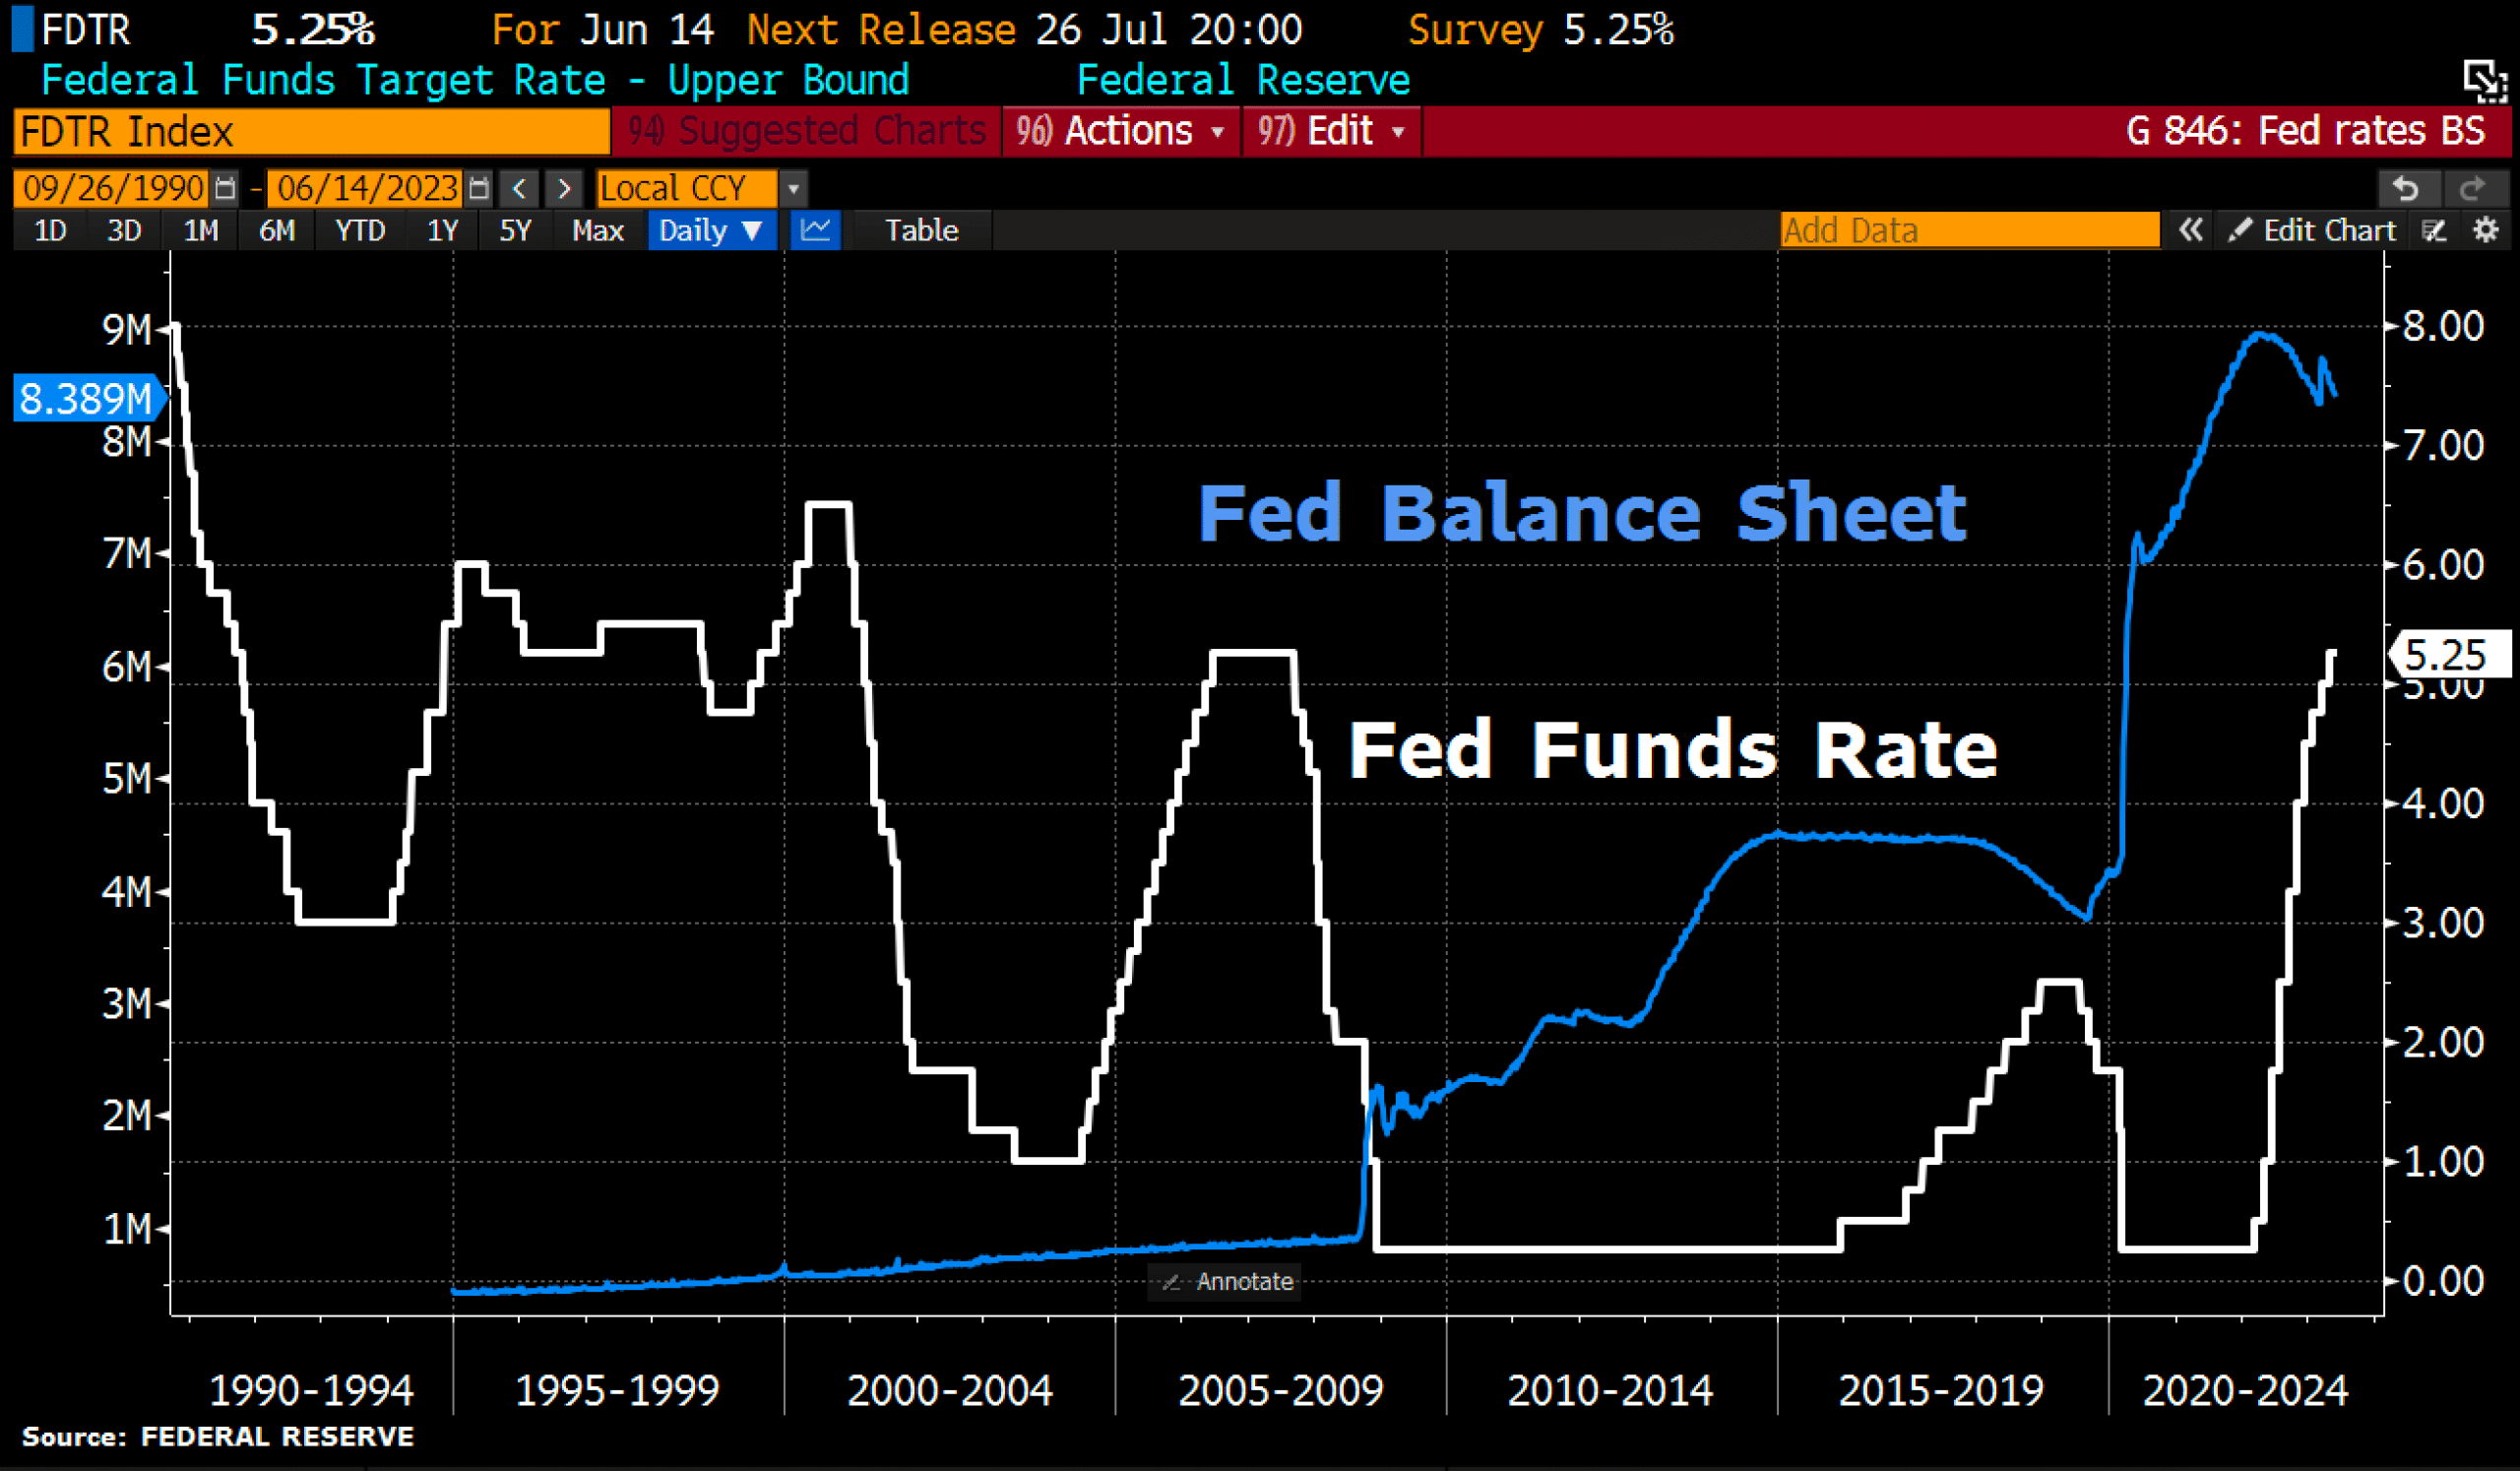
US FED balance sheet vs. FED funds rate, as of June 14th, 2023. Source: Holger Zschaepitz
Last Wednesday evening, the FED decided not to further increase interest rates after more than a year of aggressive hikes. However, Federal Reserve Chairman Powell indicated that the pause may only be temporary, as the Fed implies two more 25 basis points rate hikes later this year.
With its rigorous tightening cycle, the FED has already shattered the porcelain. The hastily concocted rescue programs since March have only masked the problems, while a massive smoldering fire continues to burn behind the scenes of the financial system.
Hiking cycle brought the end of easy money
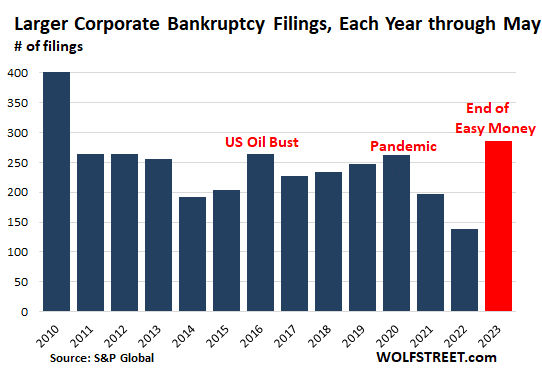
Bankruptcy filings in the US, as of June 7, 2023. Source: S&P Global
For those who make the effort to seek facts beyond the mainstream, they will discover, for example, that the number of bankruptcy filings in the US this year has reached the highest level since 2010.
The underlying reason is that the increased interest rates have made debt much more expensive. Additionally, the investors who are supposed to buy these debts have become more cautious because the easy money, once abundant due to the low interest rates, is no longer readily available. However, once companies become reliant on easy money to sustain themselves due to high debt levels, it becomes challenging to break free from this dependency. In a way, the economy is normalizing with interest rates typical of the pre-QE era. But companies that could survive only because of easy money are now feeling the pressure.
Commercial real estate is the next shoe to drop
Furthermore, the next storm is brewing, particularly in the US commercial real estate sector. Currently, numerous US banks are hurrying to reduce their exposure to this sector due to an imminent wave of payment defaults. PacWest recently sold a construction loan portfolio worth USD 2.6 billion at a significant loss, while HSBC is seeking to sell hundreds of millions of dollars in commercial real estate loans as quickly as possible. Many regional lenders, in particular, may have to consider selling commercial real estate loans at a substantial discount. As the sales gain momentum, the downward spiral accelerates, further depressing property prices. It is likely that nearly half of the 4,800 American banks have already depleted their capital buffers and are potentially insolvent.
Meanwhile, vacancy rates in offices and retail stores in San Francisco for example continue to soar, while safety concerns and drug abuse deter tourists and visitors. The city could become one of the epicenters of the next apocalypse. Recently, Unibail-Rodamco-Westfield and Brookfield Corp. had to transfer ownership of the city’s largest shopping center to the lender after they were no longer able to make payments on the USD 558 million loan. Park Hotels & Resorts Inc. has also halted loan payments for two downtown hotels with outstanding debts totaling USD 725 million.
A wave of payment defaults and bankruptcies is looming
The boom-and-bust cycle will continue, as the tightest policies from the FED and the European Central Bank (ECB) in 15 years collide with high levels of debt and adventurous derivative structures. The foreseeable wave of payment defaults in the US and Europe will also hit the real economy hard, with default rates possibly not peaking before the fourth quarter of 2024 or even later.
In the past, the FED halted its aggressive interest rate hike cycle back in June 2006. However, the major financial crisis only began a year and a half later! Therefore, the financial markets are facing challenging times ahead. While the buzzword “AI” is currently celebrated in the stock markets, the low volatility is likely just the calm before the next storm. While precious metals may provide protection right at the beginning of the crisis this time, Bitcoin will face difficulties during stock market turbulence and may only experience sustained growth during subsequent rescue programs.
Conclusion: Bitcoin – New fantasy despite summer lull and uncertainties
After sliding south for two months, Bitcoin has started a recovery in the past two days. Soon, it should become evident from a technical analysis perspective whether the “Bitcoin ETF fantasy” is enough to push the prices back above USD 27,500. If successful, a rise to around USD 30,000 and even USD 35,000 USD could be possible by mid-summer. Alternatively, due to the lingering regulatory uncertainties, the sector may fall back into its recent premature summer lethargy.
Analysis sponsored and initially published on June 17th, 2023, by www.celticgold.eu. Translated into English and partially updated on June 17th, 2023.
Feel free to join us in our free Telegram channel for daily real time data and a great community. If you like to get regular updates on our gold model, precious metals, commodities, and cryptocurrencies, you can also subscribe to our free newsletter.
Disclosure:
This article and the content are for informational purposes only and do not contain investment advice or recommendations. Every investment and trading move involves risk, and readers should conduct their own research when making a decision. The views, thoughts, and opinions expressed here are the author’s alone. They do not necessarily reflect or represent the views and opinions of Midas Touch Consulting.

