


Most likely this news item will be on the forefront for a while and as such can shake even the strongest person´s confidence. Emotional reactionary behavior in the market is the least conducive to a prosper outcome. Taking some time out and finding a quiet space to write out a detailed execution plan for various anticipated backup plan scenarios is the most helpful. If unwanted emotions are already in place, a successful remedy is to simply lighten up on short term trading exposure. Less risk equals less sleepless nights. No need to deviate from well established long term wealth preservation plans.
Silver Monthly Chart – Reversal Pattern:
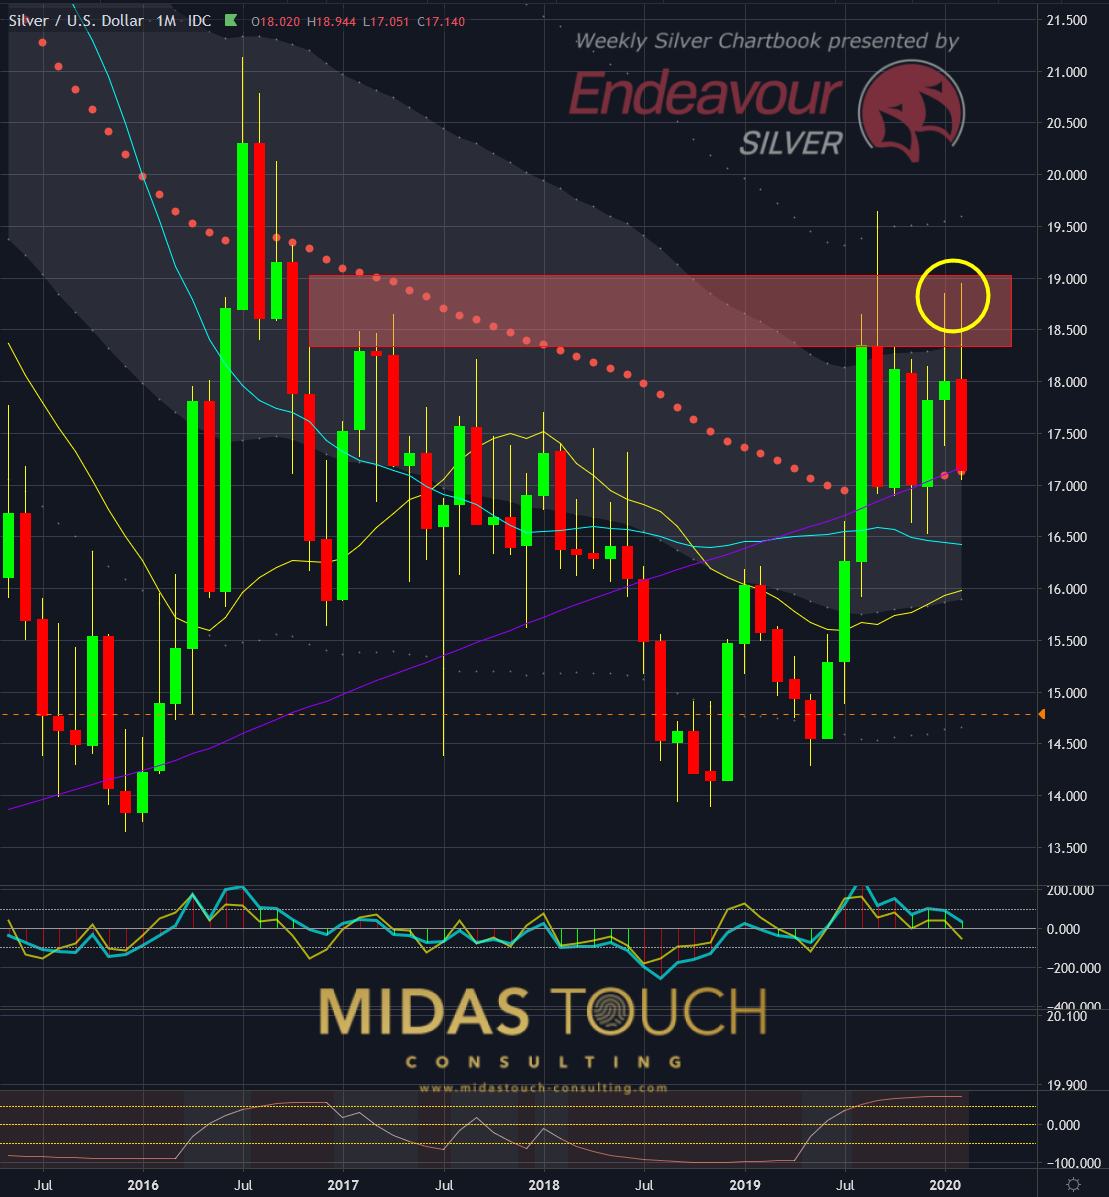
Silver in US Dollar, monthly chart as of February 28th, 2020
The monthly chart of silver shows that prices have been rejected by the US$18.40 to US$19.00 distribution zone (red horizontal box). The yellow circle points out a reversal pattern (pincer/tweezer candle stick chart pattern). These would be factors that speak for the short side.
Trading at the mean (red dotted line) represents a neutral stands.
Triple moving average support, in this case simple moving averages with settings 20 (yellow), 40 (turquoise) and 200 (magenta) are an argument for the long side.
Let us not forget this being a pure technical picture of events but markets being driven very much fundamentally by recent news events.

Silver Daily Chart – At Neutral:
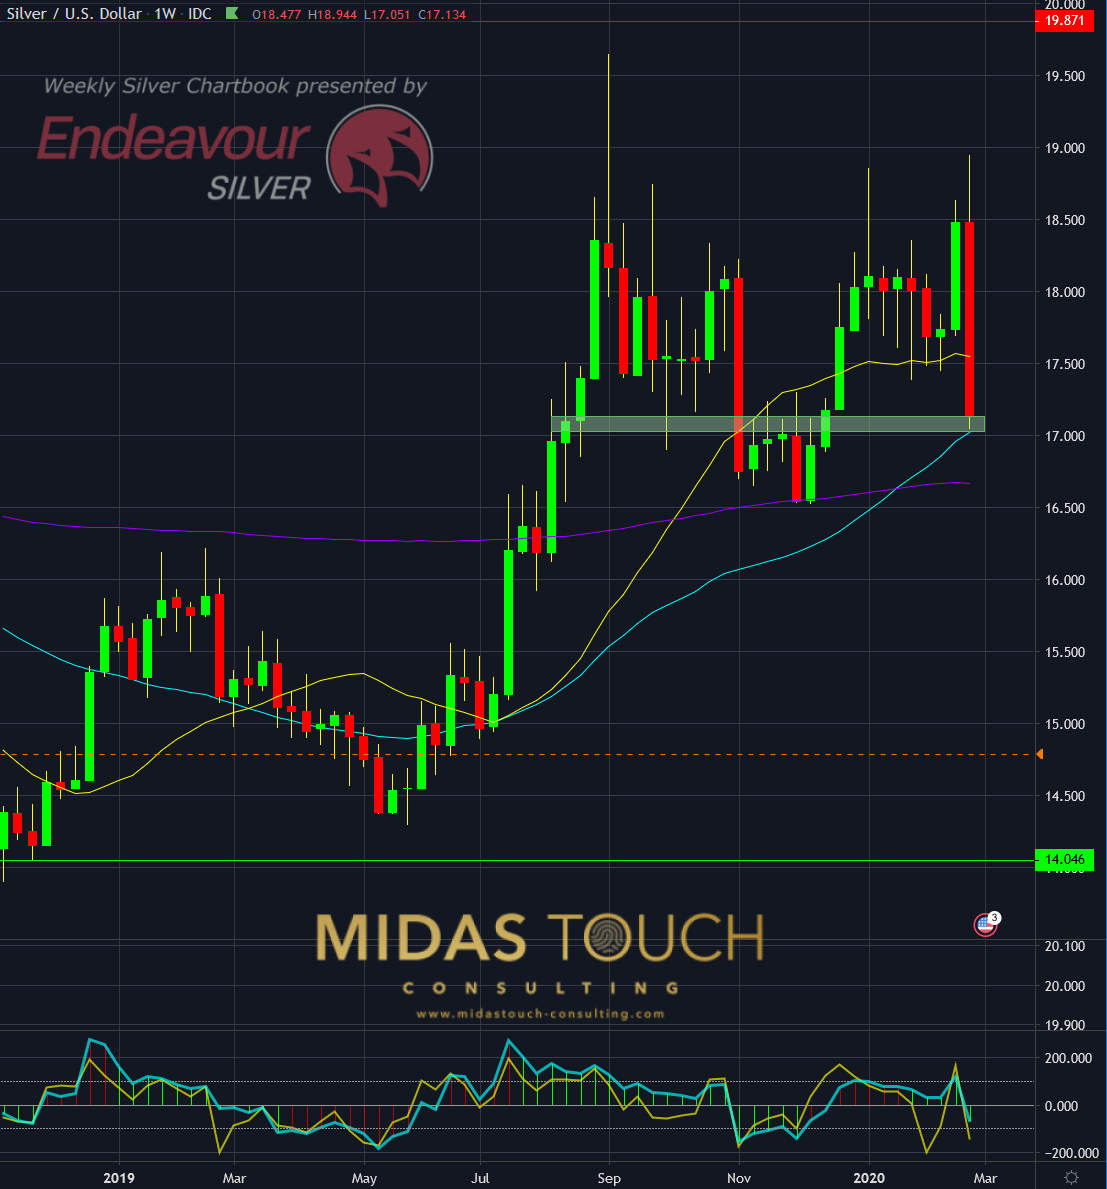
Silver in US Dollar, daily chart as of February 28th, 2020
A rightfully concerned market was reflective of last week´s news in its price behavior. Overhead resistance in the silver market and extended gains in gold were additional factors to keep price advances not just in check but caused a quick sell off. The daily chart above shows prices trading at a supply/demand zone (green horizontal box). Although being a neutral zone further negative news items can easily drive prices lower.
If trading positions make you feel uneasy always allow yourself an out. One of the best ones is the fact, that one can always reenter a position. One should never feel trapped within ones holdings. We post frequently low risk reentry points in our telegram channel .
The weakest link
It is never beneficial to worry since emotions like that more often than not lead to unwanted results. However, this is easier said than done. The fight flight response (fear) reduces our cognitive functionality. Having rehearsed, just like professional athletes do for competition, various possible outcomes of price behavior in the markets, allow for fear to be in check. Surprises causing this emotion are less likely to arise. And as such with a written action plan one can execute trades in a more emotionally calm state.
We post real time entries and exits for the silver market in our telegram channel. Follow us in our telegram channel.
If you like to get regular updates on our gold model, precious metals and cryptocurrencies you can subscribe to our free newsletter.

