


Gold – The market wants to see 2,000 USD
Following the spectacular collapse of Silicon Valley Bank and the dramatic ongoing rescue of Credit Suisse, the financial crisis has returned with full force. Within 24 hours, investors had attempted to withdraw more than 40 billion USD from Silicon Valley Bank, triggering a bank run in the U.S.. The drama quickly spread to other regional banks, causing severe shockwaves in international financial markets. At the same time, the once proud 167-year-old Swiss bank, Credit Suisse, is plummeting deeper into the abyss following an incredible series of missteps and compliance violations that had undermined the confidence of investors and clients. Gold – The market wants to see 2,000 USD.
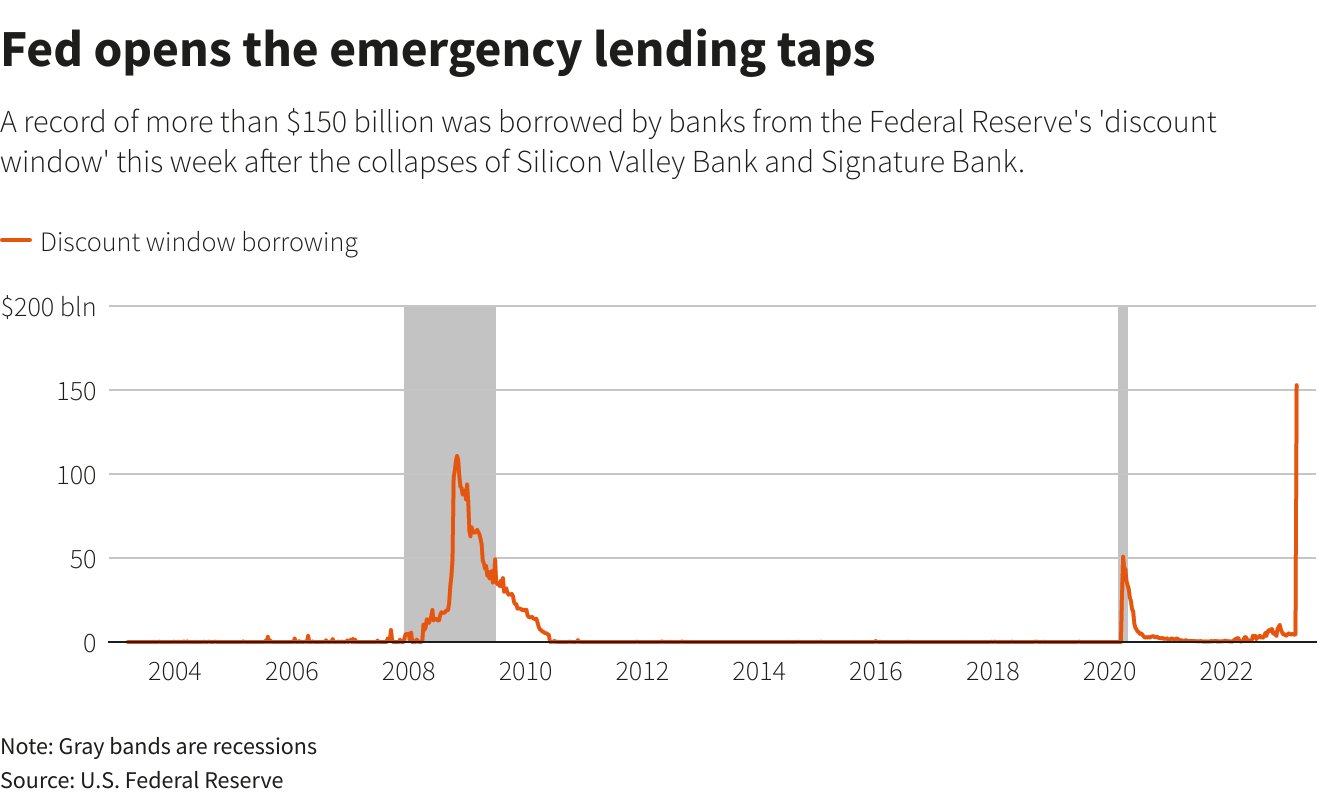
Emergency lending 2023 in comparison to 2008 & 2020 as of March 17th, 2023. ©Holger Zschäpitz
In response to the crisis, the heavily pressured US Federal Reserve has implemented unprecedented support measures, introducing the new “Bank Term Funding Program (BTFP)“. Ultimately, this is a covert “quantitative easing” program in the range of up to 2 trillion USD. Immediately, US banks have requested emergency funds in record amounts from the Federal Reserve to combat the serious crisis of confidence and liquidity. This amount, around 150 billion USD taken from the Fed’s discount window, is record-breaking and much higher than during the 2008 financial crisis or the 2020 Corona crash!
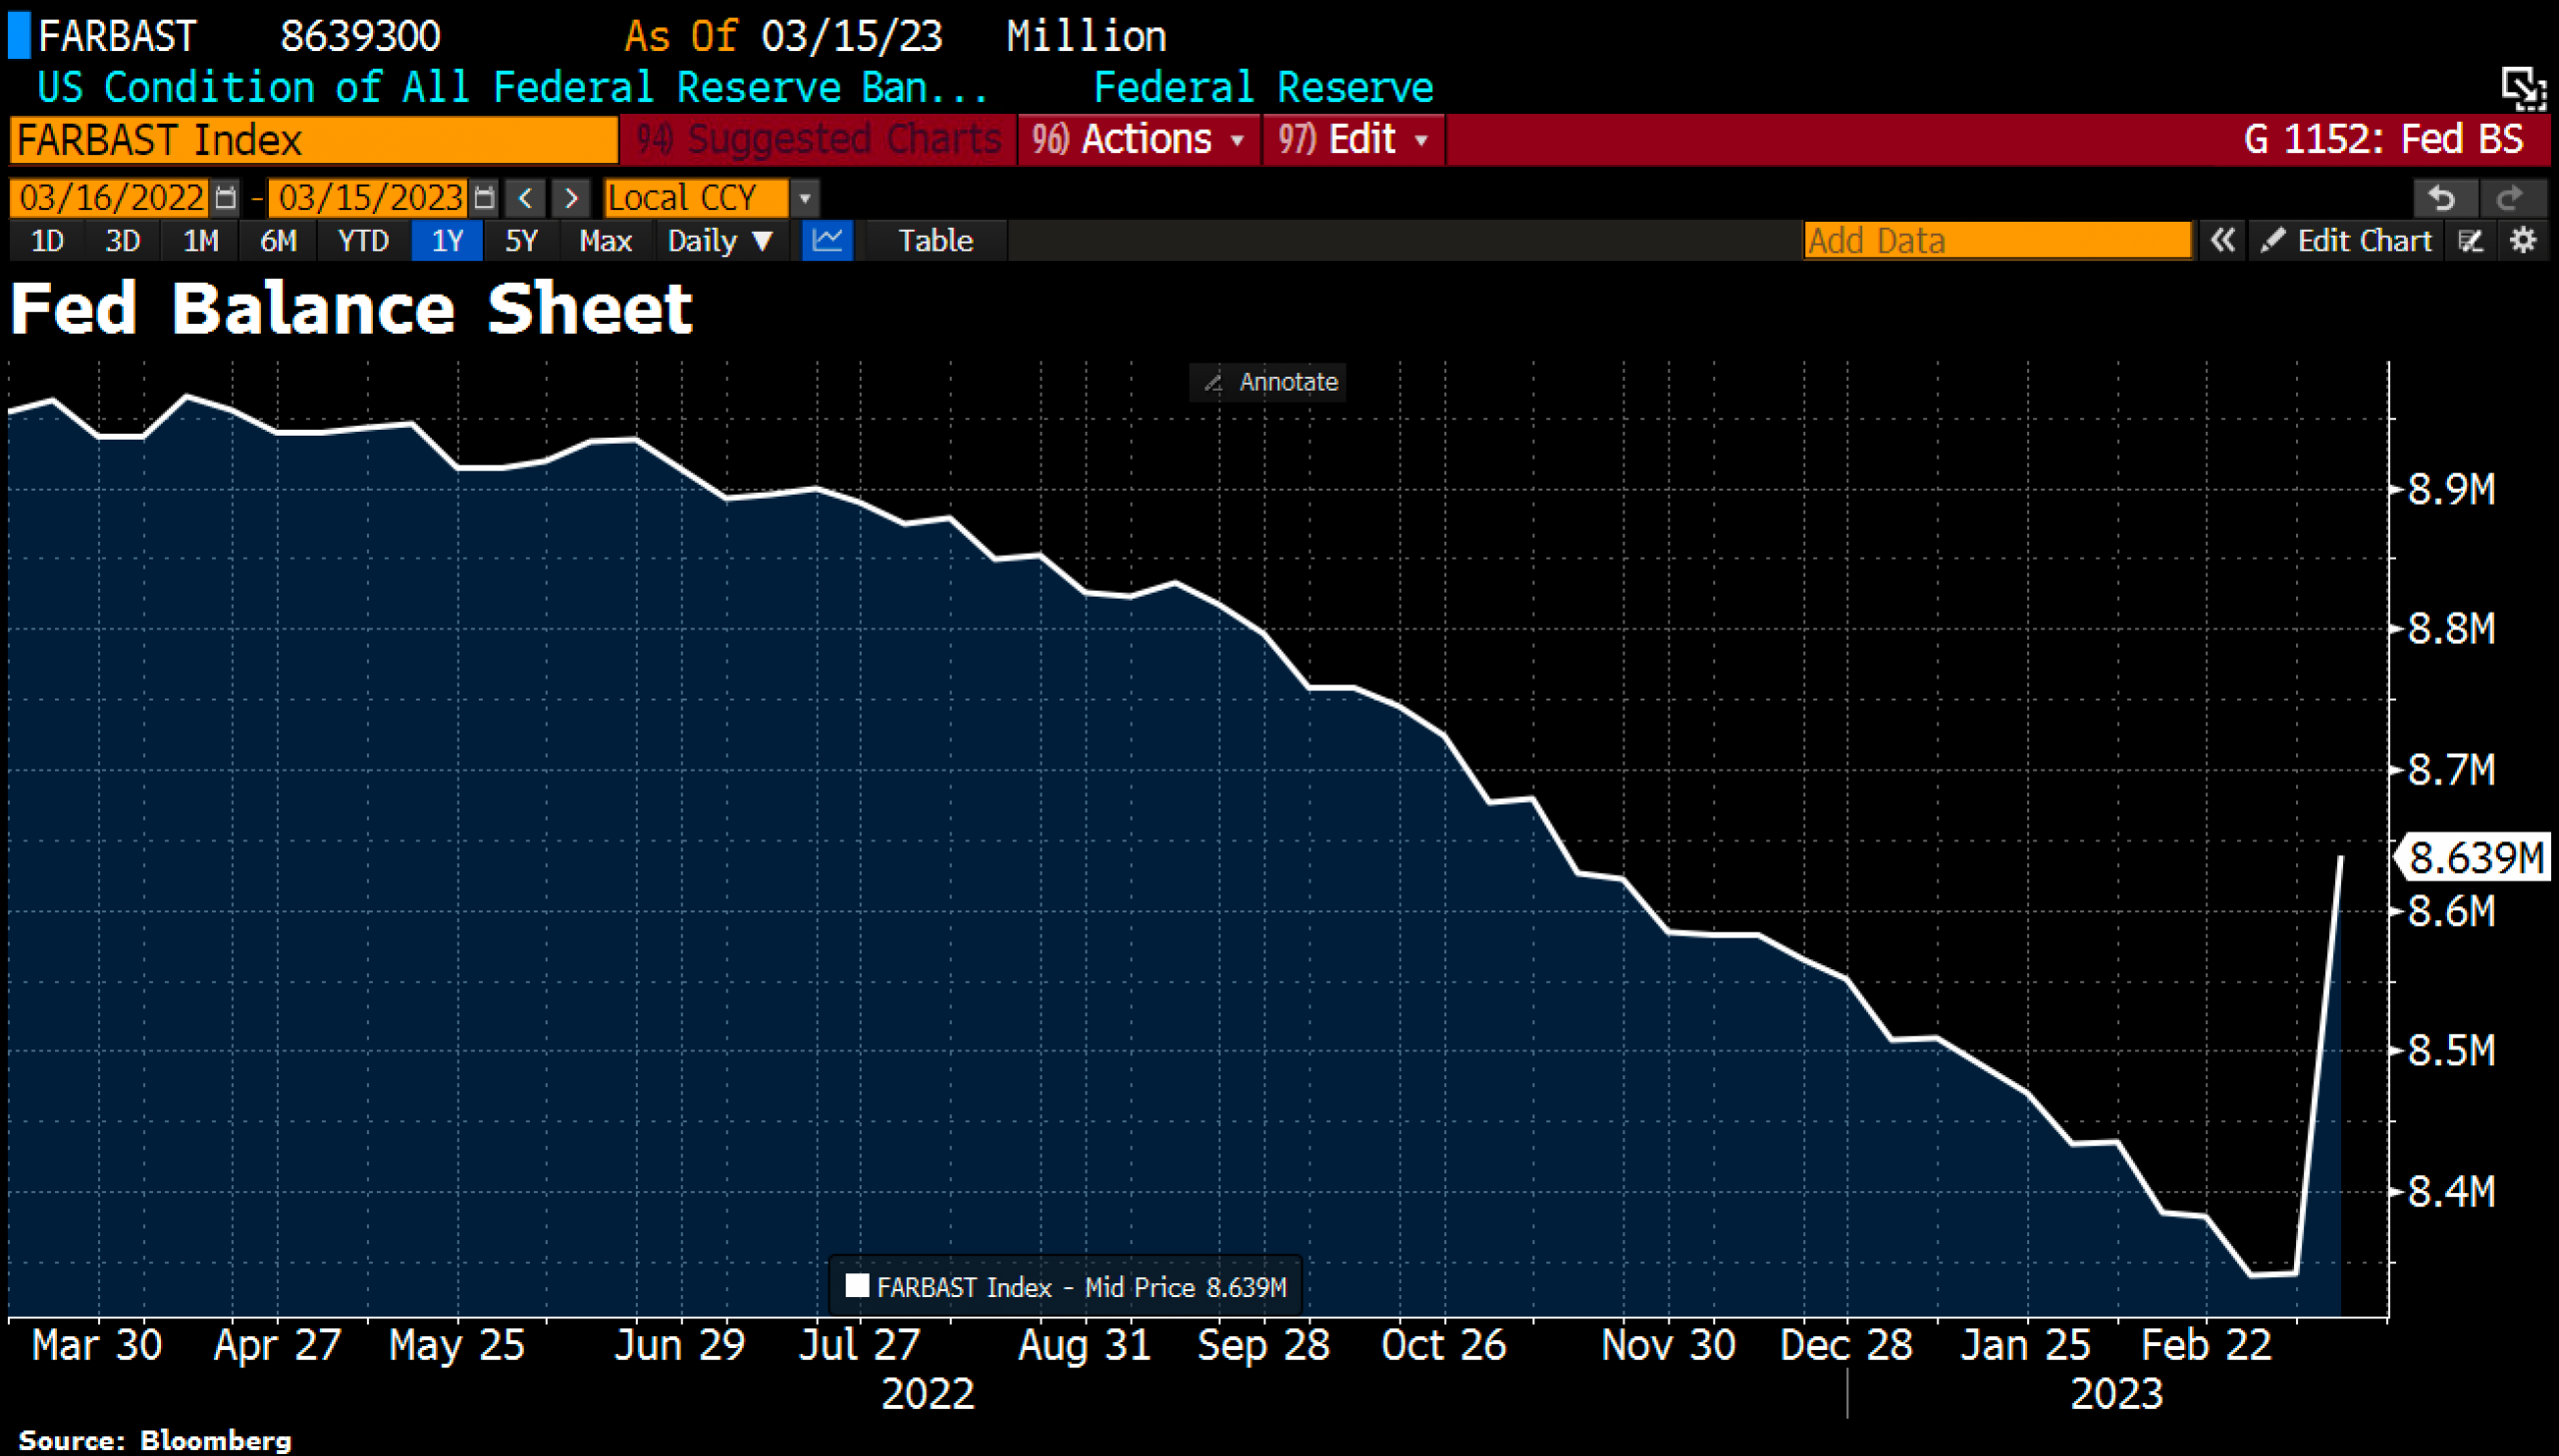
Fed balance sheet in USD as of March 15th, 2023. ©Holger Zschäpitz
Thanks to this massive liquidity injection, the Fed’s balance sheet skyrocketed by 297 billion USD almost instantly. But it’s not just the US central bank that has faltered in just a few days. The Swiss National Bank is also offering up to 50 billion CHF in liquidity to the crisis-ridden Credit Suisse.
Hence, the central bankers’ months-long fight against inflation was thus undone in just a few days. Further interest rate hikes are highly questionable given the fragile situation! The main reason for this disaster is, of course, the completely exaggerated and, above all, brutal interest rate hiking by the Fed, the consequences of which we have repeatedly warned against. The inflation caused by decades of irresponsible money printing, shortages due to absurd lockdowns, and a completely naive geopolitics cannot be fought this way.
Gold explodes higher
Over the last two weeks, gold has finally responded to this madness with a strong increase of almost 185 USD. On Friday, gold easily surpassed the highs from early February at 1,959 USD. Obviously, the sharp five-week pullback in February clearly ended with a double low at 1,804 USD and 1,809 USD in the first week of March. Given the massive new money printing, the increasing flight to safety, and the promising technical outlook, the market will most likely want to see the psychological level of 2,000 USD very soon, probably within the next few days already. However, a sustained breakout above the resistance zone between 2,050 USD and 2,100 USD may still drag on until the summer or even early fall.
Gold in US-Dollars
Daily Chart – 2,000 USD is a magnet
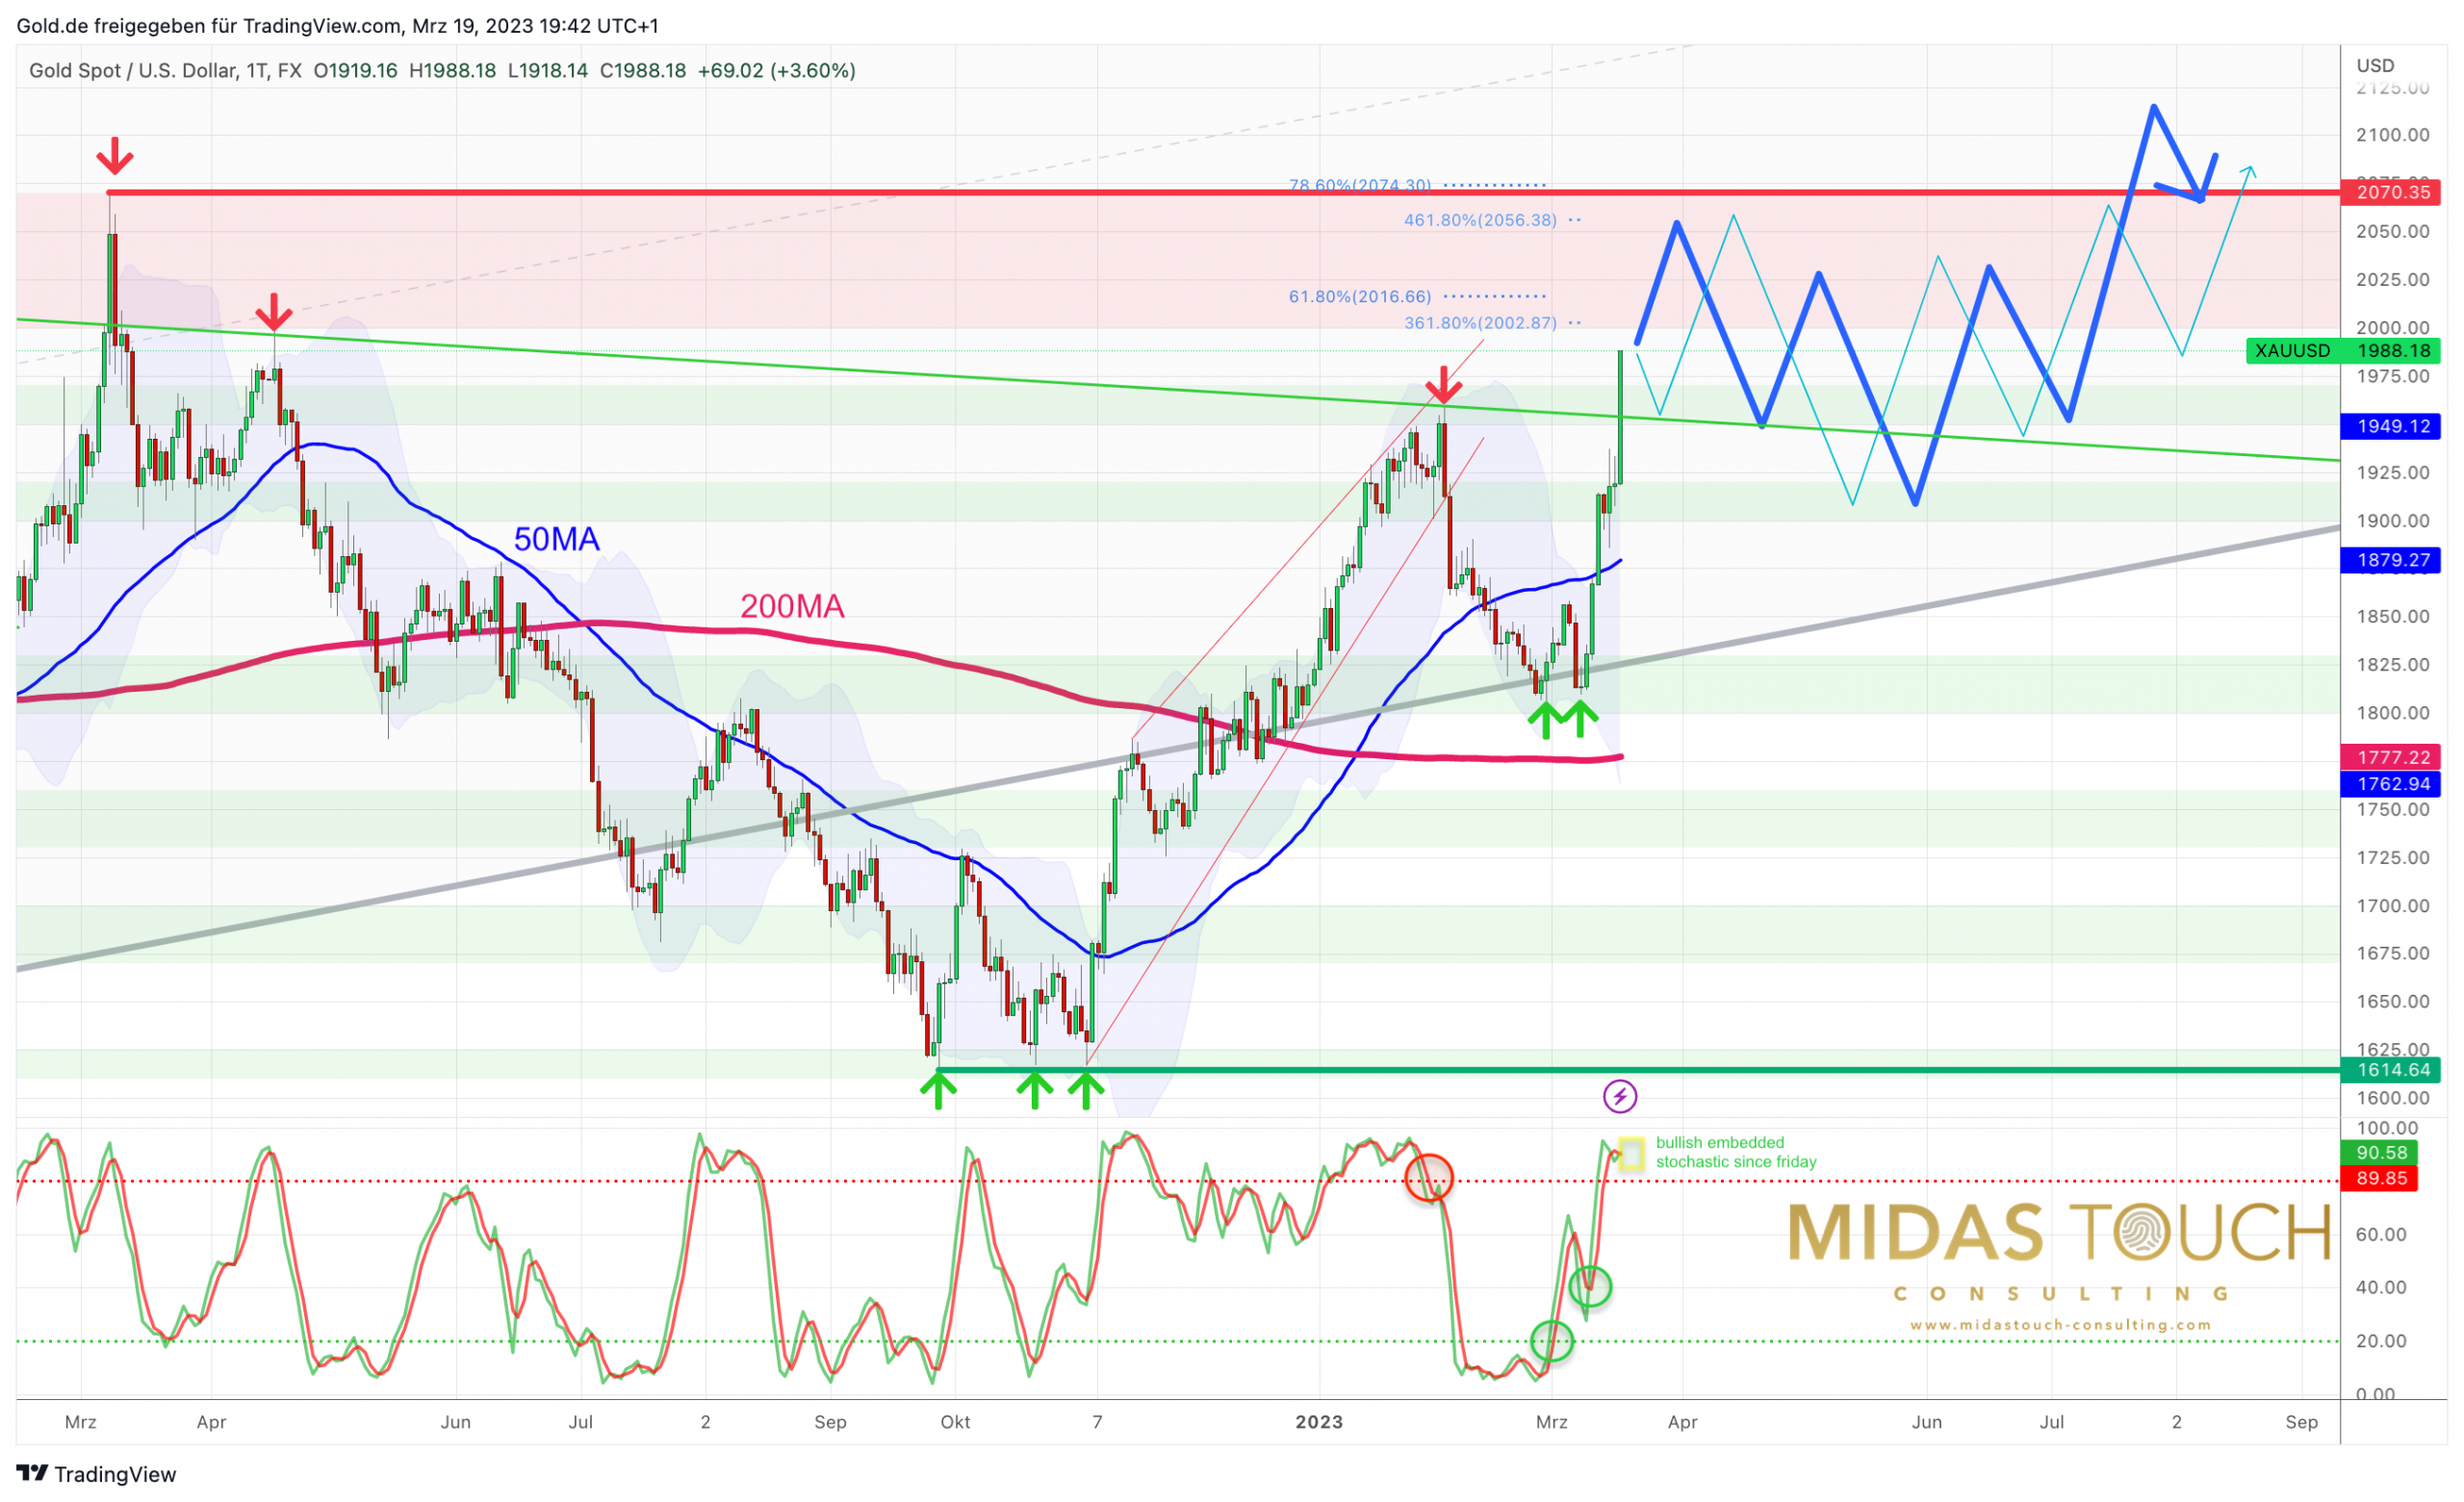
Gold in US-Dollar, daily chart as of March 19th, 2023. ©Midas Touch Consulting
Back in late February, gold missed its slightly rising 200-day moving average (1,777 USD) by about 25 USD. Bottoming at 1,804 USD already, gold bulls quickly enforced a first recovery wave back up to 1,858 USD. However, Fed Chairman Jerome Powell caused a sharp but short-term sell-off in the gold market during the hearing before the US Congress Economic Committee on March 7th, when he reaffirmed his intention to further raise interest rates.
However, the drama surrounding the Silicon Valley Bank began just one day later, and gold quickly turned back up from 1,809 USD. Not only has a double bottom been established around 1,805 USD, but the second low was also marginally higher than the first one. Since then, gold has been unstoppable and has risen by nearly 185 USD in the last seven trading days. Neither the 50-day moving average (1,879 USD) nor the upper Bollinger Band (1,949) could stop the bulls. Instead, gold closed at higher point of the day (1,988 USD).
Expect more chop, whipsawing and pullbacks before gold can really break out
Of course, the daily chart is overbought after this spike. Additionally, one could argue that an open gap was created around 1,868 USD, which may need to be closed eventually. Furthermore, the seasonal window is not particularly favorable until the height of summer.
However, at the same time, the technical outlook is clearly bullish as gold continues to climb higher along the upper Bollinger Band. The well-known resistance zone between 1,950 and 1,965 USD has already been conquered. Hence, the broad resistance zone between 2,000 USD and 2,075 USD is the next target zone. Obviously, from 1,988 USD it is not far to the round psychological mark of 2,000 USD and already on Monday they number might be seen. If gold would need to take breather, we would anticipated that 1,900 USD to 1,920 USD should hold.
Gold in Euro
On a euro basis, gold has been searching for a bottom in the area of its 200-day moving average (1,720 EUR) for five weeks. In the last seven days, however, the bulls finally lit the rocket and one ounce of gold now costs around 160 EUR or almost 9.6% more. Closing the week at 1,864 EUR, gold has ached its highest weekly closing price of all time in EUR! We suggest to be patient and wait for pullbacks (which will come before the summer) to add to your holdings.
Conclusion: Gold – The market wants to see 2,000 USD
In summary, the signs point to further rising prices in the short-term. The long anticipated breakout to new all-time highs above 2,075 USD in the 3rd or 4th quarter is taking shape. However, gold will probably need to make several attempts, similar to other major resistance levels in the past.
That is to say, until early summer, there could be one more pullback of approximately 100 USD to 150 USD and various attacks, before the sustain breakout to new all-time highs should occur. The “worst case” scenario would be a closing of the open gap at around 1,865 to 1,870 USD. However, such a pullback could also find its bottom above 1,900 USD given the current strength and the immediate further upside.
A volatile week ahead
In the short term, gold seems to be firmly targeting the 2,000 USD mark and above that anything between 2,025 to 2,050 USD in the next couple of days probably. From there we would be very cautious and preparing for a pullback, as the banking cartel likely will manage to calm down the situation in the short-term. Also the next FOMC meeting on Wednesday should create more volatility in the gold market. Pullbacks towards 1,900 – 1,920 USD would be a buy though.
Nevertheless, in the big picture recent dramatic events should have made it very clear that gold is on the way towards at least 2,800 USD within the next 12-24 months. Above that our 1st longterm target at 5,000 USD remains in place.
Analysis initially published on March 17th, 2023, by www.gold.de. Translated into English and partially updated on March 19th, 2023.
Feel free to join us in our free Telegram channel for daily real time data and a great community. If you like to get regular updates on our gold model, precious metals and cryptocurrencies, you can also subscribe to our free newsletter.
Disclosure: This article and the content are for informational purposes only and do not contain investment advice or recommendations. Every investment and trading move involves risk, and readers should conduct their own research when making a decision. The views, thoughts, and opinions expressed here are the author’s alone. They do not necessarily reflect or represent the views and opinions of Midas Touch Consulting.

