


Silver – When will the resistance around 30 USD fall?
Silver prices can already look back on six extremely intense, exciting and volatile trading weeks in the new year. After a very good start with prices reaching a high just under US$27.90, a sharp pullback followed starting on the 6th of January. This pullback reached its low on January 18th with prices slightly above US$24. Since then, silver has been rising again. Silver – When will the resistance around 30 USD fall?
Especially on January 28th and the following few days, however, the news and prices went crazy due to the “Silver Squeeze” campaign. First, Silver prices briefly pushed up towards a new eight-year high at US$30.10 on February 1st. Yet, these highs could not be maintained during that Monday. Hence, prices sharply and quickly dropped to US$25.89 by February 4th. Over the last few days silver managed to stabilize. With current prices slightly above US$27, silver is sitting in the upper third of the trading range of the last six months. Overall, it is making a good and still promising impression despite the recent news and wild price moves.
Technical analysis as your primary tool
If you rely on technical analysis as your primary tool, you have the great advantage of having all these news and developments in one chart in front of you. After all, the market always knows more than a single market participant. The chart simply represents the sum of all transactions and their influence on the price. Those on the other hand, who struggle with never-ending fundamental analyses, statistics and expert videos, are usually even more confused in the end. Of course, fundamental analysis is important. However, it is absolutely clear for many months already, that silver is in a new bull-market. This is especially true since gold prices had reached a new all time high last summer. Hence the whole precious metals is in a bull market and silver has a lot to catch up.
In a bull market, you want to be invested basically all the time and patiently wait for pullbacks in order to buy and expand positions (“buy the dip”). But if you only react when the whole world suddenly talks about a possible “silver squeeze”, you buy at exactly the wrong time.
Nevertheless, even such mistakes will not really be punished in a bull market. Assuming you buy the precious metal physically and not via ETFs, certificates, futures or options you have nothing to fear. Only then can you sit through normal pullbacks and volatility without any problems. Those who trade with leverage and margin, on the other hand, had no chance and may have either been stopped out, knocked out or liquidated.
Weekly Silver Chart in USD – At the Upper Bollinger Band
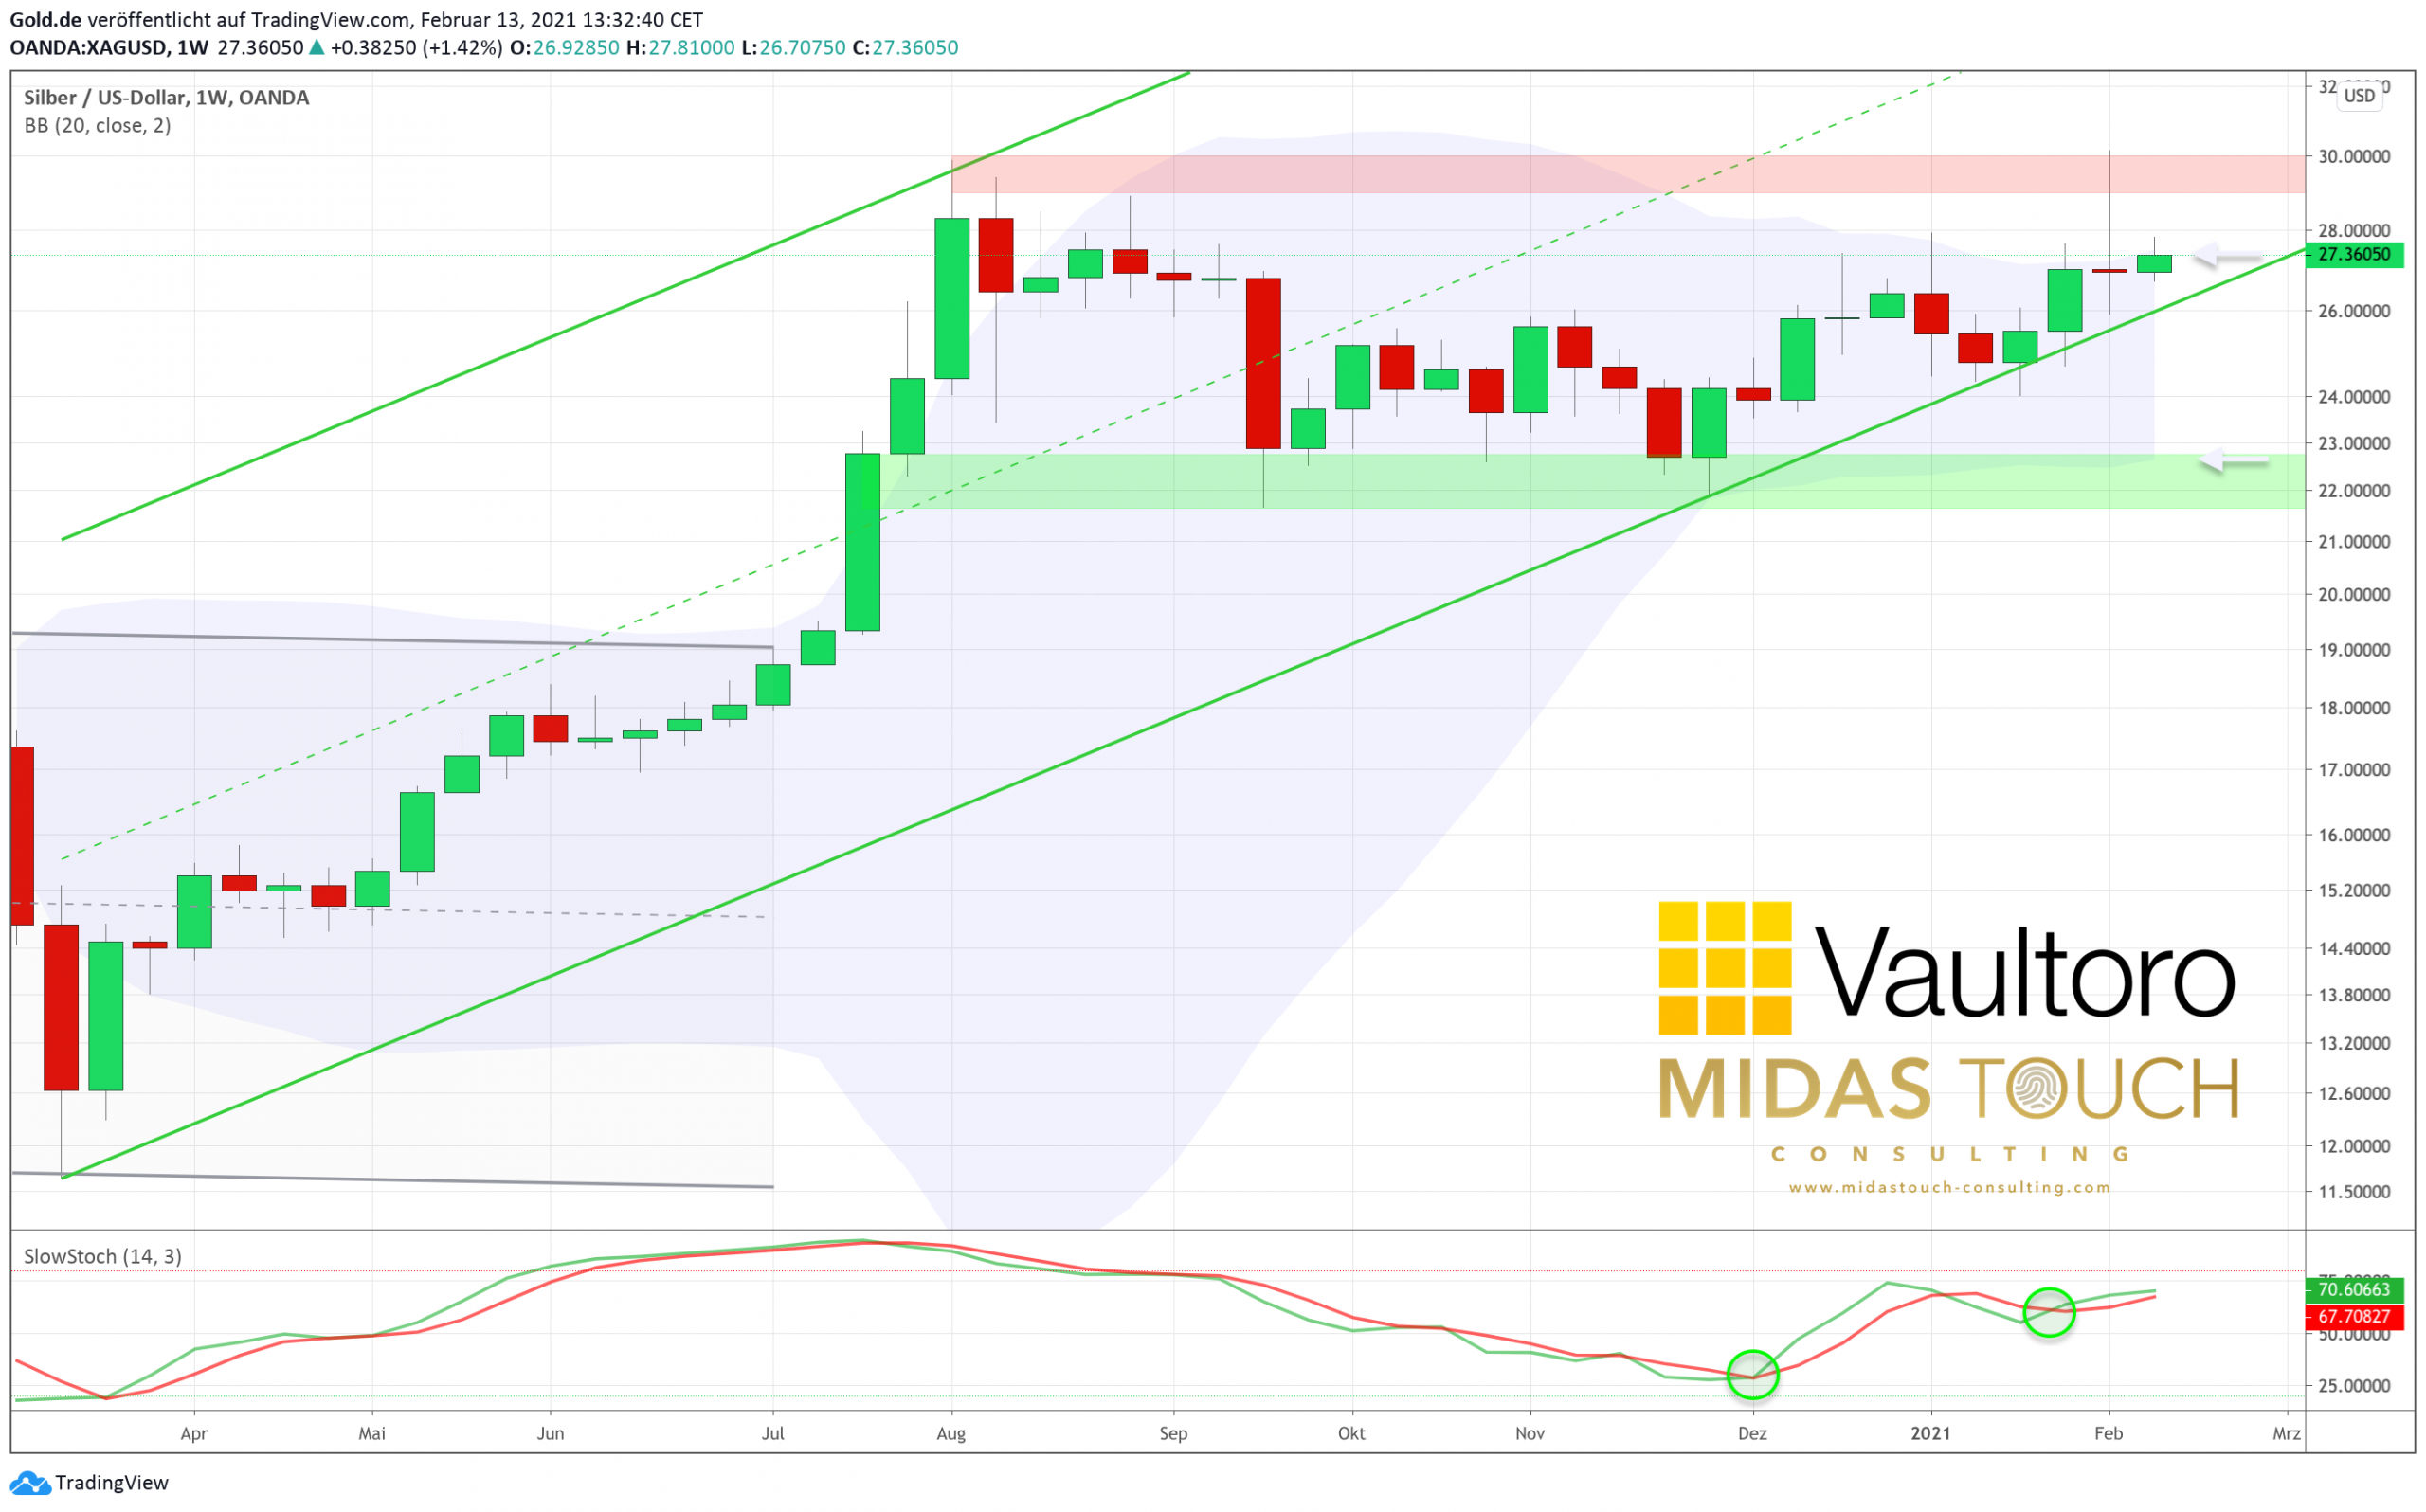
Silver in US-Dollar, weekly chart as of February 13th, 2021.
A glance at the weekly chart makes it clear that the bulls are clearly in charge of the big picture in silver. Although the up-trend line of the last 11 months got under pressure in mid-January, the Bulls have been able to defend this support so far. Strong support has also established itself between US$21.50 and US$22.75. At the moment, it seems unlikely that Silver will move below that zone.
On the contrary, the focus of the market has likely already shifted to the strong resistance zone at US$30. It is quite possible that it will take several more attempts to overcome this resistance in the course of the next weeks and months. Afterwards, however, a quick rally up to the all-time high around US$50 should be expected. From this bigger picture perspective, any pullback would be buying opportunity.
Currently, silver is trying to break up the upper Bollinger Band. But both bands are currently running sideways. This process could well drag on for a while. In other words, a possible further pullback below the up-trend line does not have to have dramatic consequences. It would rather simply herald an extension of the ongoing consolidation between approx. US$23 and US$27. Alternatively, the bulls are breaking the upper Bollinger Band further up and can already drive another attack against the US$30 mark in the coming weeks.
Daily Silver Chart in USD – Sideways Consolidation
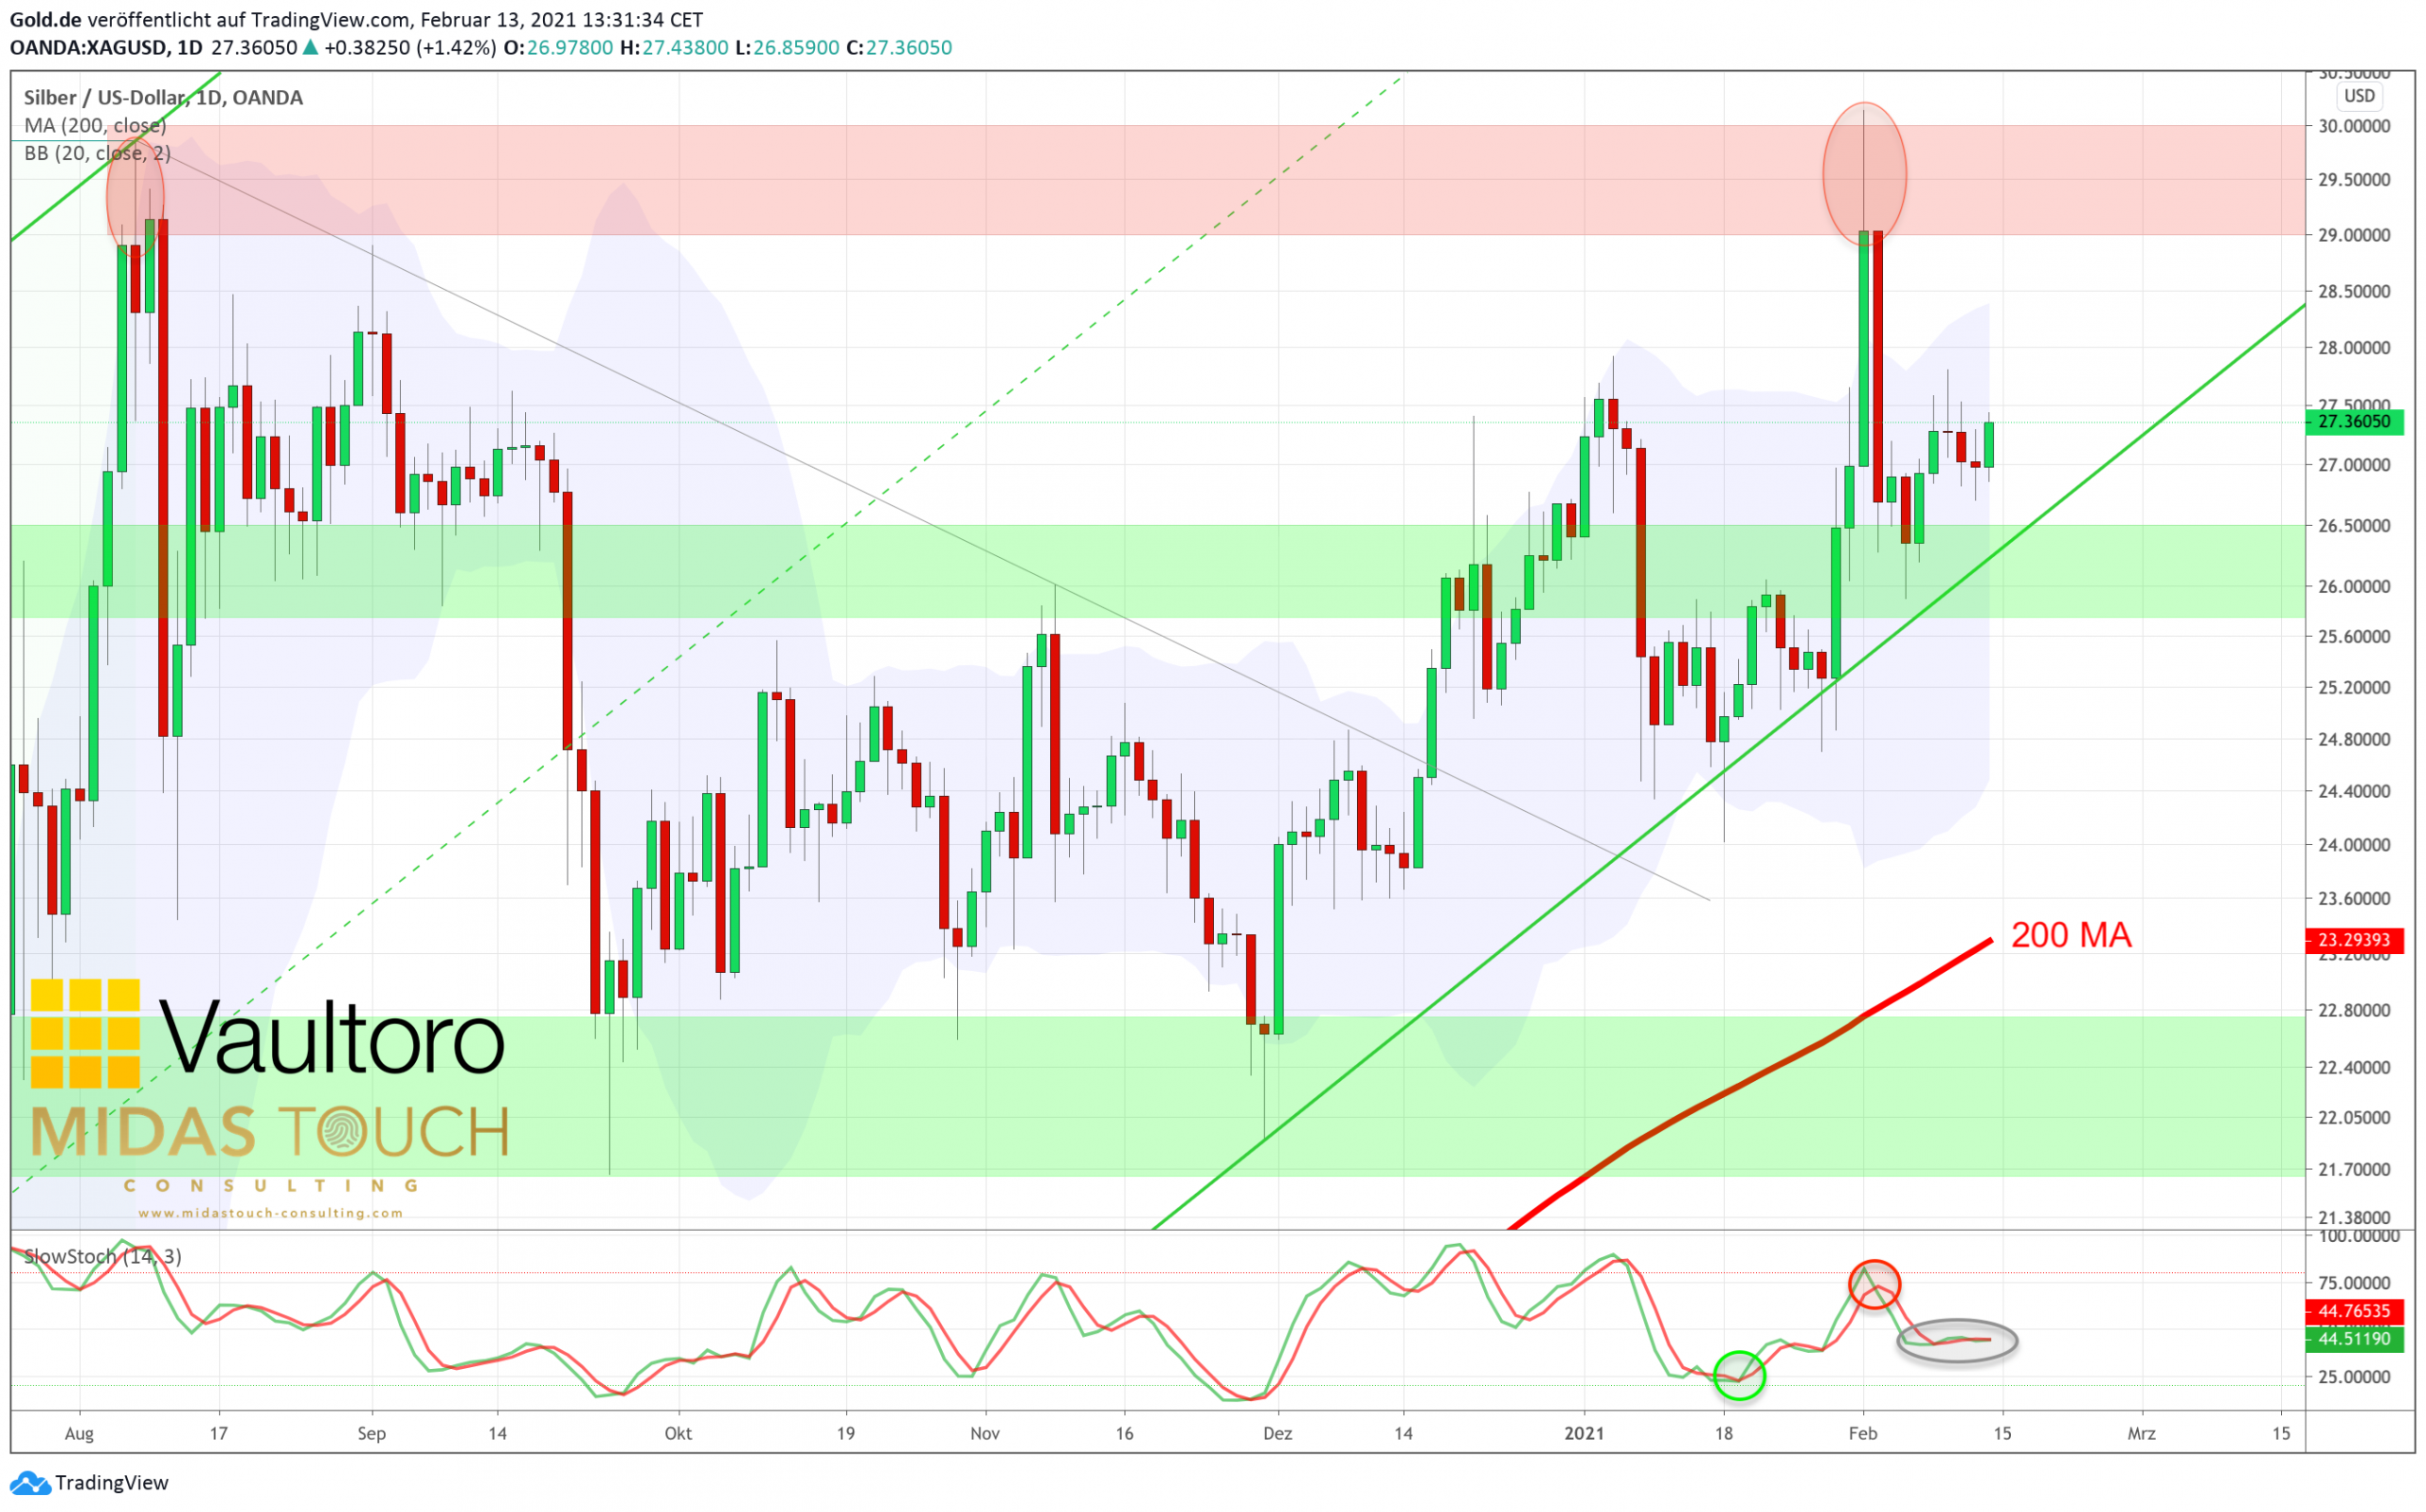
Silver in US-Dollar, daily chart as of February 13th, 2021.
On the daily chart however, the situation is rather neutral in the short term. The 200-day moving average (US$23.23) is still well below current prices. To meet current price levels, it would either take a deep correction (unlikely) or simply more time. For example, a sideways scenario until early summer, where silver is trading between approx. US$25 and US$30. At the same time, however, it is easy to see that if the up-trend line (currently around US$26.15) were to hold, another attack towards the resistance at US$30 would happen within the next four to five weeks.
Overall, the setup for silver remains mid- to longer-term bullish. Pullbacks are and will remain a buying opportunity However, as a precautionary measure, one should bring enough patience, because the ongoing consolidation could well last until early summer. Silver – When will the resistance around 30 USD fall?
Silver in EUR: New purchase limit at 21.50 EUR
Looking at silver against the Euro, the low prices in January filled our aforementioned purchase limit at 20.50 EUR. In view of the increased prices in the meantime, the purchase limit will be increased to 21.50 Euro.
Feel free to join us in our free Telegram channel for daily real time data and a great community.
If you like to get regular updates on our gold model, precious metals and cryptocurrencies you can subscribe to our free newsletter.

