


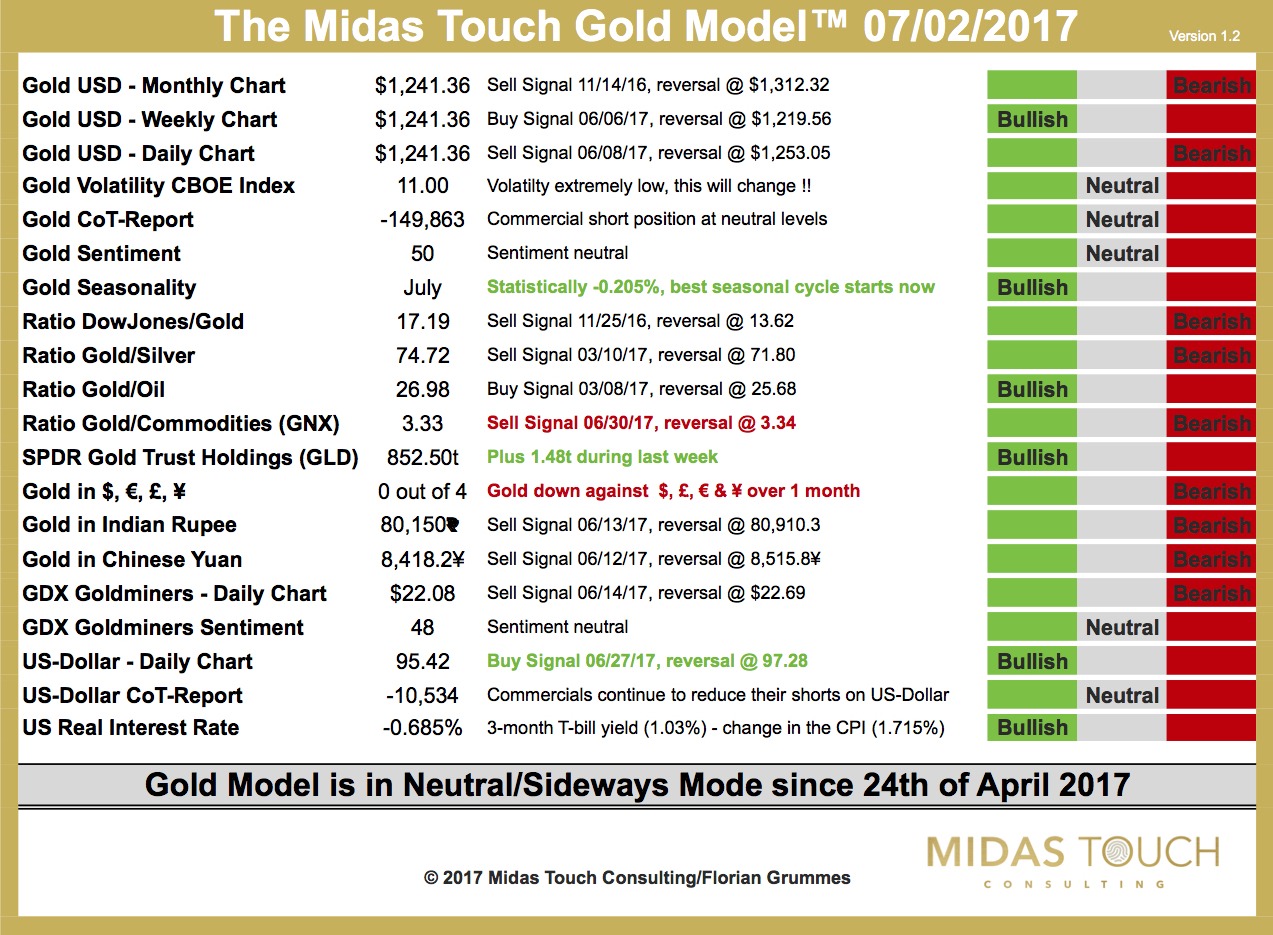
Our Midas Touch Gold Model remains in neutral/sideways mode.
New buy signals are coming from “Gold Seasonality”, “SPDR Gold Trust Holdings” and the “US-Dollar Daily Chart” while new sell signals have appeared @ “Ratio Gold/Commodities” and “Gold in $, €, £ & ¥”.
Note that it doesn’t take much for gold to turn the whole model bullish. Currently a push above 1,253 USD would shift the daily charts for Gold in US-Dollar, Indian Rupe and Chinese Yuan to a clear buy signal and the Model would issue a bullish conclusion!!!
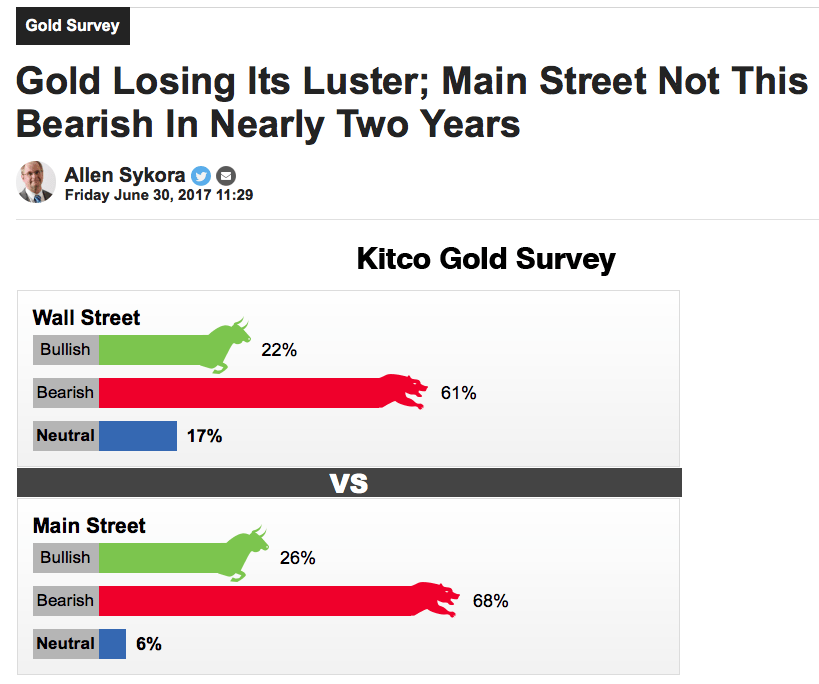
Another very strong contrarian signal comes from the weekly “Kitco Gold Survey”. “Main Street Not This Bearish In Nearly Two Years” says it all.. I continue to believe that gold is going to start its rally towards 1,500 USD within the next days or maximum 4-6 weeks…
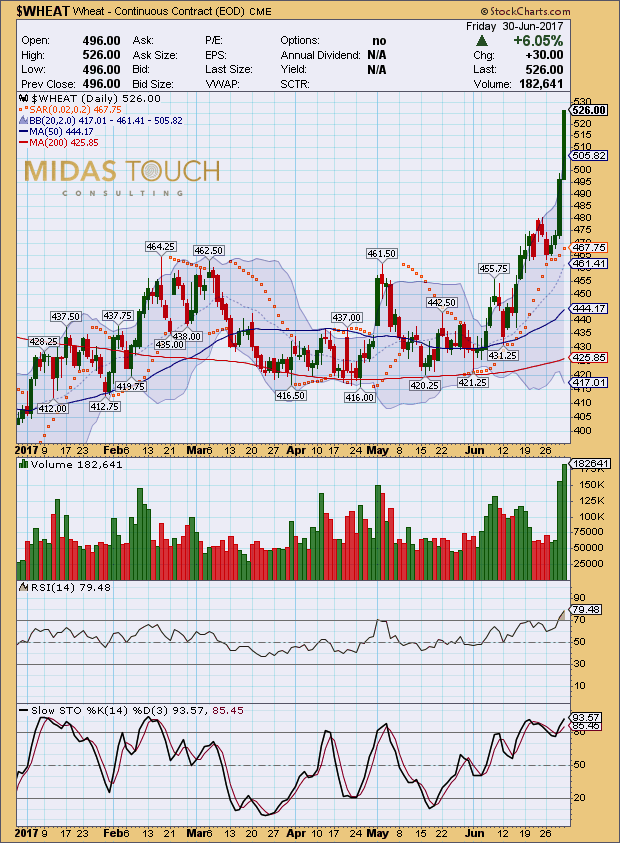
And finally wheat has been exploding over the last two trading days… That could quickly spark inflation expectations.. Remember the best investment in that type of scenario will be silver!!!
In the bigger picture gold is running into the apex of a huge triangle pattern. The breakout will happen soon – probably until mid of August. Generally a triangle can break either to the up- or downside but I am pretty sure that gold will finally push through the six-year downtrend line and start the long awaited run towards 1,500 USD in the second half of 2017.

