


The Midas Touch Gold Model™ is still neutral!
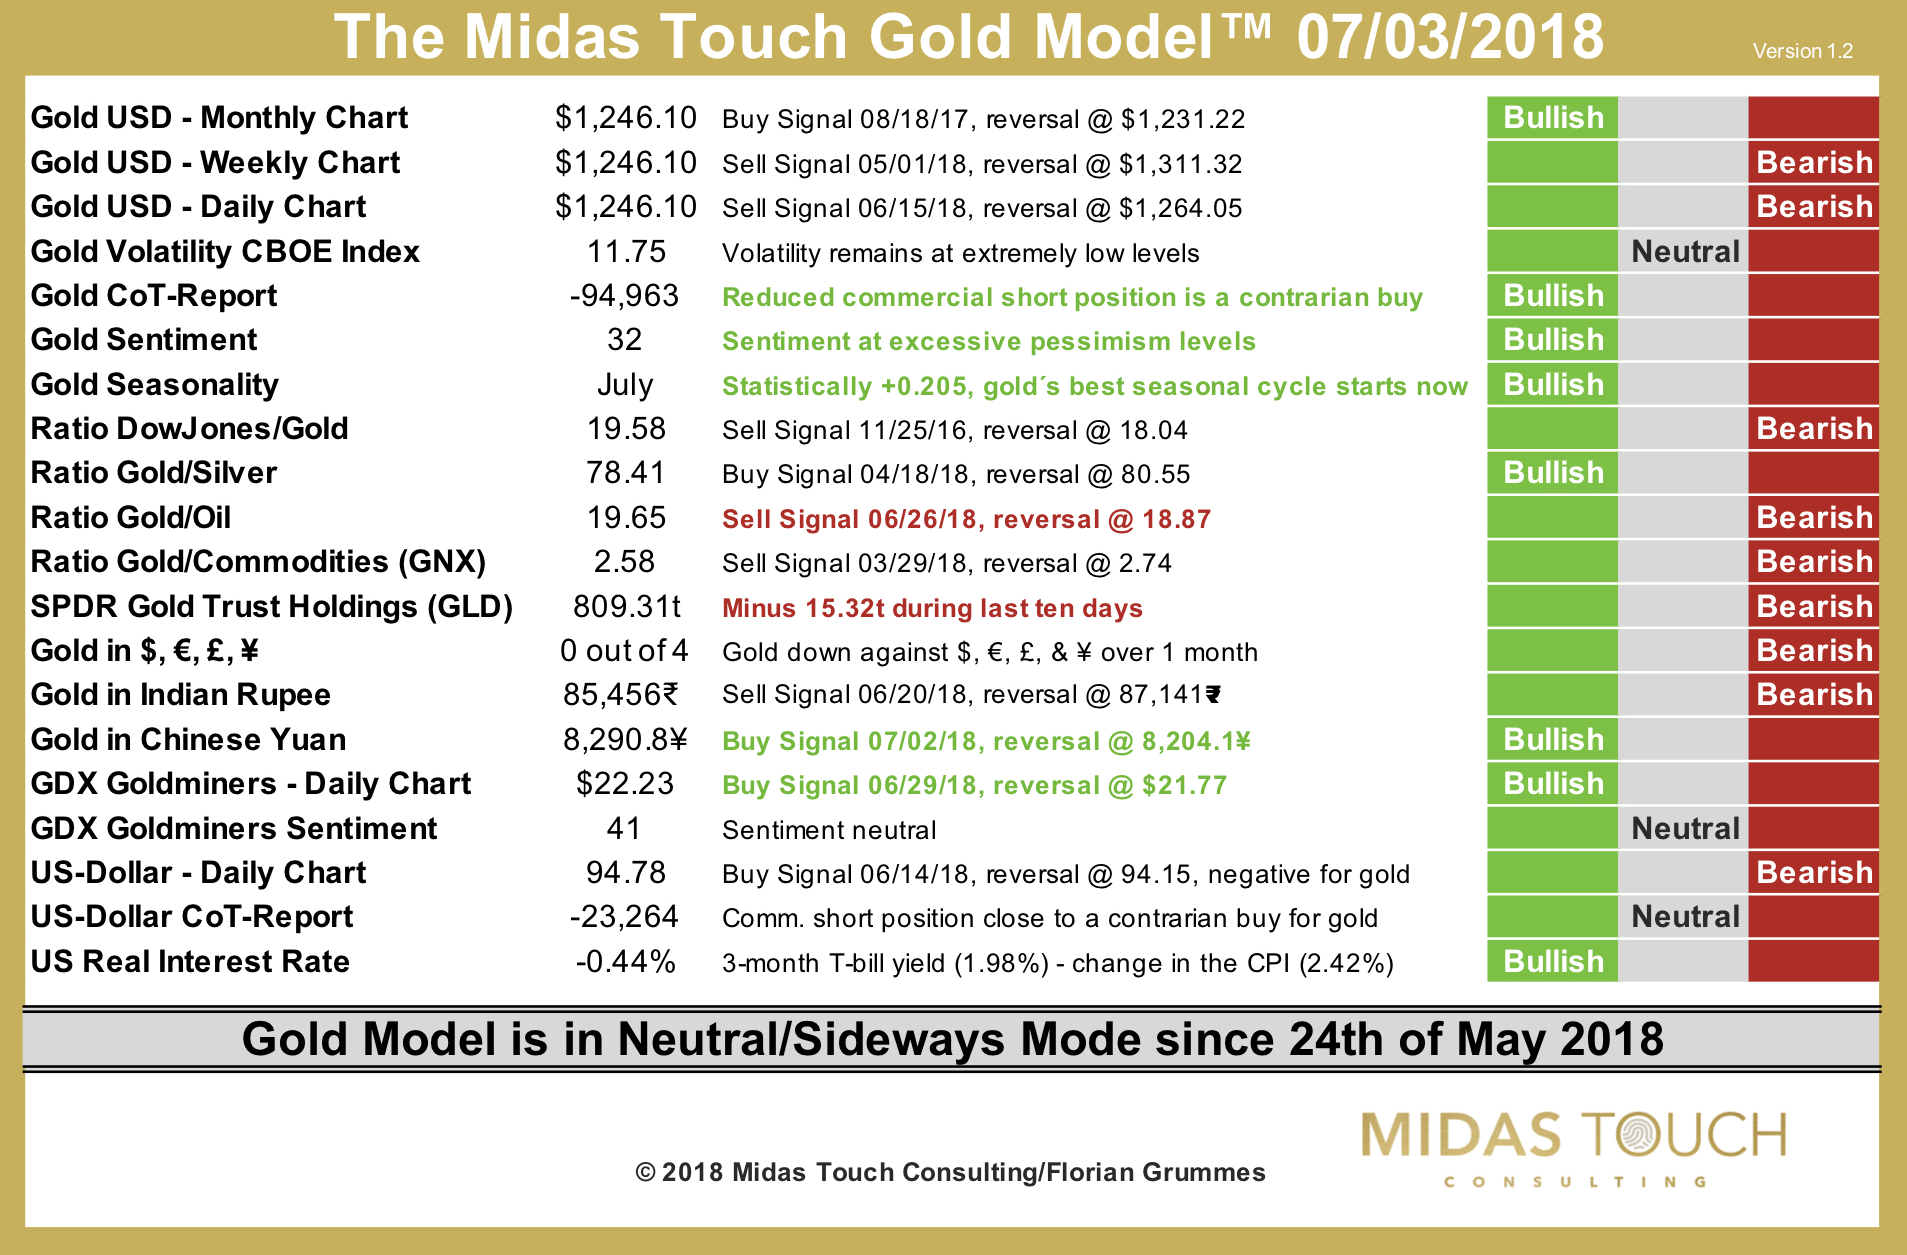
The Midas Touch Gold Model™ as of July 3rd, 2018
The Midas Touch Gold Model™ continues to conclude with a neutral stance towards the gold market. But during the last two days the model captured some very important changes that will likely have profound consequences for gold´s price action over the next couple of weeks if not months….!
Over the last 12 trading days gold posted only two green candles on its daily chart! And the downtrend is already in place since April 11th, when gold topped out at 1,365 USD.
But today, on the 3rd of July, gold very likely bottomed out at 1,237.85 USD this morning.
Over the last three months gold lost 127 USD or 9.3%. Sentiment has been beaten down and I could not find any bullish colleague, analyst, reader nor friend! In the last eight hours gold already reversed strongly and rallied back to 1,251 USD. To me a clear sign, that a reversal is about to happen.
Of course, one of the biggest mistake many trader make is to be ahead of the market. But as you know I have been waiting for the setup for many months… But now there are five new very promising and bullish developments in our Midas Touch Gold Model™.
- First of all the monthly chart is still bullish! And that’s although gold has been falling 127 USD. This bullish monthly signal is in place since last August already…
- The latest CoT report shows that commercials have significantly reduced their short position.. with a cumulated short position of 94,963 contracts this important indicator is now flashing a contrarian buy signal
- The last sentiment numbers as well as my personal experience clearly show a beaten down sentiment and excessive pessimism towards gold and precious metals among investors
- Right in time when US markets are closed for the independence day the seasonal cycle for gold turns bullish. Statistically during the next three months rising gold prices have a very high probability
- Another new bullish signal comes from the daily chart for gold in Chinese Yuan. Yes, the Chinese and Indian are responsible for mother than 50% of the physical gold demand on this planet. Therefore you want to know the trend in these two currencies. Typically, and this my personal observation over the last couple of years, important turning points are usually happening in those two currencies first. And yesterday (Monday) the gold chart in Chinese yuan already switched to a bullish signal. That’s a great confirming signal already.
- Last but not least the goldminers flashed a new buy signal last Friday. Instead of bowing to gold’s weakness the GDX posted a big green candle. Therefore, the gold mining stocks did not confirm gold´s downtrend anymore.
On the negative side, the Gold/Oil-Ratio fell back to bearish reading due too gold´s weakness. Another signal, which is more of a hindsight perspective is the massive outflow of physical gold from the largest gold ETF. More than 15 tonnes have left the vaults over there last 10 days which clearly shows that retail investors and larger paper gold investor threw in the towel. This liquidation gives a lot of room for new money chasing gold and gold mining stocks over the next couple of weeks and months.
In total, the Midas Touch Gold Model™ is still neutral. The model will need more trend confirmation before it can become bullish.
Personally, I am super bullish!!!! I expect gold to quickly regain lost territory and challenge anybody who is doubting or procrastinating at this stage. Bulls should be able to use the extremely oversold situation to push prices back against the horizontal resistance around 1,350 – 1,375 USD until mid/end of august.

