The Midas Touch Gold Model™ continues with a neutral conclusion!
Despite the sell-off in gold last Friday, the Midas Touch Gold Model™ remains neutral and points to some more weeks of sideways to slightly lower prices! Last week´s price action led to a couple of new signals within the model. New sell signals have been activated on:
- Daily chart for gold in US-Dollar
- Daily chart for gold in Chinese Yuan
- Daily chart for the US-Dollar.
New bullish signals are coming from:
- Gold/Oil Ratio
- Daily chart for gold in Indian rupee
- The fact, that the US real interest rate continues to dive deeper into negative territory
Considering all these changes together with the already established signals the Midas Touch Gold Model™ is neutral.

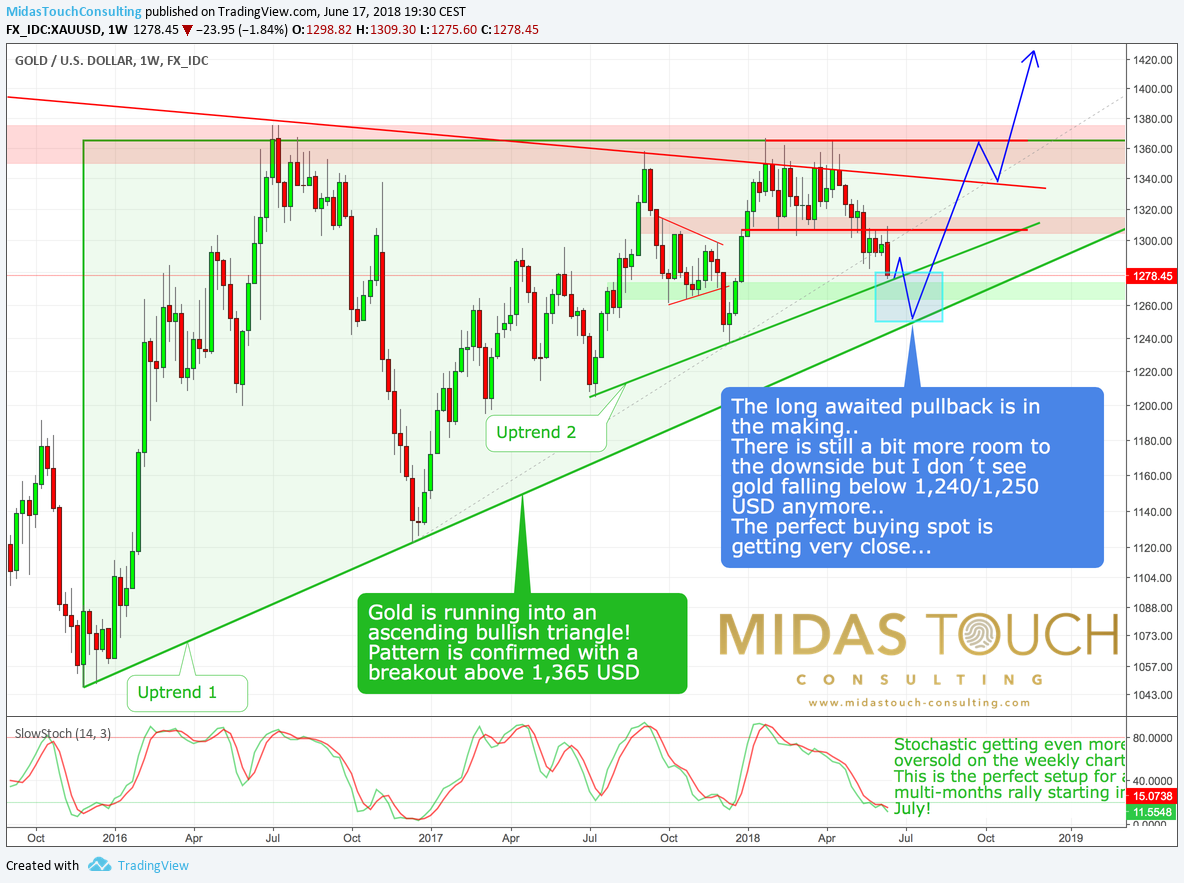
Gold weekly chart, as of June 17th, 2018. The oversold stochastic is the perfect setup for a multi-month rally starting in July…
Looking at the weekly chart for gold, Friday´s sell off did not harm the bigger picture at all. Instead I believe that this type of behavior is exactly what is currently laying out the perfect condition for the expected summer-rally! Of course and like most of the time, the market has chosen the path of maximum pain. Therefore expect some more downside over the next two to four weeks…
But the stochastic oscillator is already telling us, that gold is now really oversold on its weekly chart. Actually the situation is similar to last December. Back then gold rallied 130 USD within just five weeks.
Over all, gold and our Midas Touch Gold Model™ remain neutral with a slightly bearish undertone for the next couple of weeks. Maximum downside is probably 1,240/1,250 USD. Once the final low is in, I continue to expect a strong recovery and a multi months rally, that will push gold above its massive resistance zone around 1,350 USD and towards 1,500 USD in the 4th quarter 2018.


