


Halving – Facts versus Perception
Facts:
Miners are getting rewarded for digital transaction verification with bitcoins. These transaction verification’s are measured in blocks. After each 210,000 blocks “mined”, the reward amount gets to be half than the previously set reward. This has termed the events when 210,000 blocks are completed, “halving”. In 2009 when this process started the reward amount was set to 50 bitcoin per block. 2012 and 2016 had halving events. In May 2020 is the next event expected. Most likely in 2040 the reward sum will be at zero. It is this mathematical elegance in part, that limits total bitcoin production to 21 million bitcoin. For this reason bitcoin is comparable to a natural resource. A limited commodity like gold for example. In short, supply is limited.
Perception:
At first glance this elegance is brilliant. And it is of course from the point of it representing with its finite supply a model much desired. The process of halving reduces inflation risk to bitcoin. Just like the gold standard at its time, which limited uncontrolled currency printing. What we want to refer to is, that one needs to be careful to make conclusions too fast, on how this effects actual price behavior when trading bitcoin. Do we really have a statistical edge for prices to rise at halving events?
Bitcoin Weekly Chart, First Halving Event in 2012:
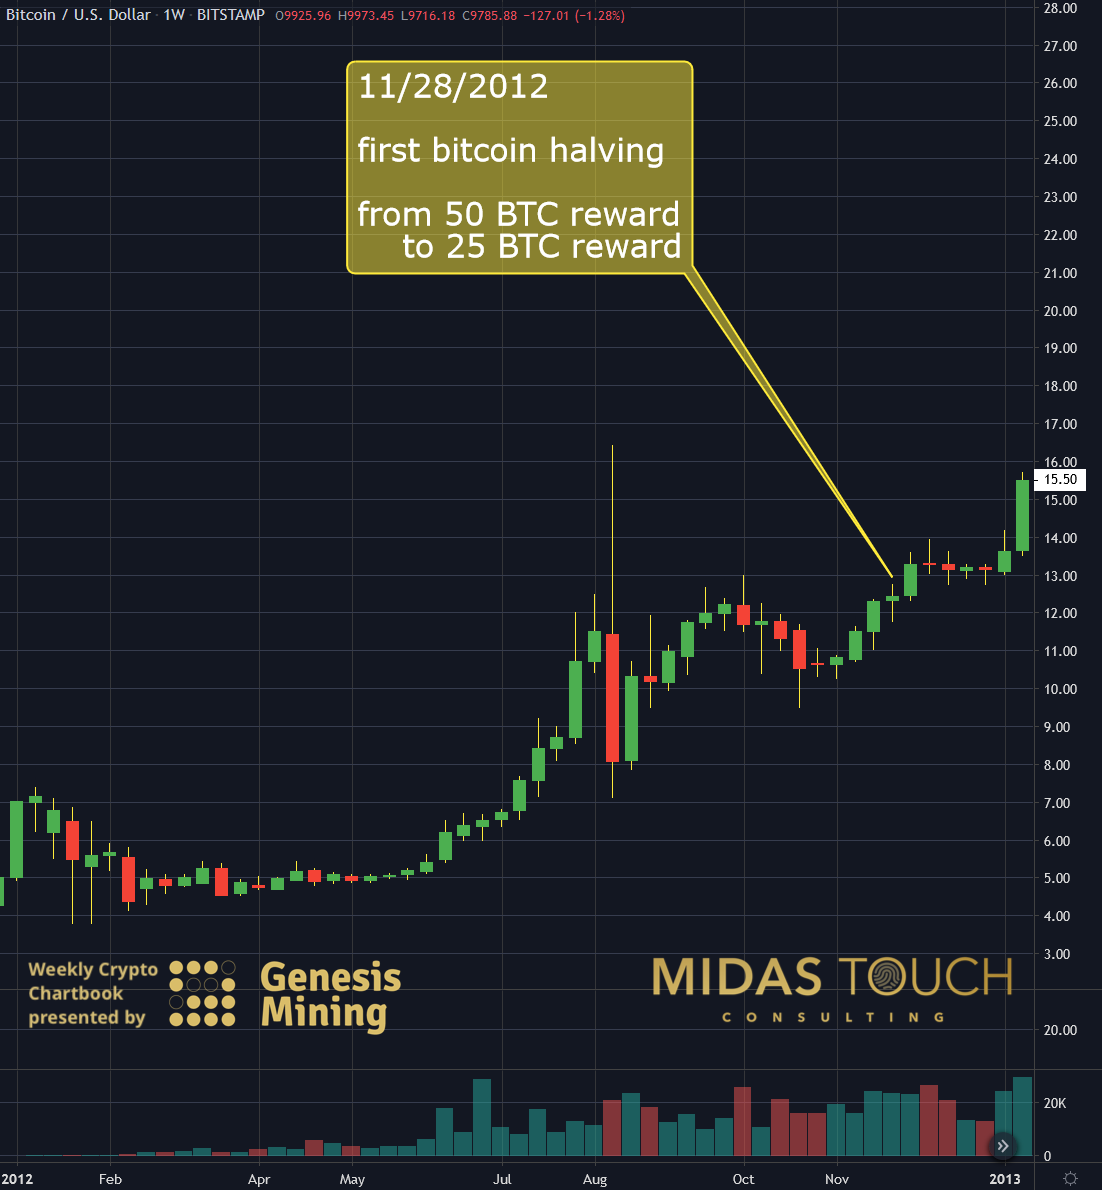
BTCUSD weekly chart 2012
In 2012 the first halving event occurred since bitcoins inception (Genesis block) 2009. Price was trading at US$12.31. In the weeks following the event, no significant price move has taken place.
Bitcoin Weekly Chart, Second Halving Event in 2016:
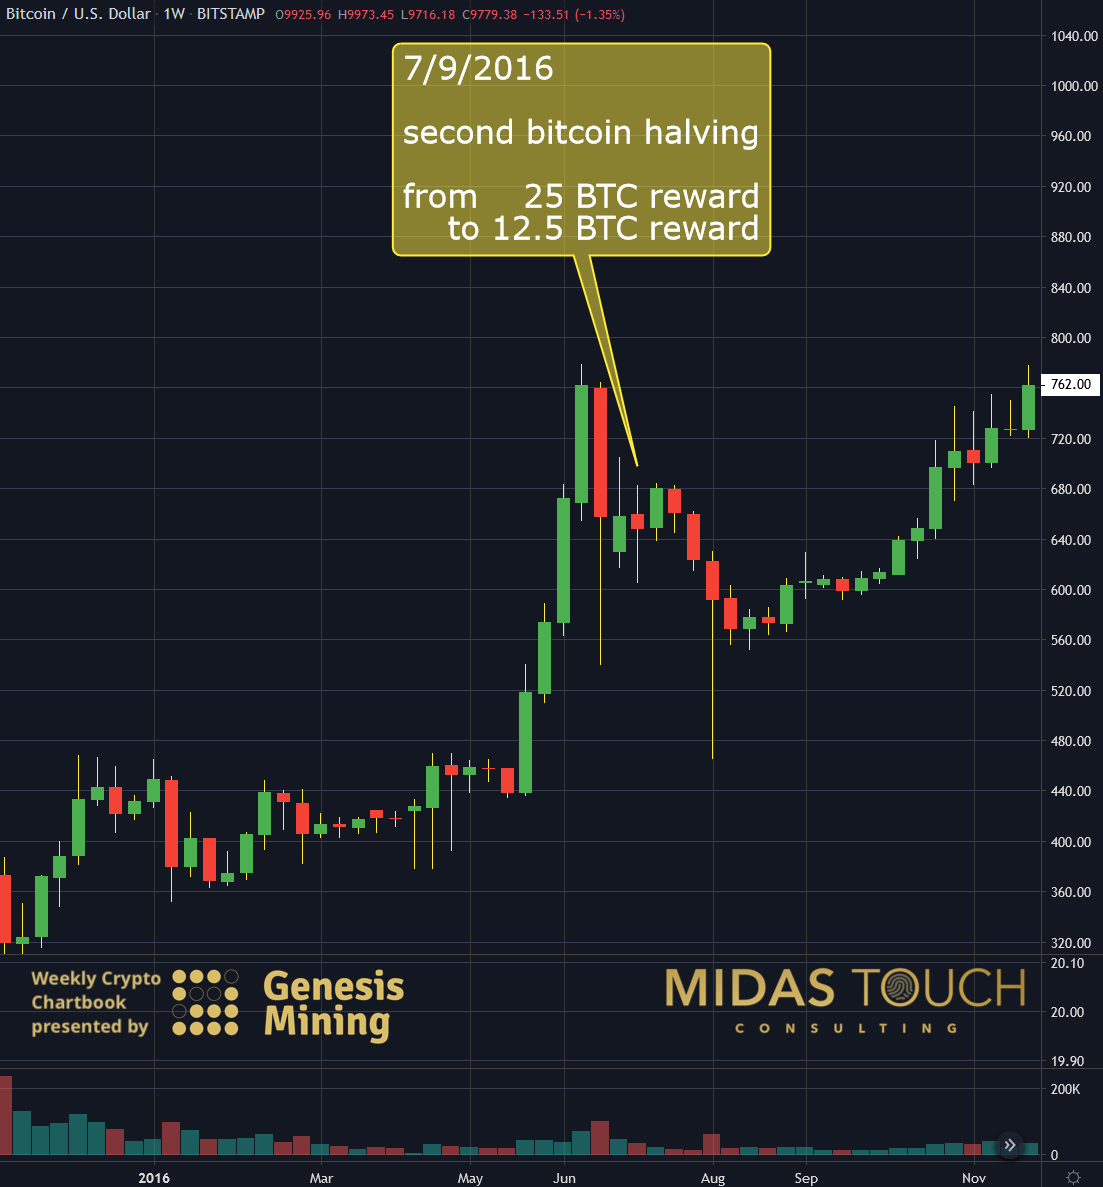
BTCUSD weekly chart 2016
Four years later, the rate in which these halving events are about to occur, we again have no clear price behavior signal proving this to be a good timing tool to enter or exit the market.
Bitcoin Monthly Chart, Halving – Facts Versus Perception:

BTCUSD monthly chart as of February 18th, 2020
What is evident in this monthly logarithmic chart, is that halving in the first two incidences is followed after an up leg in price (A). What can also be seen is that after the halving events more advances were taking place (B). This year´s halving also finds itself after a previous price advancement (A). Should we assume that this is a pattern? Bet the farm since the previous events had quite substantial percentage moves?
Halving – Facts versus Perception
It is easily perceived to see an edge here due to the fact of limited supply, demand might outweigh, meaning prices need to rise. Wrong! Fact is, that as much as this is a factor, supply and demand in the markets is much more based on market participants psychology. This outweighs everything else. So making a quick conclusion, that one has an exploitable edge at halving events from an entry timing perspective is, up until now, random. Human psychology in its repetitive nature has exploit ability, but this requires a statistically sound sample size. With the limited number of halving events so far, there is no true statistical edge to place a bet solely on these single events. That is not to say that this might change through time.
Bitcoin is in a bullish scenario and has just recently established an uptrend once again. Profiting from such bullish behavior requires finesse. It is not as easy as to trade single news publications or events like halving on their own. Knowing when, and how much, to buy and sell, to consistently extract profits from the market requires in depth knowledge and experience. We share our principles and execution timing as well as charts live in our telegram channel.
If you like to get regular updates on our gold model, precious metals and cryptocurrencies you can subscribe to our free newsletter.

