


Bitcoin´s baseline data has changed.
A baseline is a minimum or starting point used for comparisons. Markets are a reflection of human behavior. And the actual price is a future projection of the collective of participants in the market. For probability measurements of chart evaluation, no matter if one refers to algorithms, chart pattern evaluation, or any type of chart interpretation, baseline data is used. Meaning data comparisons by averages and past performance analysis, that builds the reference points. But the last fifteen months do not line up as another data set to be integrated into baseline data as usual. Bitcoin´s baseline data has changed.
We are not saying that principle behavior like fight/flight mechanisms needs questioning. Still, our market observations have shown that typical inter-market relationships are more than just out of whack. New datasets can’t be absorbed with the result of a barely noticeable change of some averages. Weighing the multitude of last year’s changes to world economies proportionally stronger might help to operate from baseline data changes that allow seeing the market more clearly. Consequently, creating an edge even to foresee six sigma events and a wealth preservation approach that outperforms all those who are more prone to work from averages with the underlying wish of a status quo.
BTC-USD, Daily Chart, Last weeks chart:
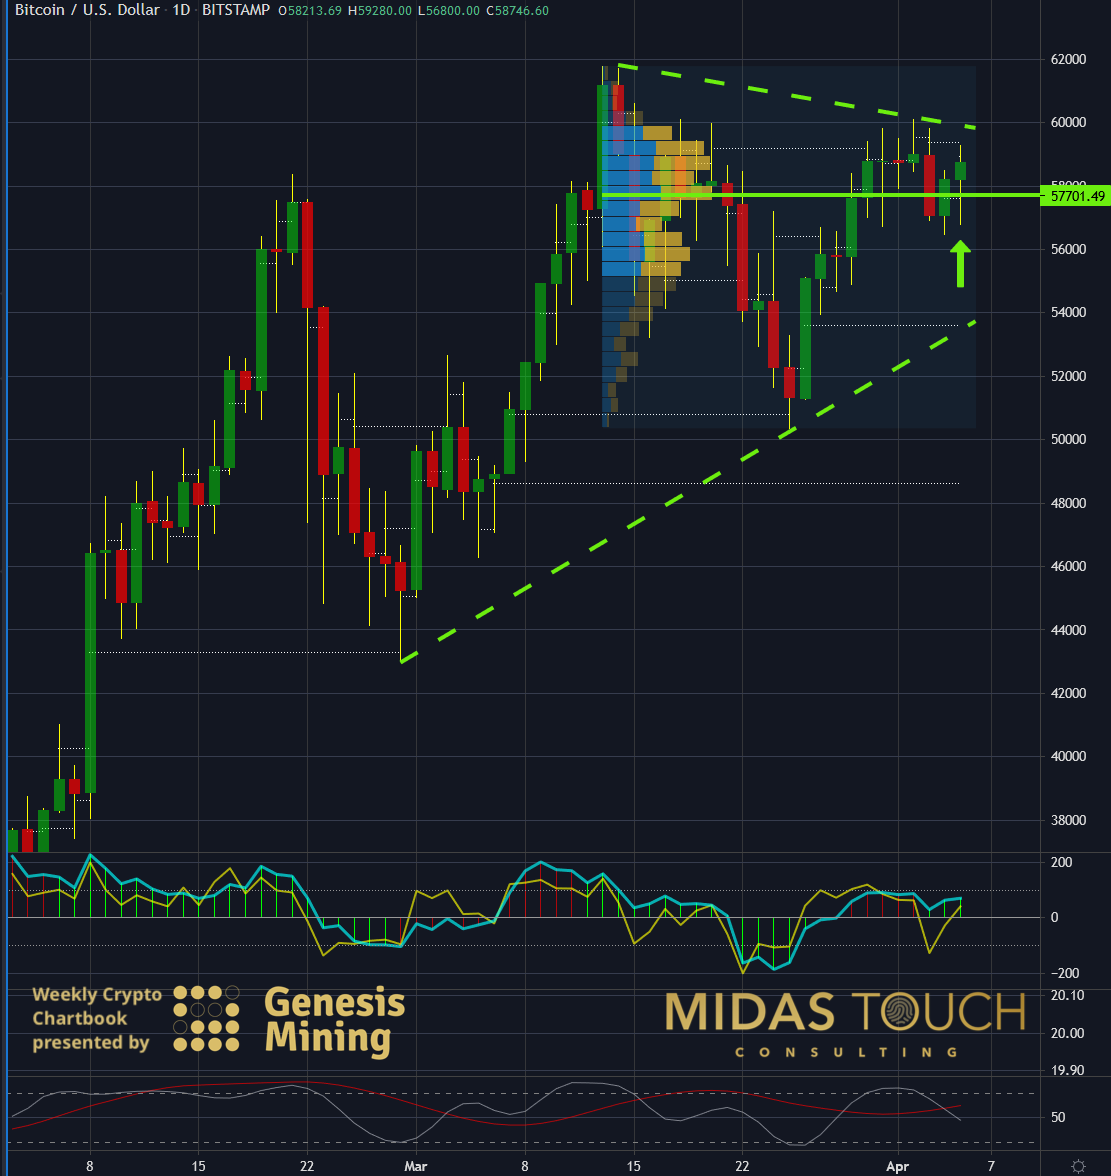
Bitcoin in US Dollar, daily chart as of April 5th, 2021.
We posted the above chart in our last weeks chartbook publication.
“The wealth preservers” (coining a new asset class), being mainly Bitcoin, Gold, and Silver, have already changed in their trading behavior. Measuring their performance and typical trading movements by insisting on past comparisons only would skew one’s systems to underperform. With fundamental strength changes of this magnitude, one needs to be on one’s toes. One needs to integrate newly found principle extractions on how this asset class has its own characteristics. It will turn into a bull market with some typical and atypical expansions for the years to come.
BTC-USD, Daily Chart, Changes since last week:
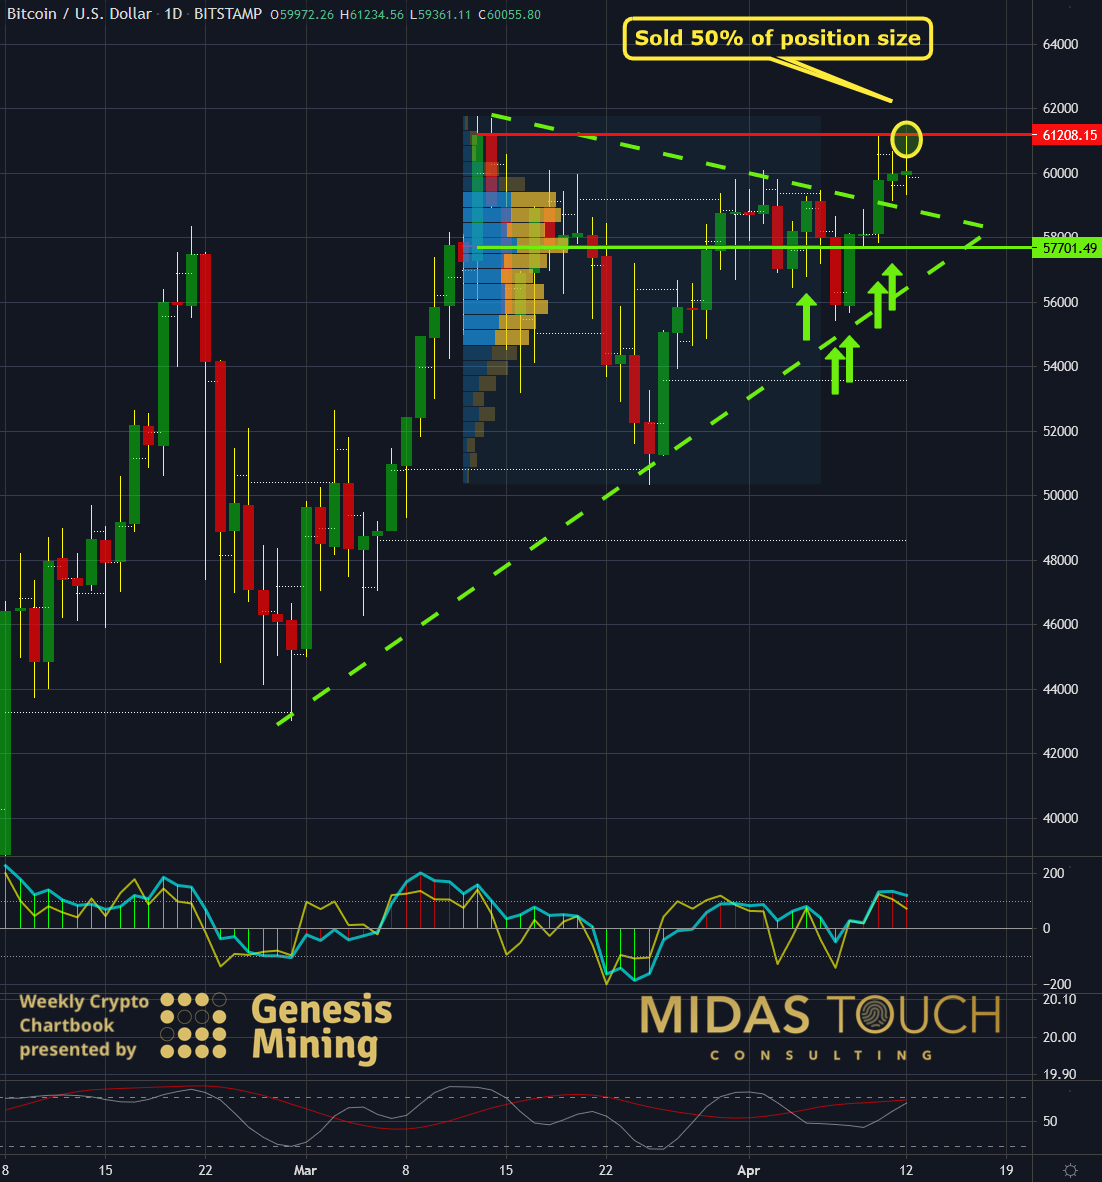
Bitcoin in US Dollar, daily chart as of April 13th, 2021.
Comparing this chart to last weeks chart, you can tell we were busy. Aggressively we have taken each opportunity of a low-risk play. We did so due to findings that once Bitcoin sets in motion above a last all-time high, it trades with little low-risk opportunities to enter the leg. To be positioned before a breakout is vital. With our Quad exit strategy, we eliminated risk entirely by taking half of the positions’ size off the table for substantial profits at the triple top. We posted all trades in real time in our free Telegram channel.
More rigid approaches like exclusive algorithmic trading have already seen some damage to those holding on too tightly, insisting on past evaluations to transfer into the future. This has led to hedge funds accumulating dramatic losses in a very short time on high leverage. Consistent backtesting and learning from last year’s trading behavior changes across all markets is the primary homework for professional market participants now and in the future to come.
BTC-USD, Weekly Chart, Advanced projections:
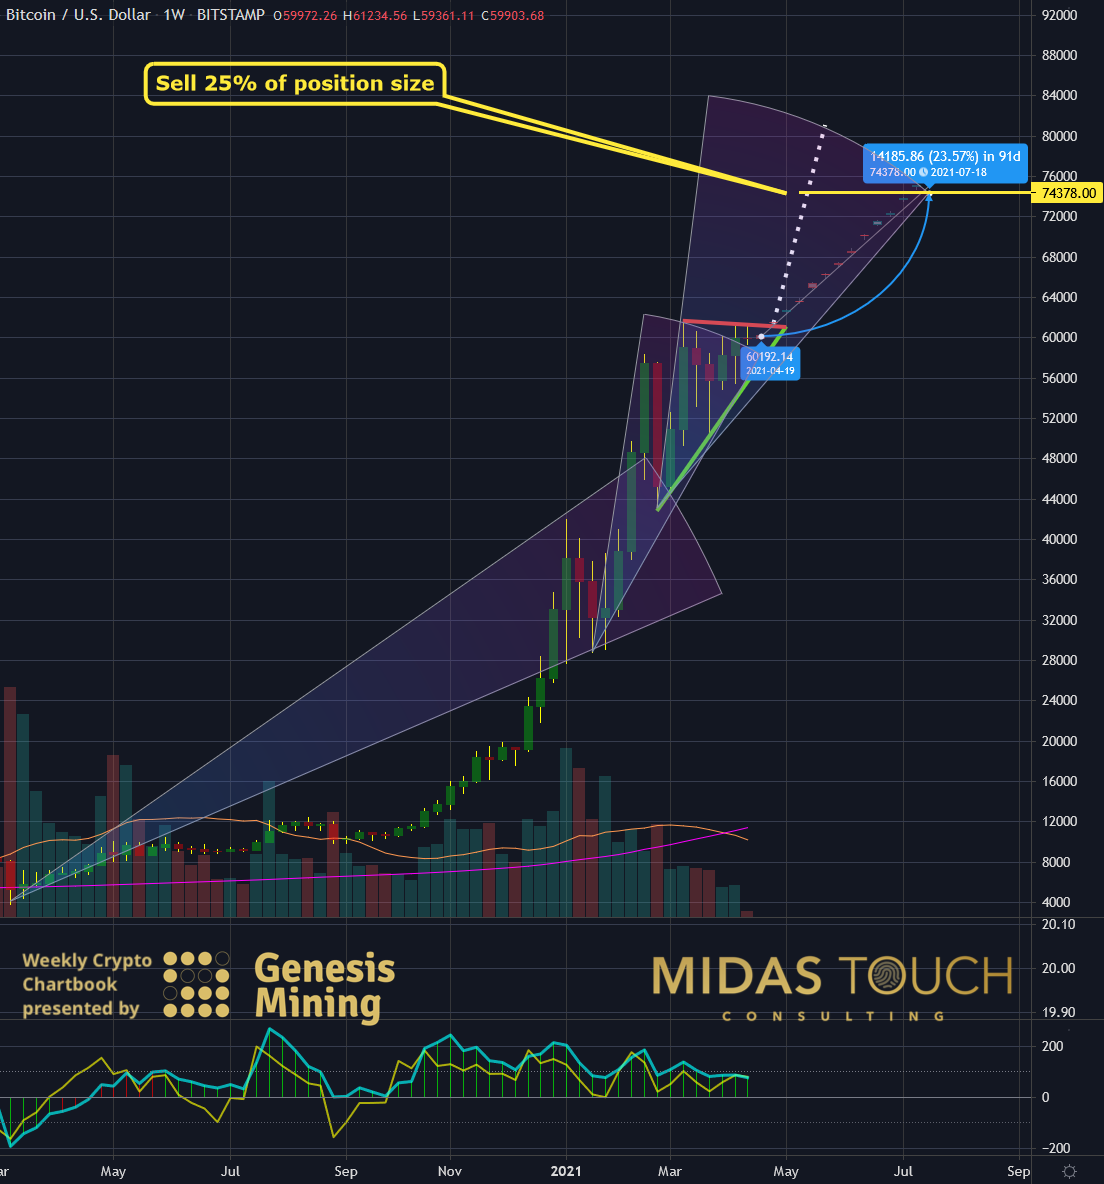
Bitcoin in US Dollar, weekly chart as of April 13th, 2021.
We have investigated small time frames in detail and have found the rate of change reflected in market behavior. Markets holographic in nature will reflect this new speed or change overall in longer time frames as well. Changing a few indicator settings or an MAE (Maximum Adverse Excursion) setting will not solve the abnormality. We are entering into a new era and markets reflecting this change. An open mind and scrutinizing ongoing market analysis is necessary to keep up to speed.
Consequently, we changed entry placement as shown in the second chart of today’s publication. This alongside money management. We also find that a larger time frame target assessment needs a haul over. Typical target evaluations through fixtures like Fibonacci extensions and alike will have a much shorter shelf life. It is essential now to adjust target assessments more frequently based on actual trading behavior within each extension and retracement leg.
Bitcoin´s baseline data has changed
More often than not, it has been contrarians that have outperformed the markets. And within that group, it has been those who supported their theories by thinking outside the box that walked away with true wealth. Is it likely that recent changes in the economy will return to a norm of the past? If not, then baseline data needs to be created a bit more creatively than just adding a few months of abnormality to history. Larger cycles need to be addressed with a variant degree. In this case, accelerating the rate of change as such specific data should not be relied on. Instead it needs to be creatively reflected and expanded into a possible new future.
When uncertain, we tend to compare to find comfort in status quo outcome possibilities. Real-time data speaks a different truth. We encourage filtering baseline data for principled-based historical data only! Add a punch (not a pinch) of a realistic view of the future.
Feel free to join us in our free Telegram channel for daily real time data and a great community.
If you like to get regular updates on our gold model, precious metals and cryptocurrencies you can subscribe to our free newsletter.

