Bitcoin market, the ultimate enforcer
In ice hockey, a player called the enforcer makes sure that the team’s superstar player isn’t constantly getting hurt by foul play of the other team. How? He will come after whoever hurts his team star player in the form of a brutal fistfight. These enforcers are so significant that superplayers insist that their enforcers be traded alongside once they get traded to a different team. Intimidation is a substantial factor in a competitive environment. The intimidated aren’t acting freely. Like a deer in the headlights, they freeze. This principle effect is all present in the world of market play. With an extremely high failure rate initially, market players can feel intimidated by the all mighty invisible presence of the market. Bitcoin market, the ultimate enforcer.
The market doesn’t care. It isn’t budging to any of your moves. The market can evoke inappropriate responses on your side by depleting your financial security and self-confidence. This can have a similar effect for a trader in the situation of execution. They freeze. Another failure confronted with the shock of yet another stop level hit makes the speculator incapable of acting. They watch victimized how prices go way beyond their comfort level and planned exit price. Intimidated, they sit and might lose their livelihood in a single trade.
This Bitcoin trend is worth the extra effort to face the enforcer.
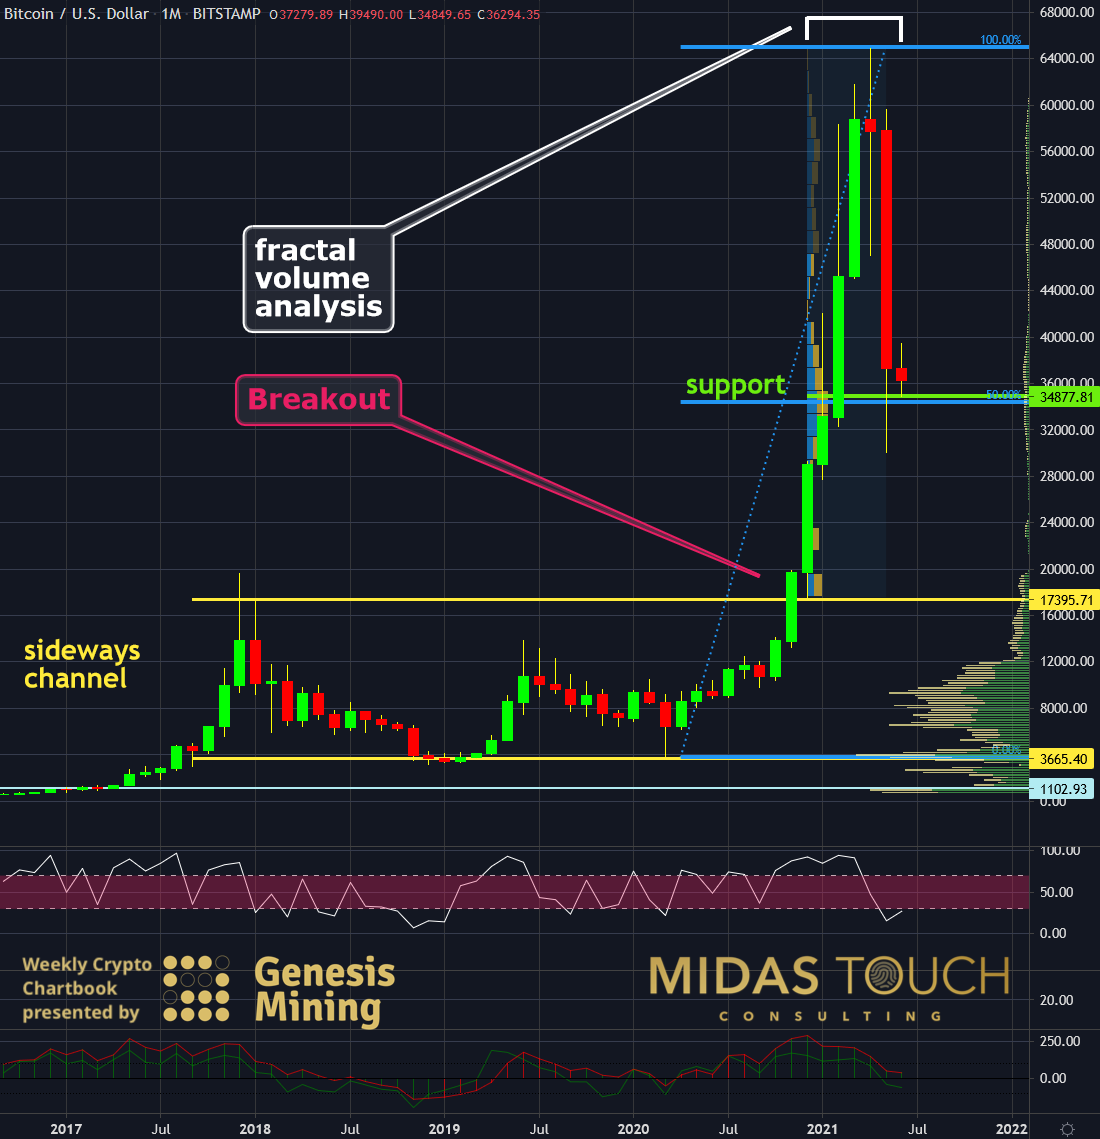
BTC-USD, Monthly Chart, First things first, overview:

Bitcoin in US-Dollar, monthly chart as of June 7th, 2021
To escape the ‘enforcer’, the most crucial factor is emotional removal. Markets trigger emotions, and the top-down approach on a quiet chart (not moving) is critical here. Whether you are a long-term investor or a short-term position trader, you always want to be on the side of the most potent force. The most significant player is the monthly chart´s direction.
While recent events might dampen the mood if you are positioned in Bitcoin, the monthly chart above shows that everything is in a healthy order of Bitcoins directional expansion move. Bitcoin had broken a multiyear sideways range and advanced nearly fourfold after its breakout from the channel highs. It retraced by 50%, which is conservative for Bitcoin. A fractal volume analysis shows precisely at the same supply zone as the Fibonacci analysis support (green horizontal line).
Should emotions have cooled off for participating in the Bitcoin market, then these emotions are deceiving. The retracement might have intimidated you, while with a fresh view at this chart, the professional trader should think: “Entries”. This month and maybe even the next month might represent a sideways market. More importantly be prepped for large time frame entries.
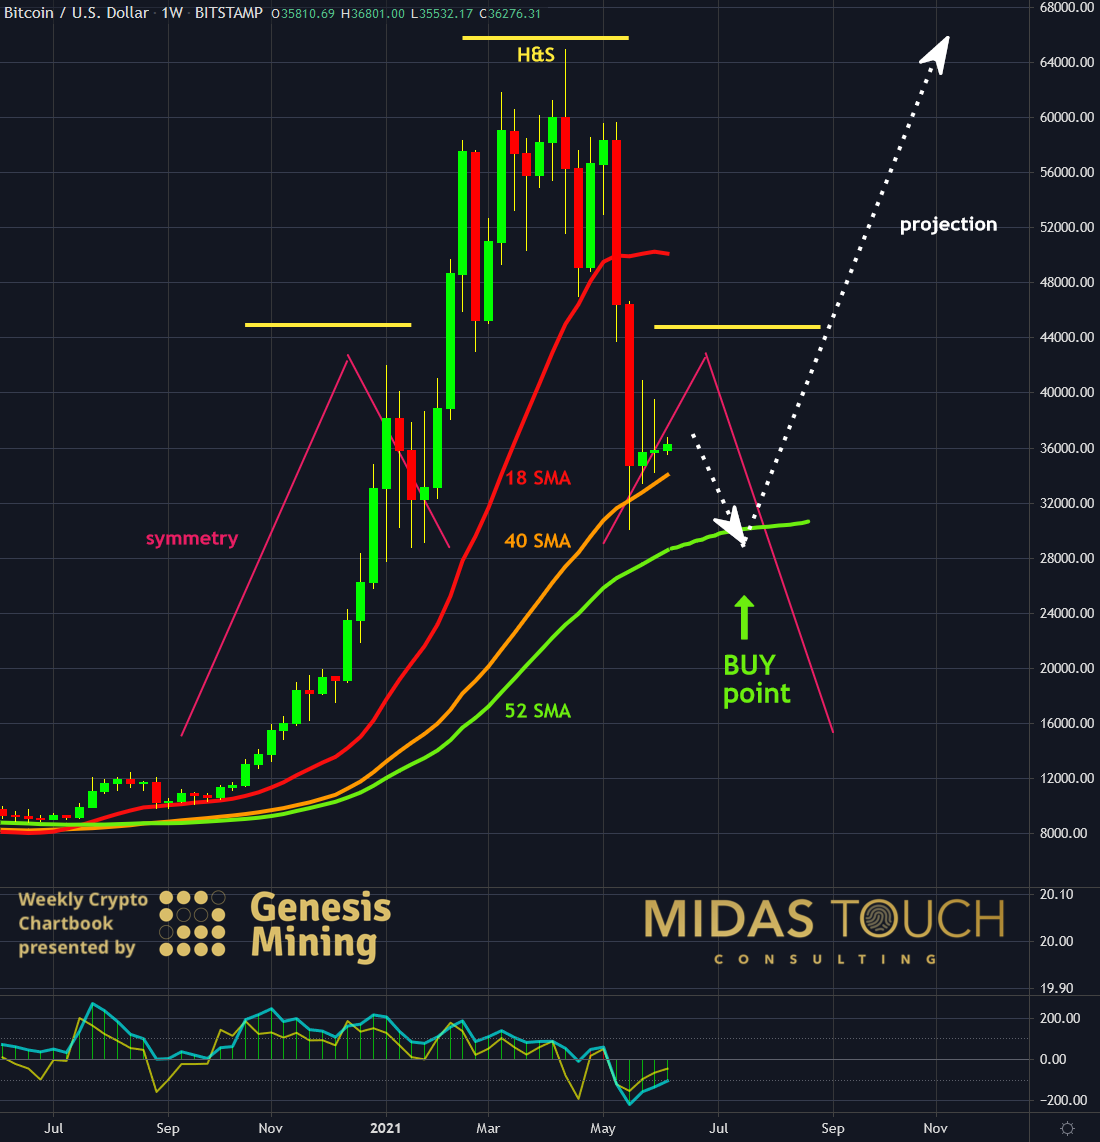
BTC-USD, Weekly Chart, Making Plans:

Bitcoin in US-Dollar, weekly chart as of June 7th, 2021
To stay emotionally balanced and independent of the market’s possible intimidating moves, it is best to be prepared with a plan.
On the weekly chart above, you see part of one of our strategies of how the future might unfold. Once price penetrated the 18 simple moving average (red) prices declined swiftly.
Right now, they creep up the 40 simple moving average (orange), but probabilities are in favor of a retest of recent lows near US$30,000. (= a break of the 40 SMA). While this price level is also equivalent to the neckline of a head and shoulders formation (yellow), we anticipate, after a swift spike through the 52 simple moving average to hold and prices (white dotted line), to advance from there.
This leaves us with an entry zone near levels of US$27,000 to US$31,000, which we will fine-tune on a smaller frame at the time of entry. All our entries and exits are posted in real-time in our free Telegram channel.

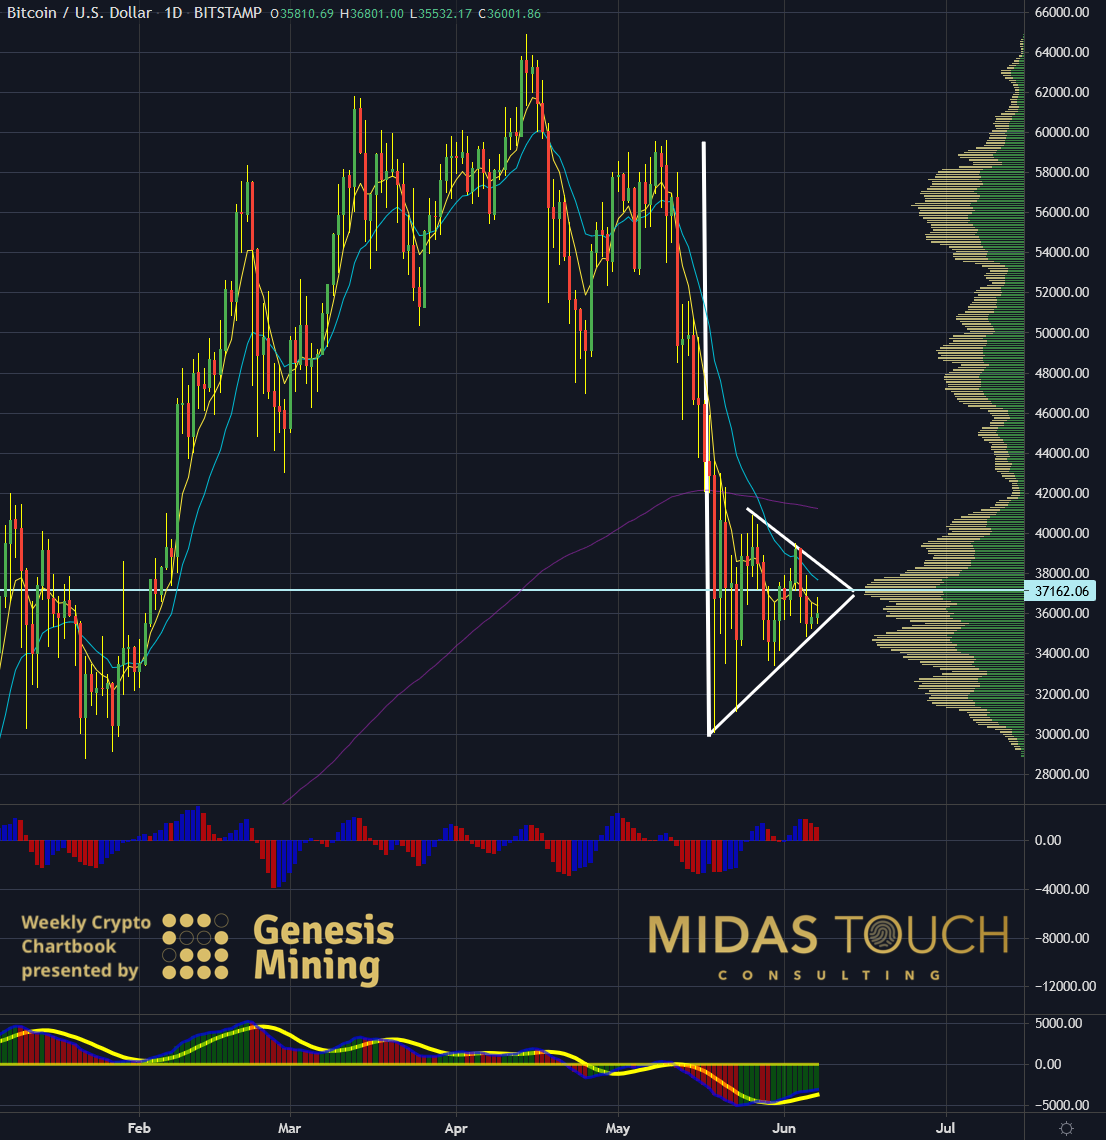
BTC-USD, Daily Chart, Low risk first:

Bitcoin in US-Dollar, daily chart as of June 7th, 2021
Safety first is critical. In trading, this means risk mitigation at all costs. No one knows a specific level of entry where the markets will turn. Gladly you do not need to. What you do need is a methodology to protect your capital. Keeping your losses small in the case you are wrong. We use quad exits to ensure this risk reduction. The daily chart above shows a confirmation of our prior higher time frame assessments. As much as we are generally in an attractive long-term investment entry zone, we do not trade from a time cycle in a low-risk environment just yet.
The bear flag formation with prices right below POC warrants patience to wait for time cycles to provide more low-risk entries in the future. POC = point of control = high volume node as a strong distribution zone.
Bitcoin market, the ultimate enforcer:
In the case of Bitcoin, the market isn’t the only intimidator. An accumulation race around the globe has ensued. Governments, central banks, financial institutions, hedge funds, large investors, and now you are all after the digital currency. Naturally, the big players throw every trick in the book at their opponents. Minor players quickly are squashed by altered chart patterns and unusual market behavior on all time frames.
Therefore, what is required is a humble determination not to be intimidated out of this market. Certainly, a rare source of wealth protection over the following years, if not decades. We have managed by applying ourselves daily in analysis and research to extract fundamental data and technical principles that work as stacked edges in trading this complex market throughout various time frames.
We share our findings in our free Telegram channel with full transparency. In addition, you will also find there our real-time entry and exit signals to encourage investors and traders alike not to be bullied out of this significant market niche. Consequently, being part of what we foresee as the biggest bull run in Bitcoin´s history.
Feel free to join us in our free Telegram channel for daily real time data and a great community.
If you like to get regular updates on our gold model, precious metals and cryptocurrencies you can subscribe to our free newsletter.


