


Gold – Fight around the 200-day moving average not yet decided
Since mid of November the rally in the gold market has become more and more tenacious and whipsawing. And over the last few weeks gold has been trading sideways. Actually, we witnessed only slightly new highs and four sharp pullbacks. Overall, our assumption that gold would oscillate around the 200MA for a while has played out. But for how long will this choppy and overlapping advance continue? Gold – Fight around the 200-day moving average not yet decided
Review
Starting from the triple bottom around 1,615 USD, gold managed a strong recovery over the last eight weeks. So far, this “bounce” culminated in a 5-month high around 1,833 USD on December 27th. Initially, this rally looked like a sharp and “short squeeze-like rally”. Since a first interim high around 1,786 USD on November 15th, however, the continued rise has been increasingly sluggish and erratic.
Ultimately, gold bulls and gold bears have been fighting since December 1st in a wild back-and-forth around the still falling 200-day moving average line (1,782 USD). This resulted in a sideways trading range, primarily between 1,770 USD and 1,820 USD for December. As prices are currently trading around 1,805 USD, a clear decision has not yet been made. However, the renewed rally to almost 1,833 yesterday (Tuesday) seems as if the bulls are not yet willing to make room for a healthy pullback. Yet, the sharp reversal thereafter is a warning sign.
Since September 1st, Silver recovered by 38%!
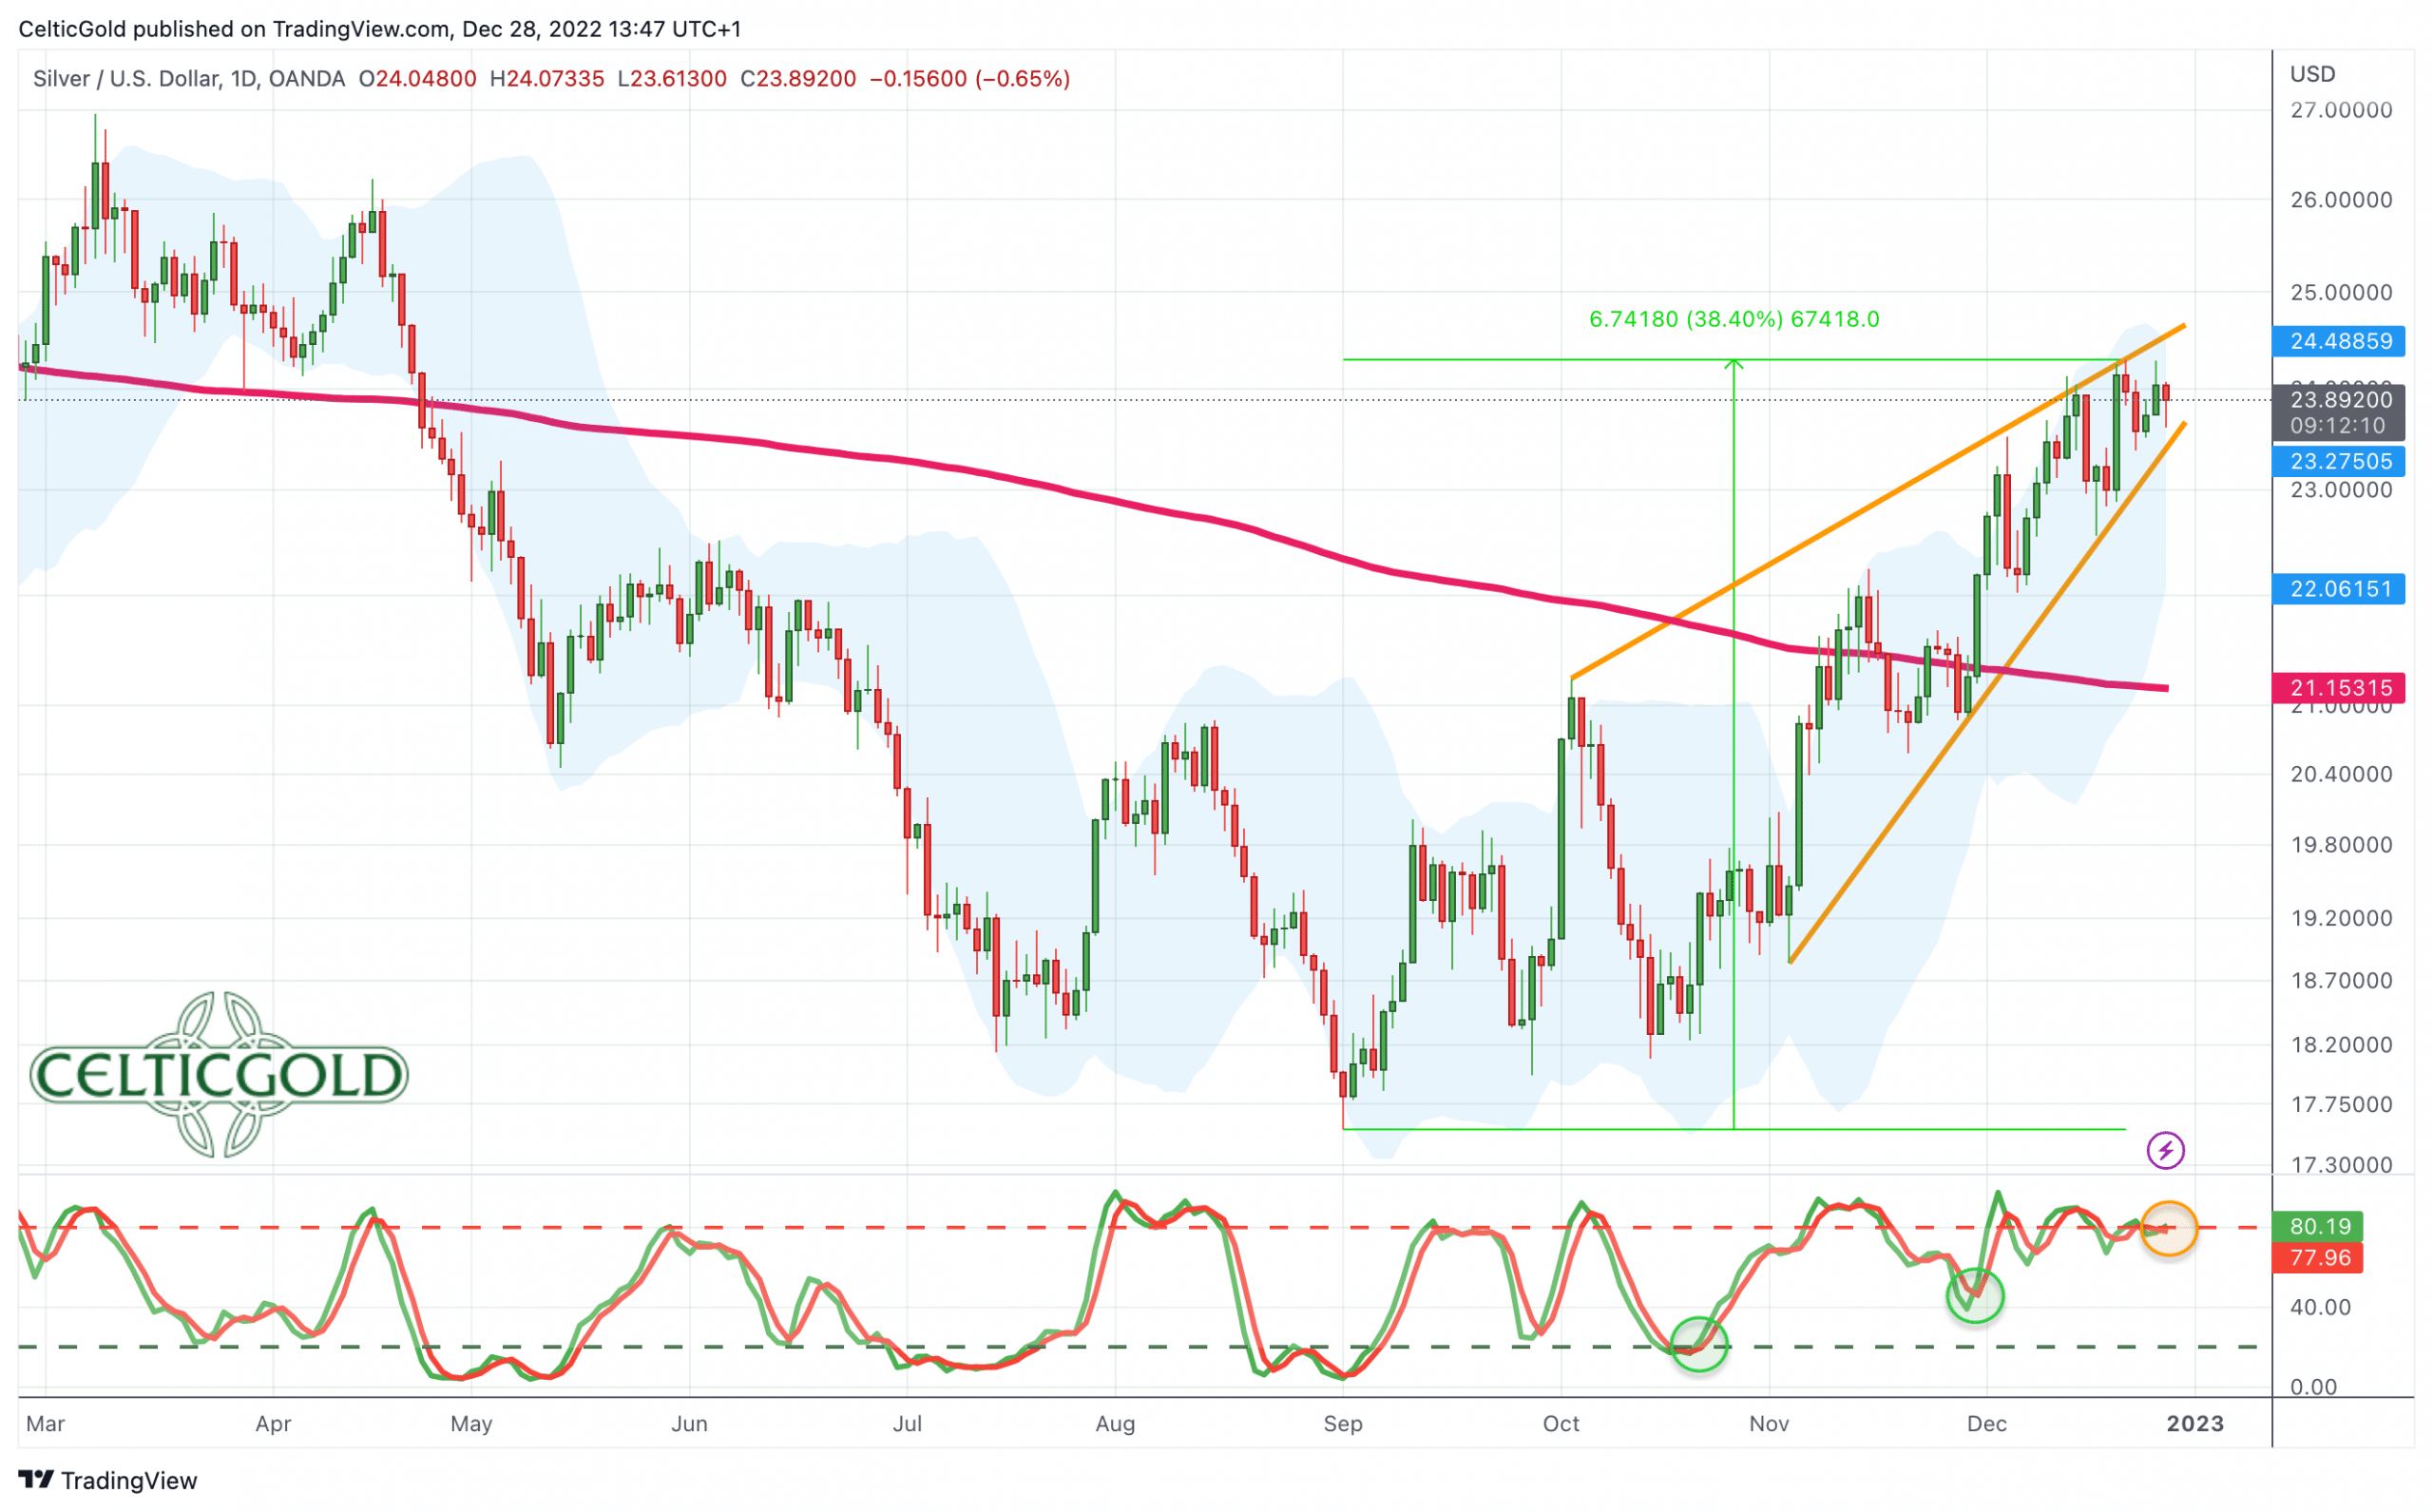
Silver in US-Dollar, daily chart as of December 28th, 2022. Source: Tradingview
In contrast, silver presented itself extremely strong in the same period. Overall, silver managed to recover by over 38% since its low at 17.56 USD on September 1st. With a current double top around 24.30 USD, silver bulls have recaptured the 200-day moving average line (USD 21.12) since four weeks already. However, the warning signals on the daily chart are now increasing and a pullback to the falling 200-day moving average line must be anticipated soon.
The entire recovery in the precious metals sector is carried by the correction in the US-Dollar. The US-Dollar had almost non-stop been rising from the beginning of the year until the end of September. The euro, for example, lost from over 16% down from 1.136 USD to 0.953 USD against the greenback. However, in the last three months, the strongly overbought situation caused a big recovery rally in the euro and a significant correction in the US-Dollar.
Shortly before the turn of the year, the question remains whether the rallies in precious metals and in the stock markets merely represent a countermovement or whether an important and longterm turning point may have been reached in all market sectors during this fall.
Chart Analysis Gold in US Dollars
Weekly chart: Prices running into a bearish wedge
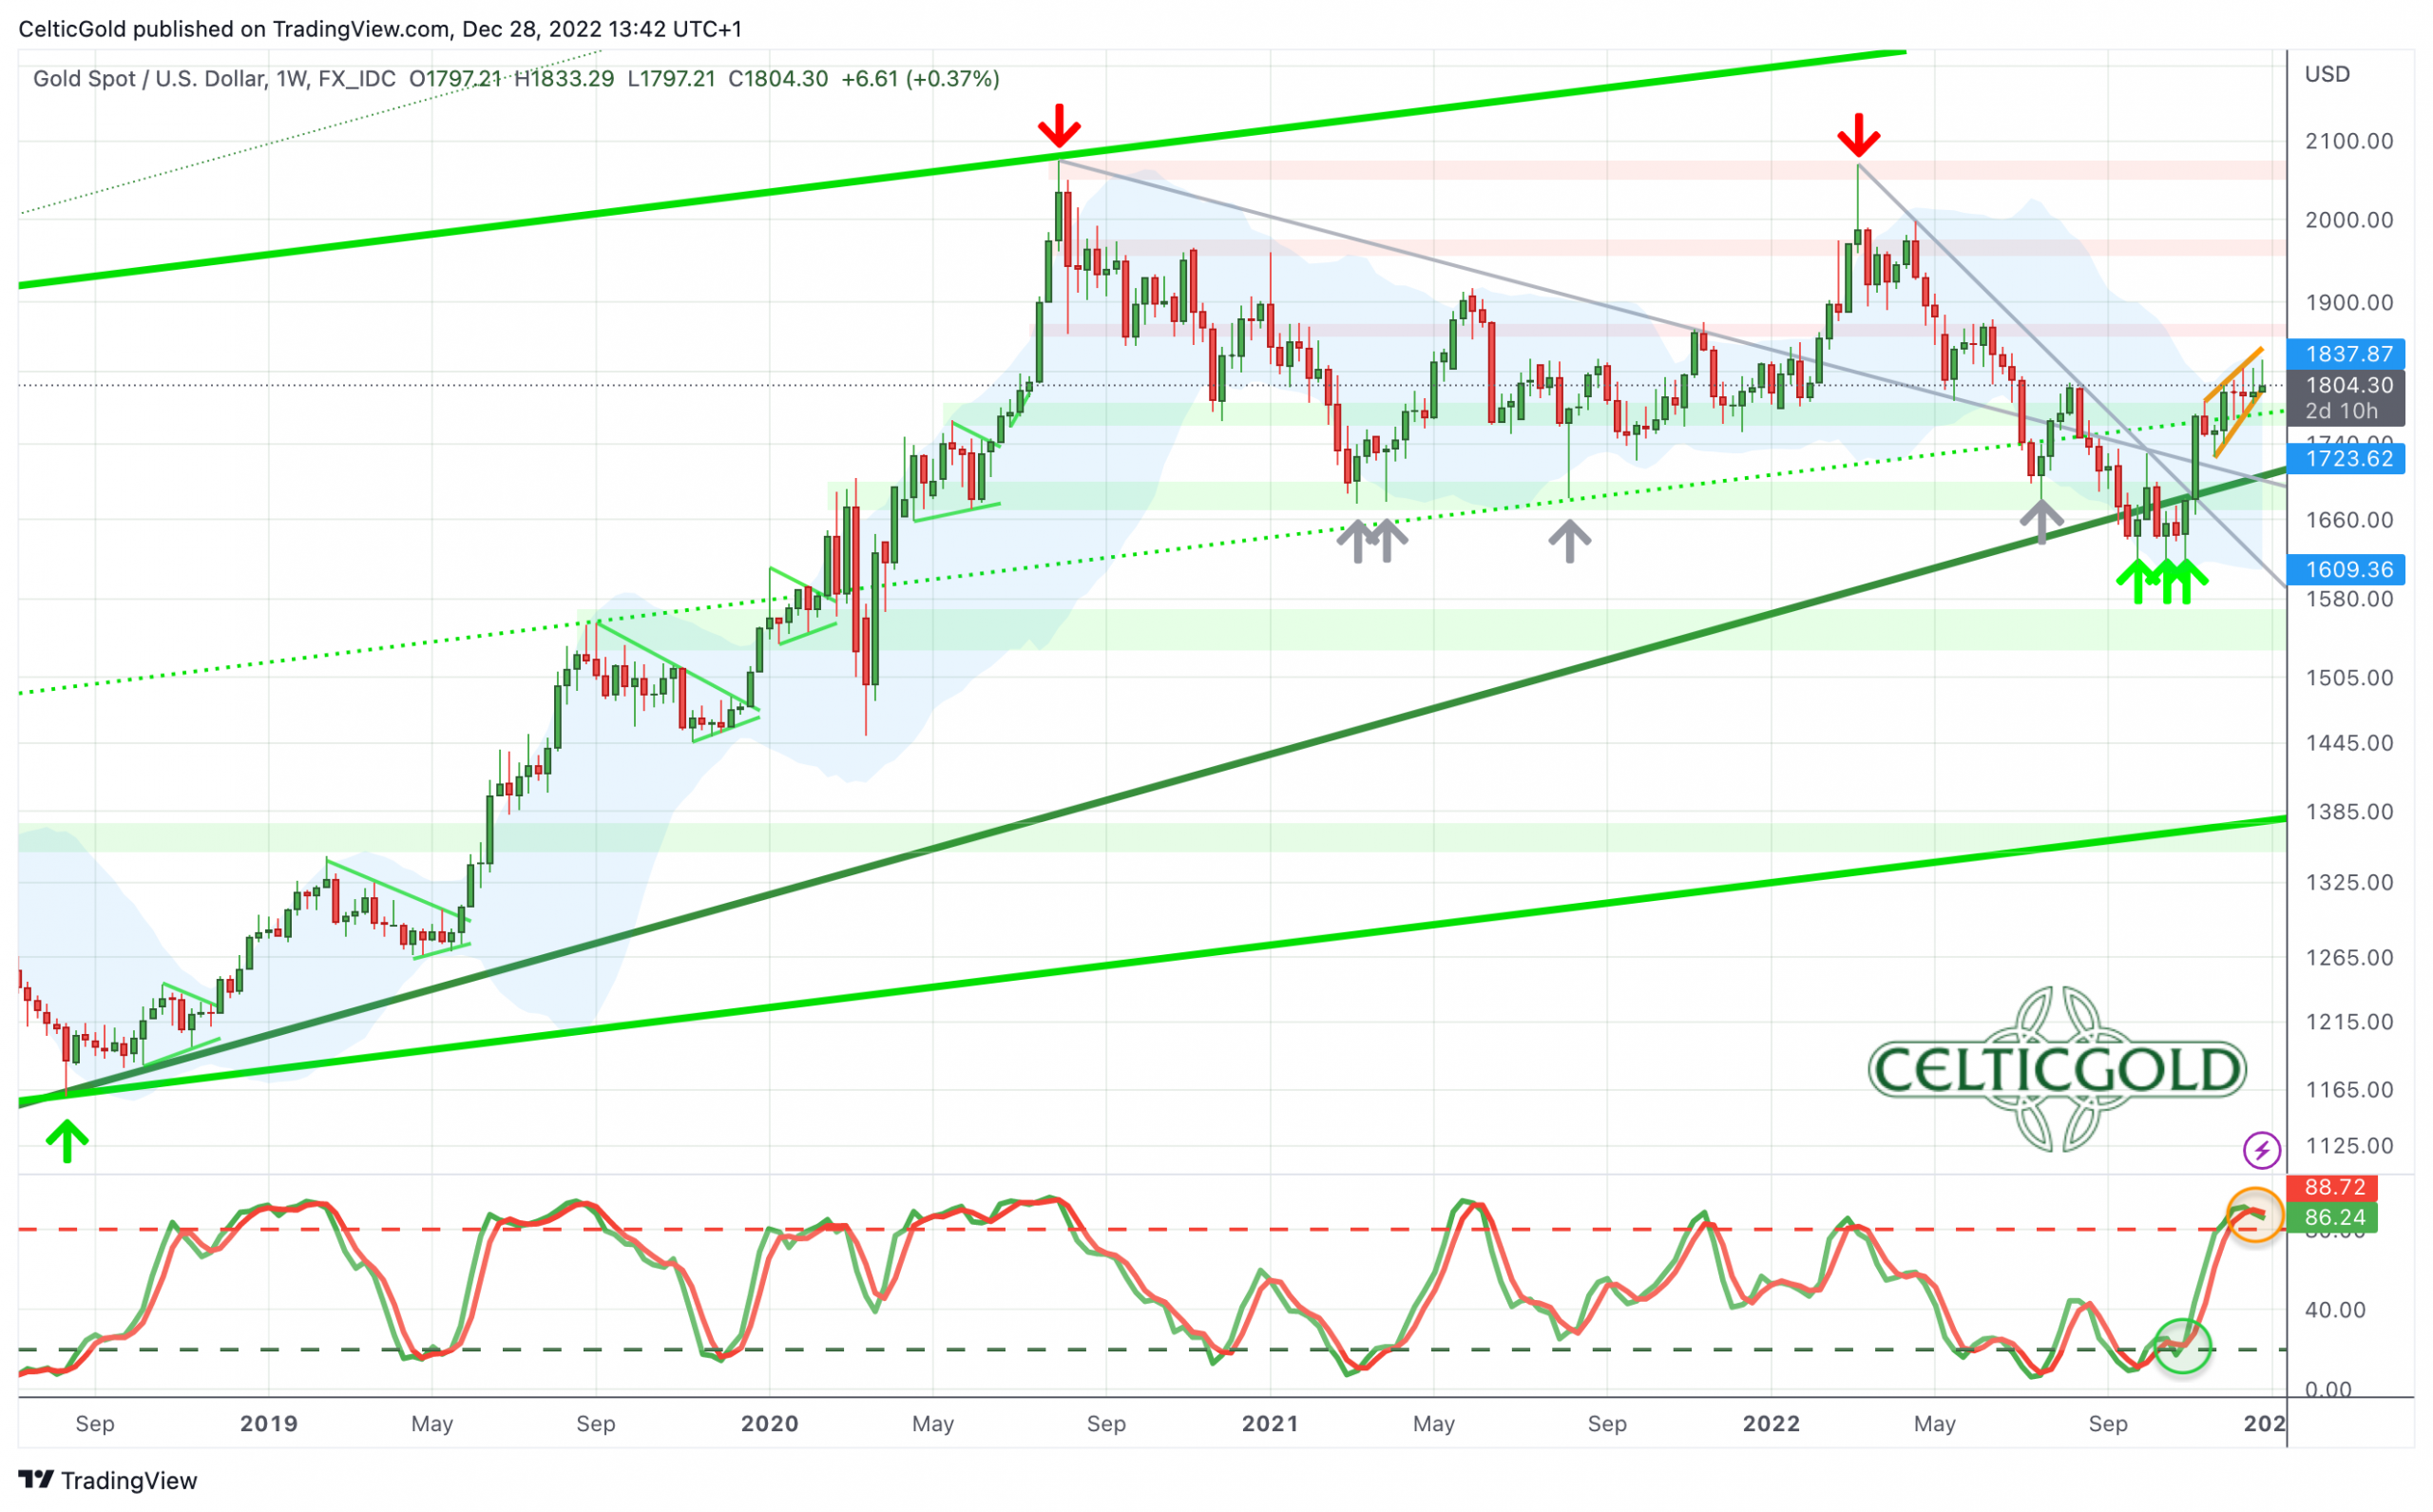
Gold in US-Dollar, weekly chart as of December 28th, 2022. Source: Tradingview
After the ongoing eight-week recovery rally in the gold market, the set-up on the weekly chart has improved, of course. Nevertheless, the correction that has been underway since August 2020 cannot yet be declared over. For this, a new all-time high with prices above 2,075 USD would be needed as the ultimate confirmation. Until then, about 275 USD or around 15% are currently missing.
In any case, the triple bottom since early November provided a significant recovery. However, this rally has increasingly stalled since the beginning of December and is losing its momentum. Hence, we still need to assume that this rally could merely be a counter-trend movement. If, on the other hand, the triple bottom was indeed the end of the correction that has lasted for more than two years, then gold should already be on its way towards the 2,000 USD mark.
The next pullback will bring more clarity
In search for more clarity, the next pullback in the gold market should provide important information. If gold can hold around 1,730 to 1,750 USD or at the latest around 1,680 USD, the end of the two-year correction remains the preferred scenario. If, on the other hand, gold prices would fall below 1,680 USD again, the correction will drag on and could even deliver new lows around and below 1,600 USD in the medium term.
Looking forward towards the next few weeks, the overbought stochastic and the emerging bearish wedge are warning signals and advise caution. In principle, a pullback would be healthy and even desirable. Only in this way gold could recharge and regain strength for further increases. In the most optimistic case, gold could then rather quickly knock on the resistance around 2,000 USD by the spring. More realistic, however, would be a deep pullback, which should happen soon and would clearly postpone a rally towards 2,000 USD.
Overall, the weekly chart is still bullish, but the warning signals are increasing. The rather overheating situation would only ease with a pullback towards around 1,750 USD.
Daily chart: Fight around the 200-day moving average not yet decided
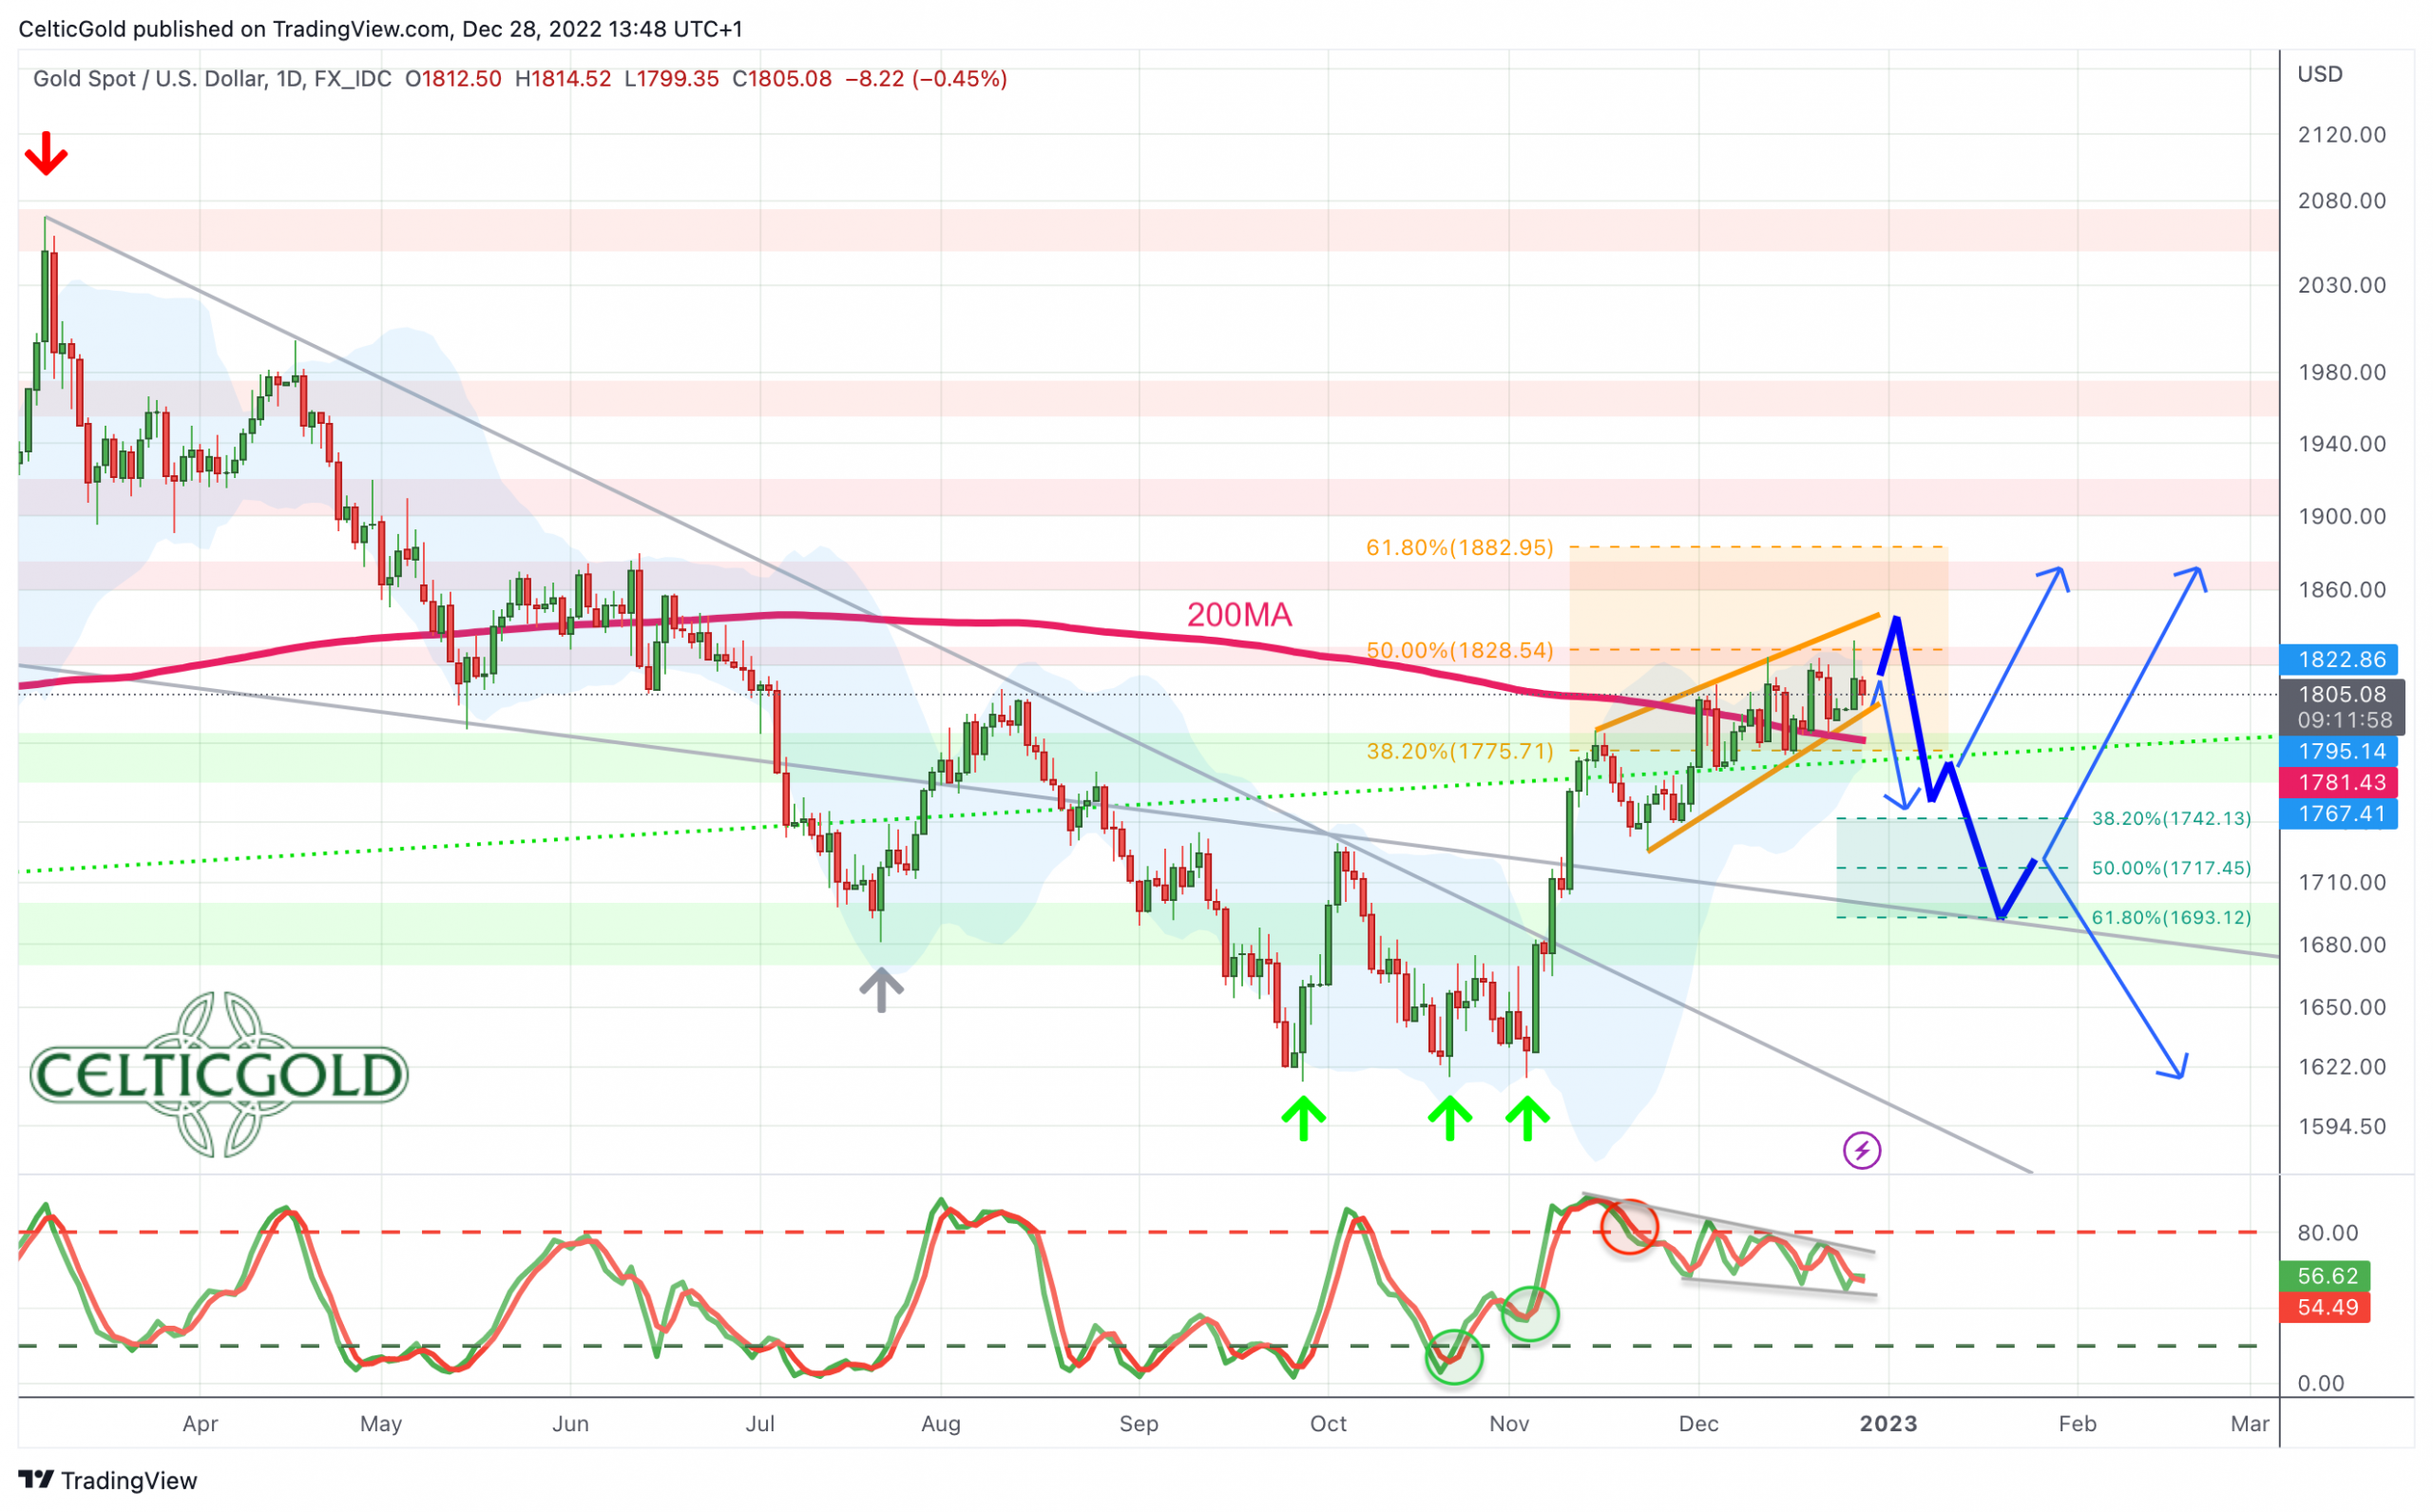
Gold in US-Dollar, daily chart as of December 28th, 2022. Source: Tradingview
On its daily chart, gold has been oscillating around its falling 200-day moving average (1,782 USD) since the beginning of December. Although the bulls were mostly able to hold prices above this much-observed and classic average, a decision has not yet been made. At the same time, the stochastic oscillator is whipsawing below its overbought zone, indicating that there is no clarity in momentum. Furthermore, the upper Bollinger Band (1,824 USD) offers only little room on the upside.
All in all, the risk/reward-ratio is now rather unfavorable for the bulls. Based on the increasing tenacity of the recovery rally (low at 1,616 USD and high 1,833 USD), a healthy correction should be expected soon. A potential target would be the 38.2% retracement at 1,747 USD at least. But only below 1,680 USD would the bears be back in charge.
Commitments of Traders for Gold – Neutral
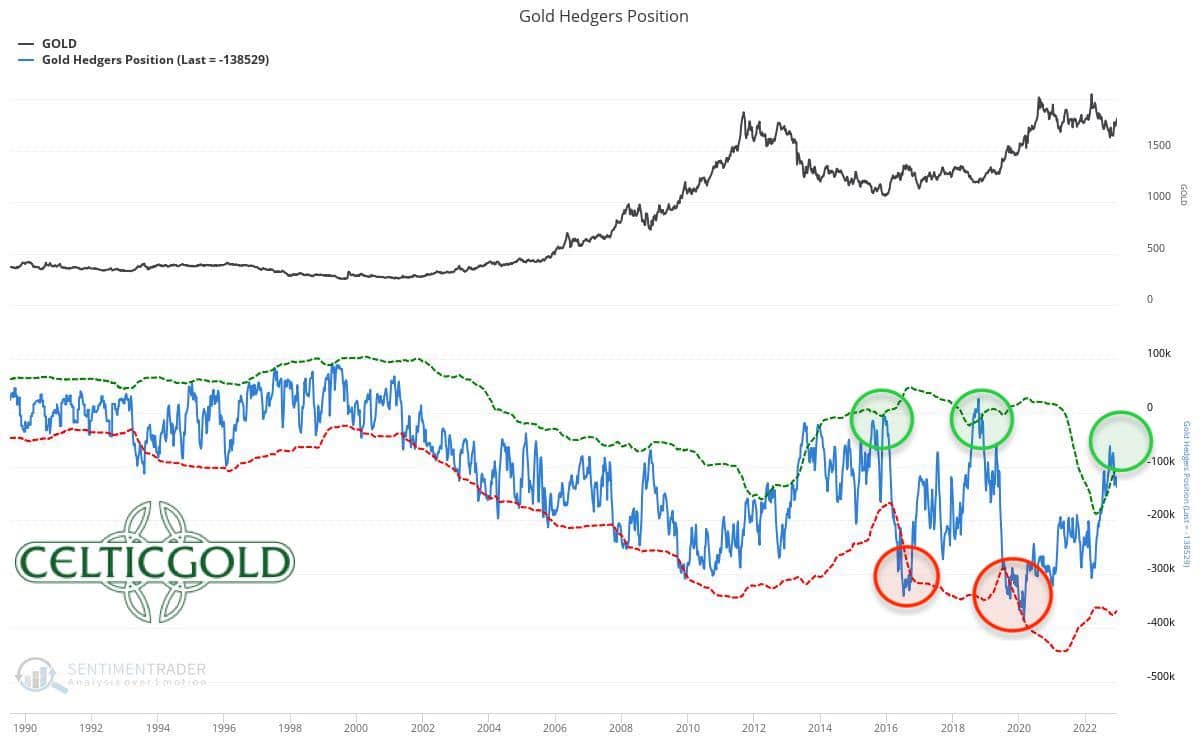
Commitments of Traders (COT) for Gold as of December 20th, 2022. Source: Sentimentrader
According to the recent CoT report, the net short position of commercial market participants on December 13th was 138,529 cumulated short contracts. Thus, the situation in the futures market has deteriorated slightly. Only below 100,000 short contracts, one can speak of a sustainable bullish CoT report.
In summary, the CoT report is neutral.
Sentiment for Gold – Neutral
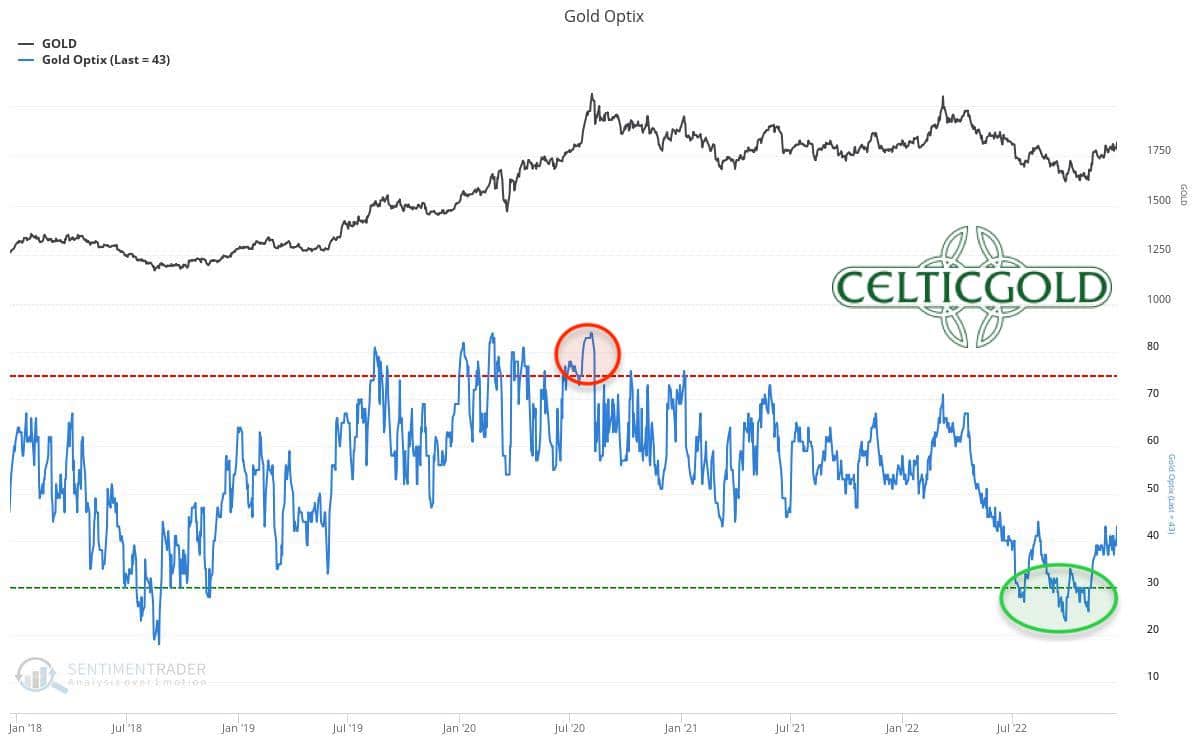
Sentiment Optix for Gold as of December 20th, 2022. Source: Sentimentrader
Due to the strong recovery over the last two months, the mood in the gold market has improved significantly. In a long-term comparison though, sentiment is still at rather pessimistic levels. Yet, a contrarian opportunity is currently no longer present. Nevertheless, it is important to recall that gold was able to rise by more than 900 USD, or about 80%, within two years from a similarly bombed-out sentiment back in August 2018.
Overall, sentiment is neutral.
Seasonality for Gold – Bullish until the end of February
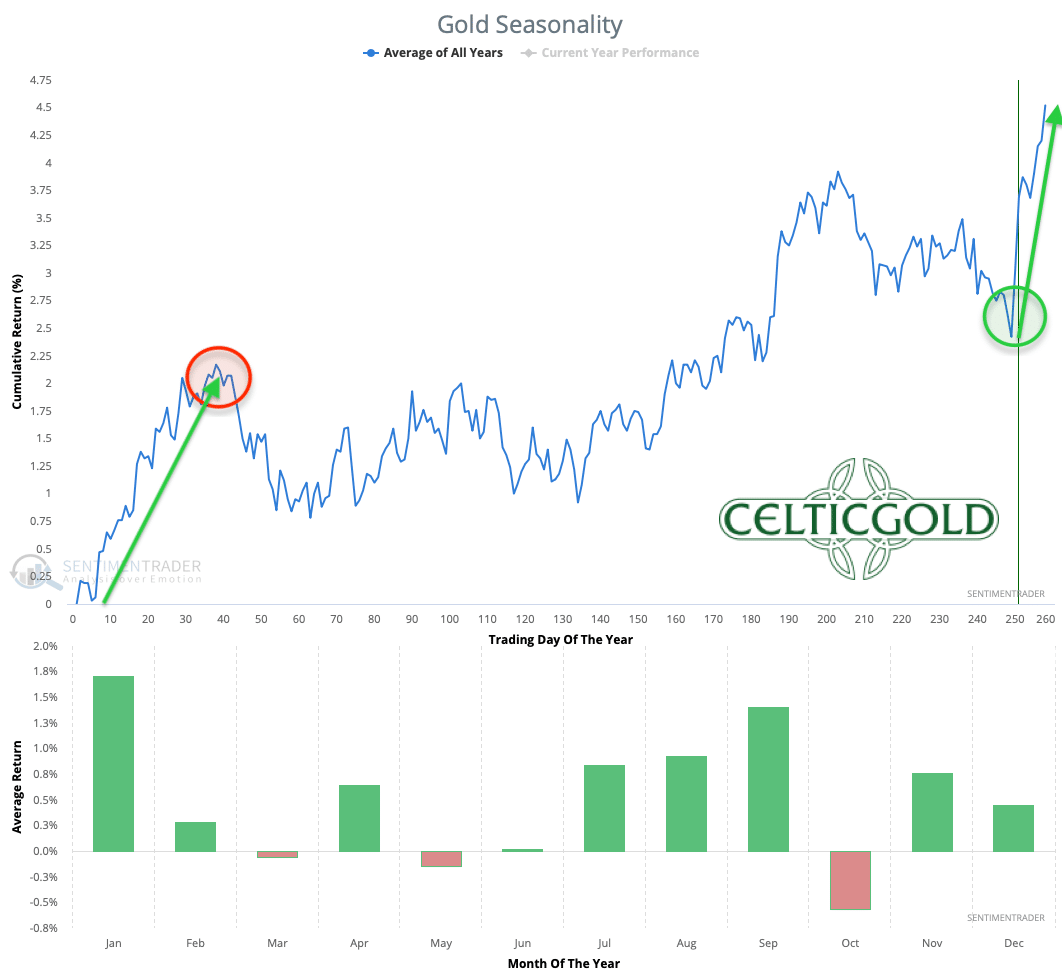
Seasonality for Gold over the last 54-years as of December 20th, 2022. Source: Sentimentrader
From the seasonal perspective, an extremely promising phase for the gold price began in mid-December. In the past, this period usually delivered significant increases into late February.
Seasonality for the gold and silver is therefore clearly bullish until the end of February.
Macro update – An extremely difficult year draws to a close
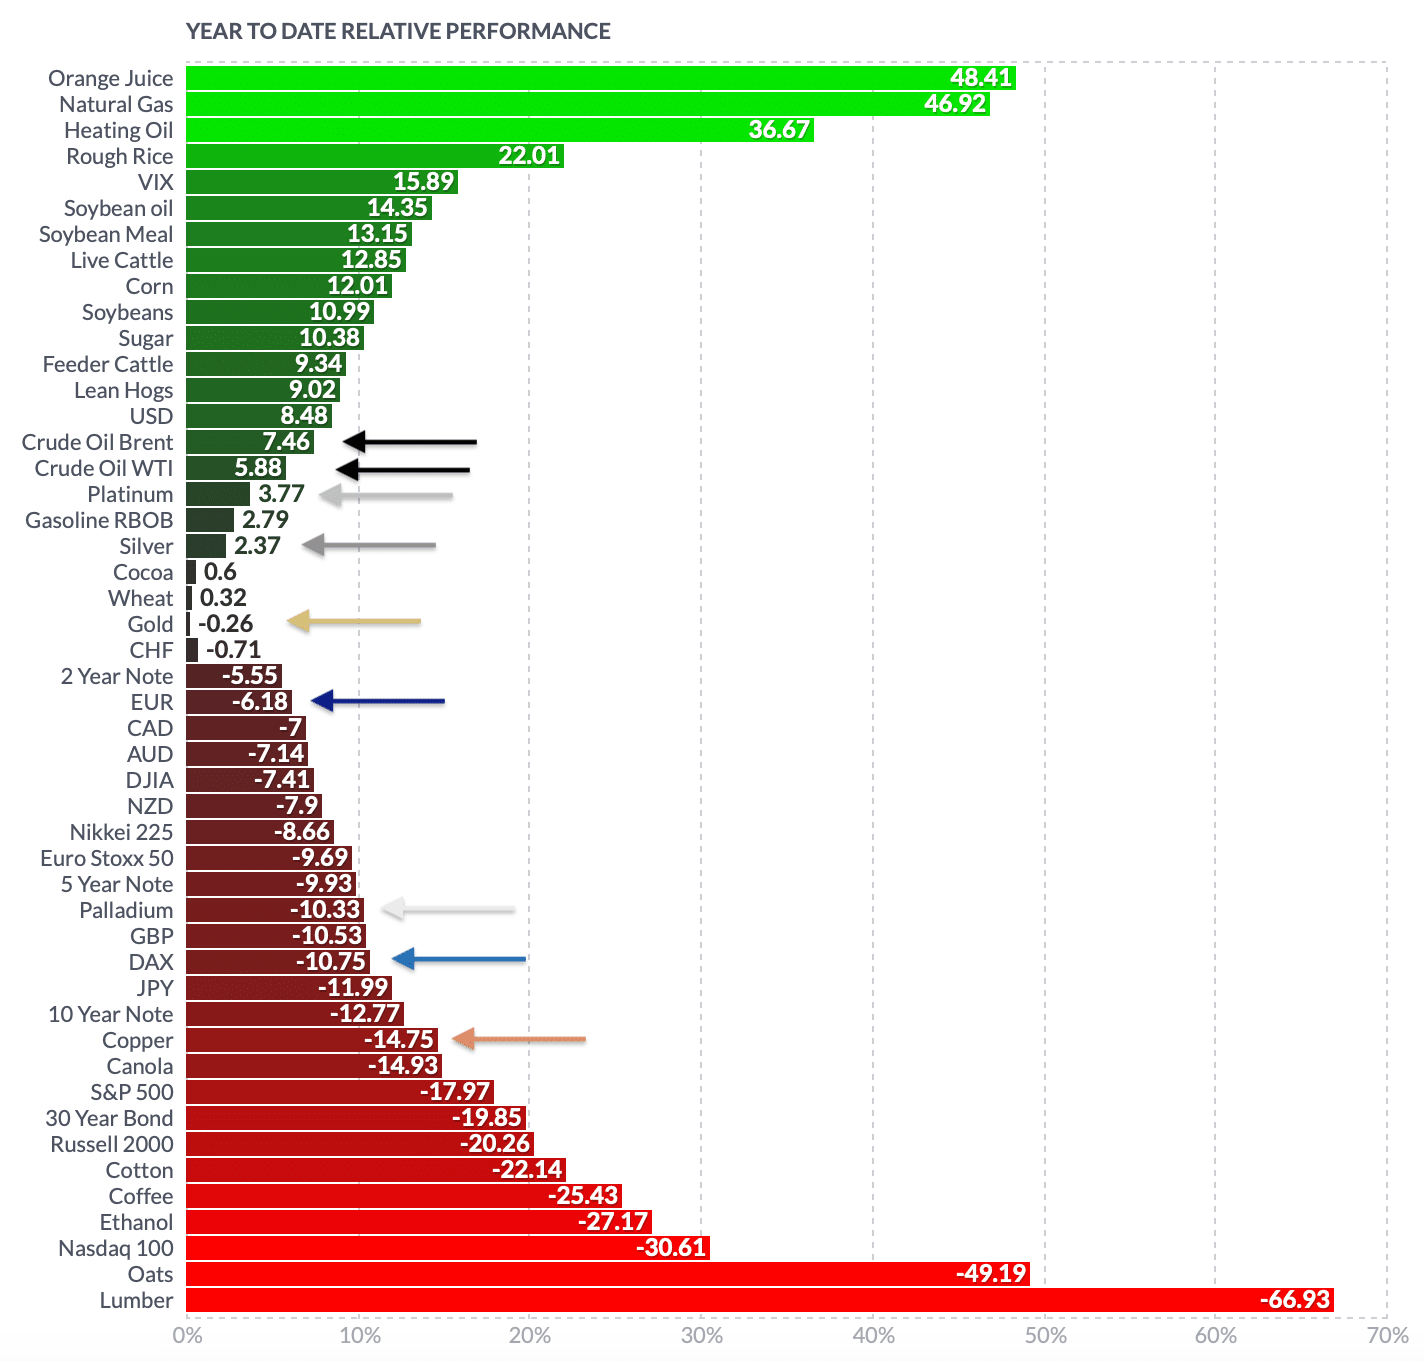
Year-to-date relative performance as of December 22nd, 2022. Source: finviz
An extremely difficult and challenging year 2022 is drawing to an ending. The Russia-Ukraine war, high energy prices and extreme inflation rates, the aftermath of the Corona crisis and the turmoil in China caused a lot of stress in financial markets. The end of the forty-year low interest rate environment was felt above all in the bond markets, which saw a brutal sell-off. Interest rates for 10-year US government bonds shot up from 1.5% to 4.33% and are currently 3.82%, more than doubling since the beginning of the year.
Stock market returns were also disastrous in some cases. Meta (Facebook) lost -64% since January 1st, Amazon -48% and Apple -24%. Bitcoin is trading -58% lower. The real economy, on the other hand, is slowly but surely feeling the effects of these poor developments with a significant delay. There is still a lot to catch up with in the coming year (e.g. “mass layoffs”). The recession is already here, but the mainstream’s embellished figures are still masking the truth. There is currently no sign of a sustained change in the restrictive monetary policy! Neither in the USA nor in the eurozone. Rather, interest rates are now also rising in Japan, which means that the overall liquidity available in the global financial system will continue to decline.
Precious metals held up rather well
Nevertheless, precious metal prices have been able to hold up quite well within this difficult environment. Although the course of the year brought a high at 2,070 USD and a low at 1,615 USD, ultimately gold prices are currently trading close to the start of the year (1,828 USD). Silver and platinum are even ahead, with a small plus. On the other hand, copper, which is sensitive to the economy, recorded a loss of 14.75% for the year.
Overall, the low valuations in many sectors are certainly an opportunity in the medium to long term. Nevertheless, we continue to see major risks for the time being in the coming months. An immediate return to the booming years is utopian. Instead, hot air continues to escape from the biggest bubble of all time. How long the U.S. Federal Reserve will be able to continue its aggressive monetary policy is anyone’s guess. We still suspect that there will be a sharp reversal in U.S. monetary policy in the course of next year (2023), as they will then be forced to limit the damage to the collapsing economy. However, the strong recovery since mid-October has probably pushed back the pivot in monetary policy slightly. Thus, our “risk-off” stance remains in principle.
Conclusion: Gold – Fight around the 200-day moving average not yet decided
To sum up, the recent recovery in all markets has brought the year to a halfway conciliatory close. Yet, the underlying problems have not been solved. Given the usually thin trading volume during the holidays, not much is likely to happen between now and the first few days of the new year 2023. However, the trendsetting first two weeks of the new year should be exciting and important again.
We suspect that the air is getting thinner in the gold market and that a pullback is pending in the short-term. Only a solid daily closing price above 1,830 USD would likely unlock further upside potential towards 1,850 USD and maybe 1,900 USD. Given the positive seasonality and the rather doubting sentiment (“wall of worry”), gold could certainly continue its grind higher into January and February. However, it seems important that a medium-term directional decision will only be possible via lower prices and a revisit of the area around 1,750 USD.
Regardless of the short- to medium-term outlook, though, we are optimistic not only for the second half of the coming year but for the next two to three years. Once the typical 8-year low in the gold market is clearly established, a strong uptrend with new all-time highs should follow.
Analysis initially published on December 22nd, 2022, by www.celticgold.de. Translated into English and partially updated on December 28th, 2022.
Feel free to join us in our free Telegram channel for daily real time data and a great community. If you like to get regular updates on our gold model, precious metals and cryptocurrencies you can also subscribe to our free newsletter.
Disclosure:
This article and the content are for informational purposes only and do not contain investment advice or recommendations. Every investment and trading move involves risk, and readers should conduct their own research when making a decision. The views, thoughts and opinions expressed here are the author’s alone. They do not necessarily reflect or represent the views and opinions of Midas Touch Consulting.

