Bitcoin – Significant recovery expected
After a brutal 14-months bear market, Bitcoin prices reached an important low at 15,479 USD on November 21st, 2022. Since then, prices traded sideways for around six weeks. Over the last two weeks, however, Bitcoin exploded higher, reaching nearly 21,600 USD as of yesterday. It seems that a regime change has happened. Bitcoin – Significant recovery expected.
Review
As not only precious metal prices (gold +19.3%, silver +39.7%), but also stock markets (DAX +28.7%, S&P500 +18.7%) recorded a significant recovery over the last three months, it was only a matter of time until Bitcoin would send a sign of life again, too.
Already since mid-November, Bitcoin had barely reacted to the flood of bad news coming from the imploding crypto sector. Yet, many altcoins fell to new lows. At the same time, sentiment was beaten down completely and Bitcoin was hated and derided. Clearly, this was the best contrarian set up we have seen in a long time.
Hence, it’s no surprise that bitcoin skyrocketed 31% higher since the start of the new year. The stellar rally took prices from 16,358 USD to 21,445 USD in lightning speed. Anyone who was not invested is now chasing the rally. And those who have even shorted Bitcoin are now desperately hoping for a significant pullback. Yet, despite the significant rise, the mood among market participants remains skeptical.
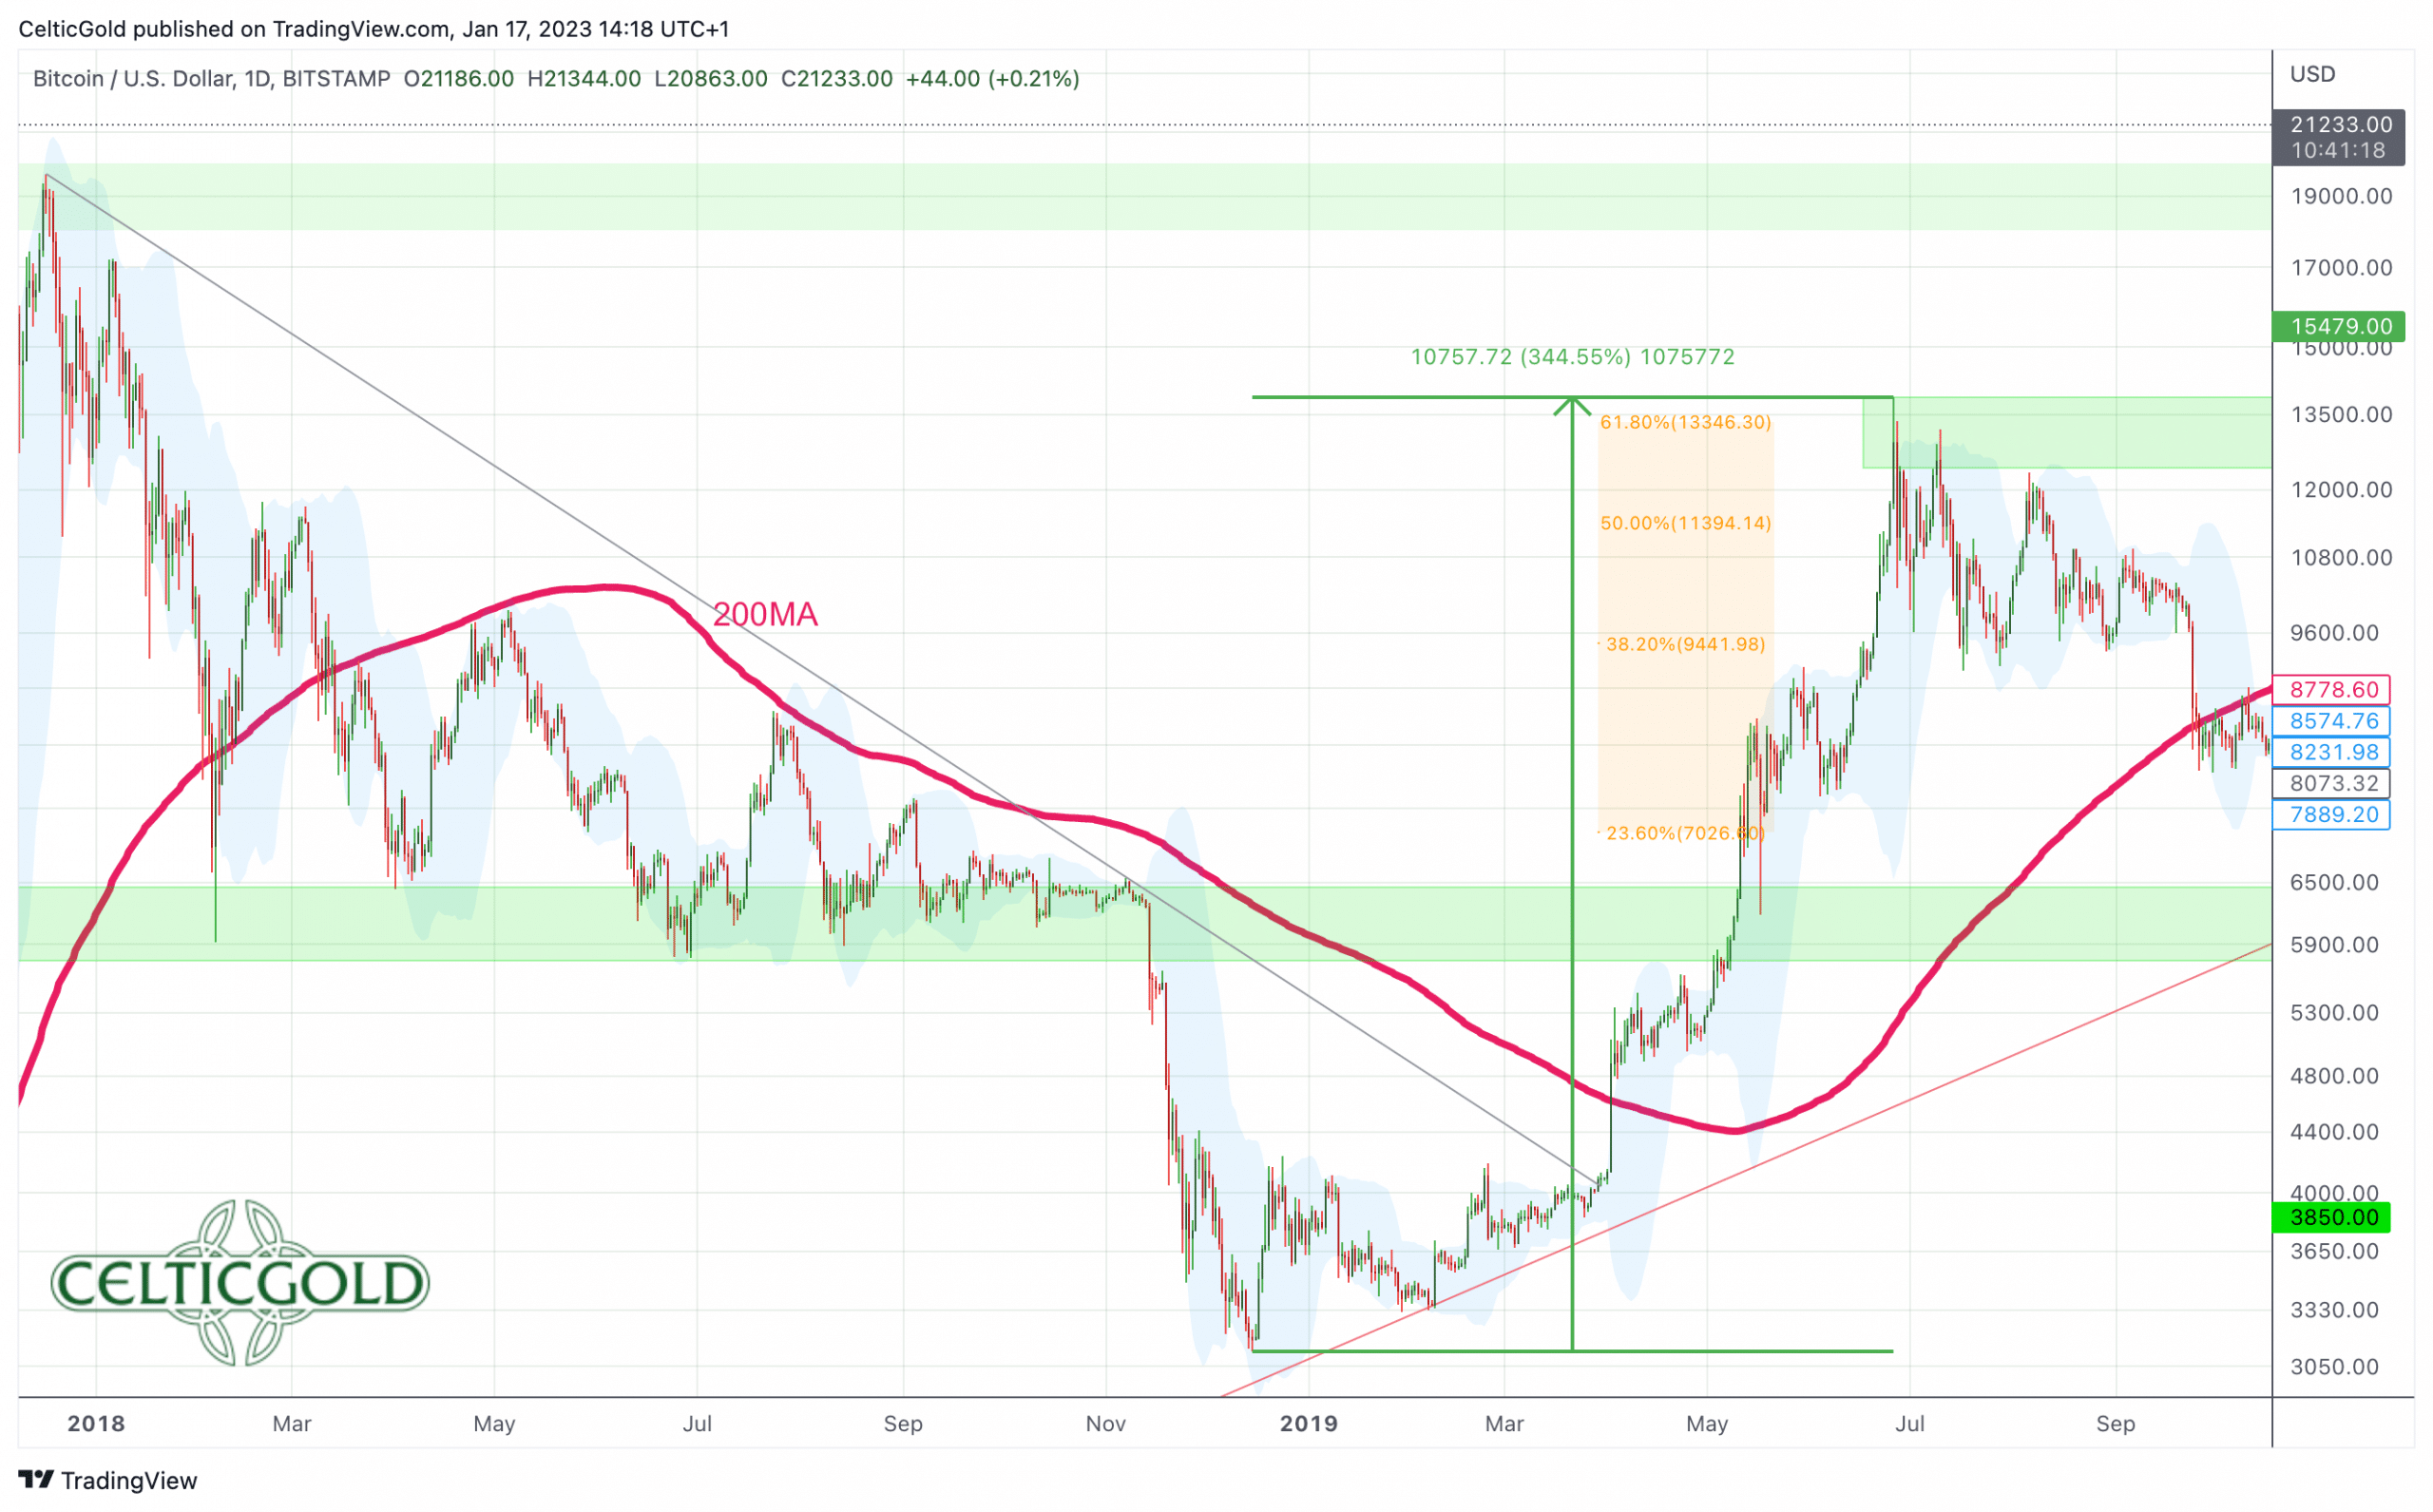
First bounce in 2019 brought an increase of almost 330%
Bitcoin in 2019 in USD, weekly chart as of January 17th, 2023. Source: Tradingview
A comparative look into the past shows that Bitcoin, pretty much like in 2019, was suddenly given a new lease of life after a brutal bear market that ended with a basing pattern lasting several months. Back in 2019, Bitcoin managed to rise 328% from 3,200 USD to around 13,800 USD. The four-and-a-half-month rally did not offer any major pullbacks for an entry! Rather, more than 61.8% of the previous bear market were recaptured without any major pullbacks. Should Bitcoin currently have something similar in mind, prices could recover towards approx. 48,000 USD to 50,000 USD until the summer! Even if Bitcoin would take it a bit easier in 2023, a recovery up towards the 38.2% retracement at around 35,000 USD would be easily conceivable.
Technical Analysis for Bitcoin in US-Dollar
Bitcoin Weekly Chart – Upper edge of the downtrend channel is the 1st target
Bitcoin in USD, weekly chart as of January 17th, 2023. Source: Tradingview
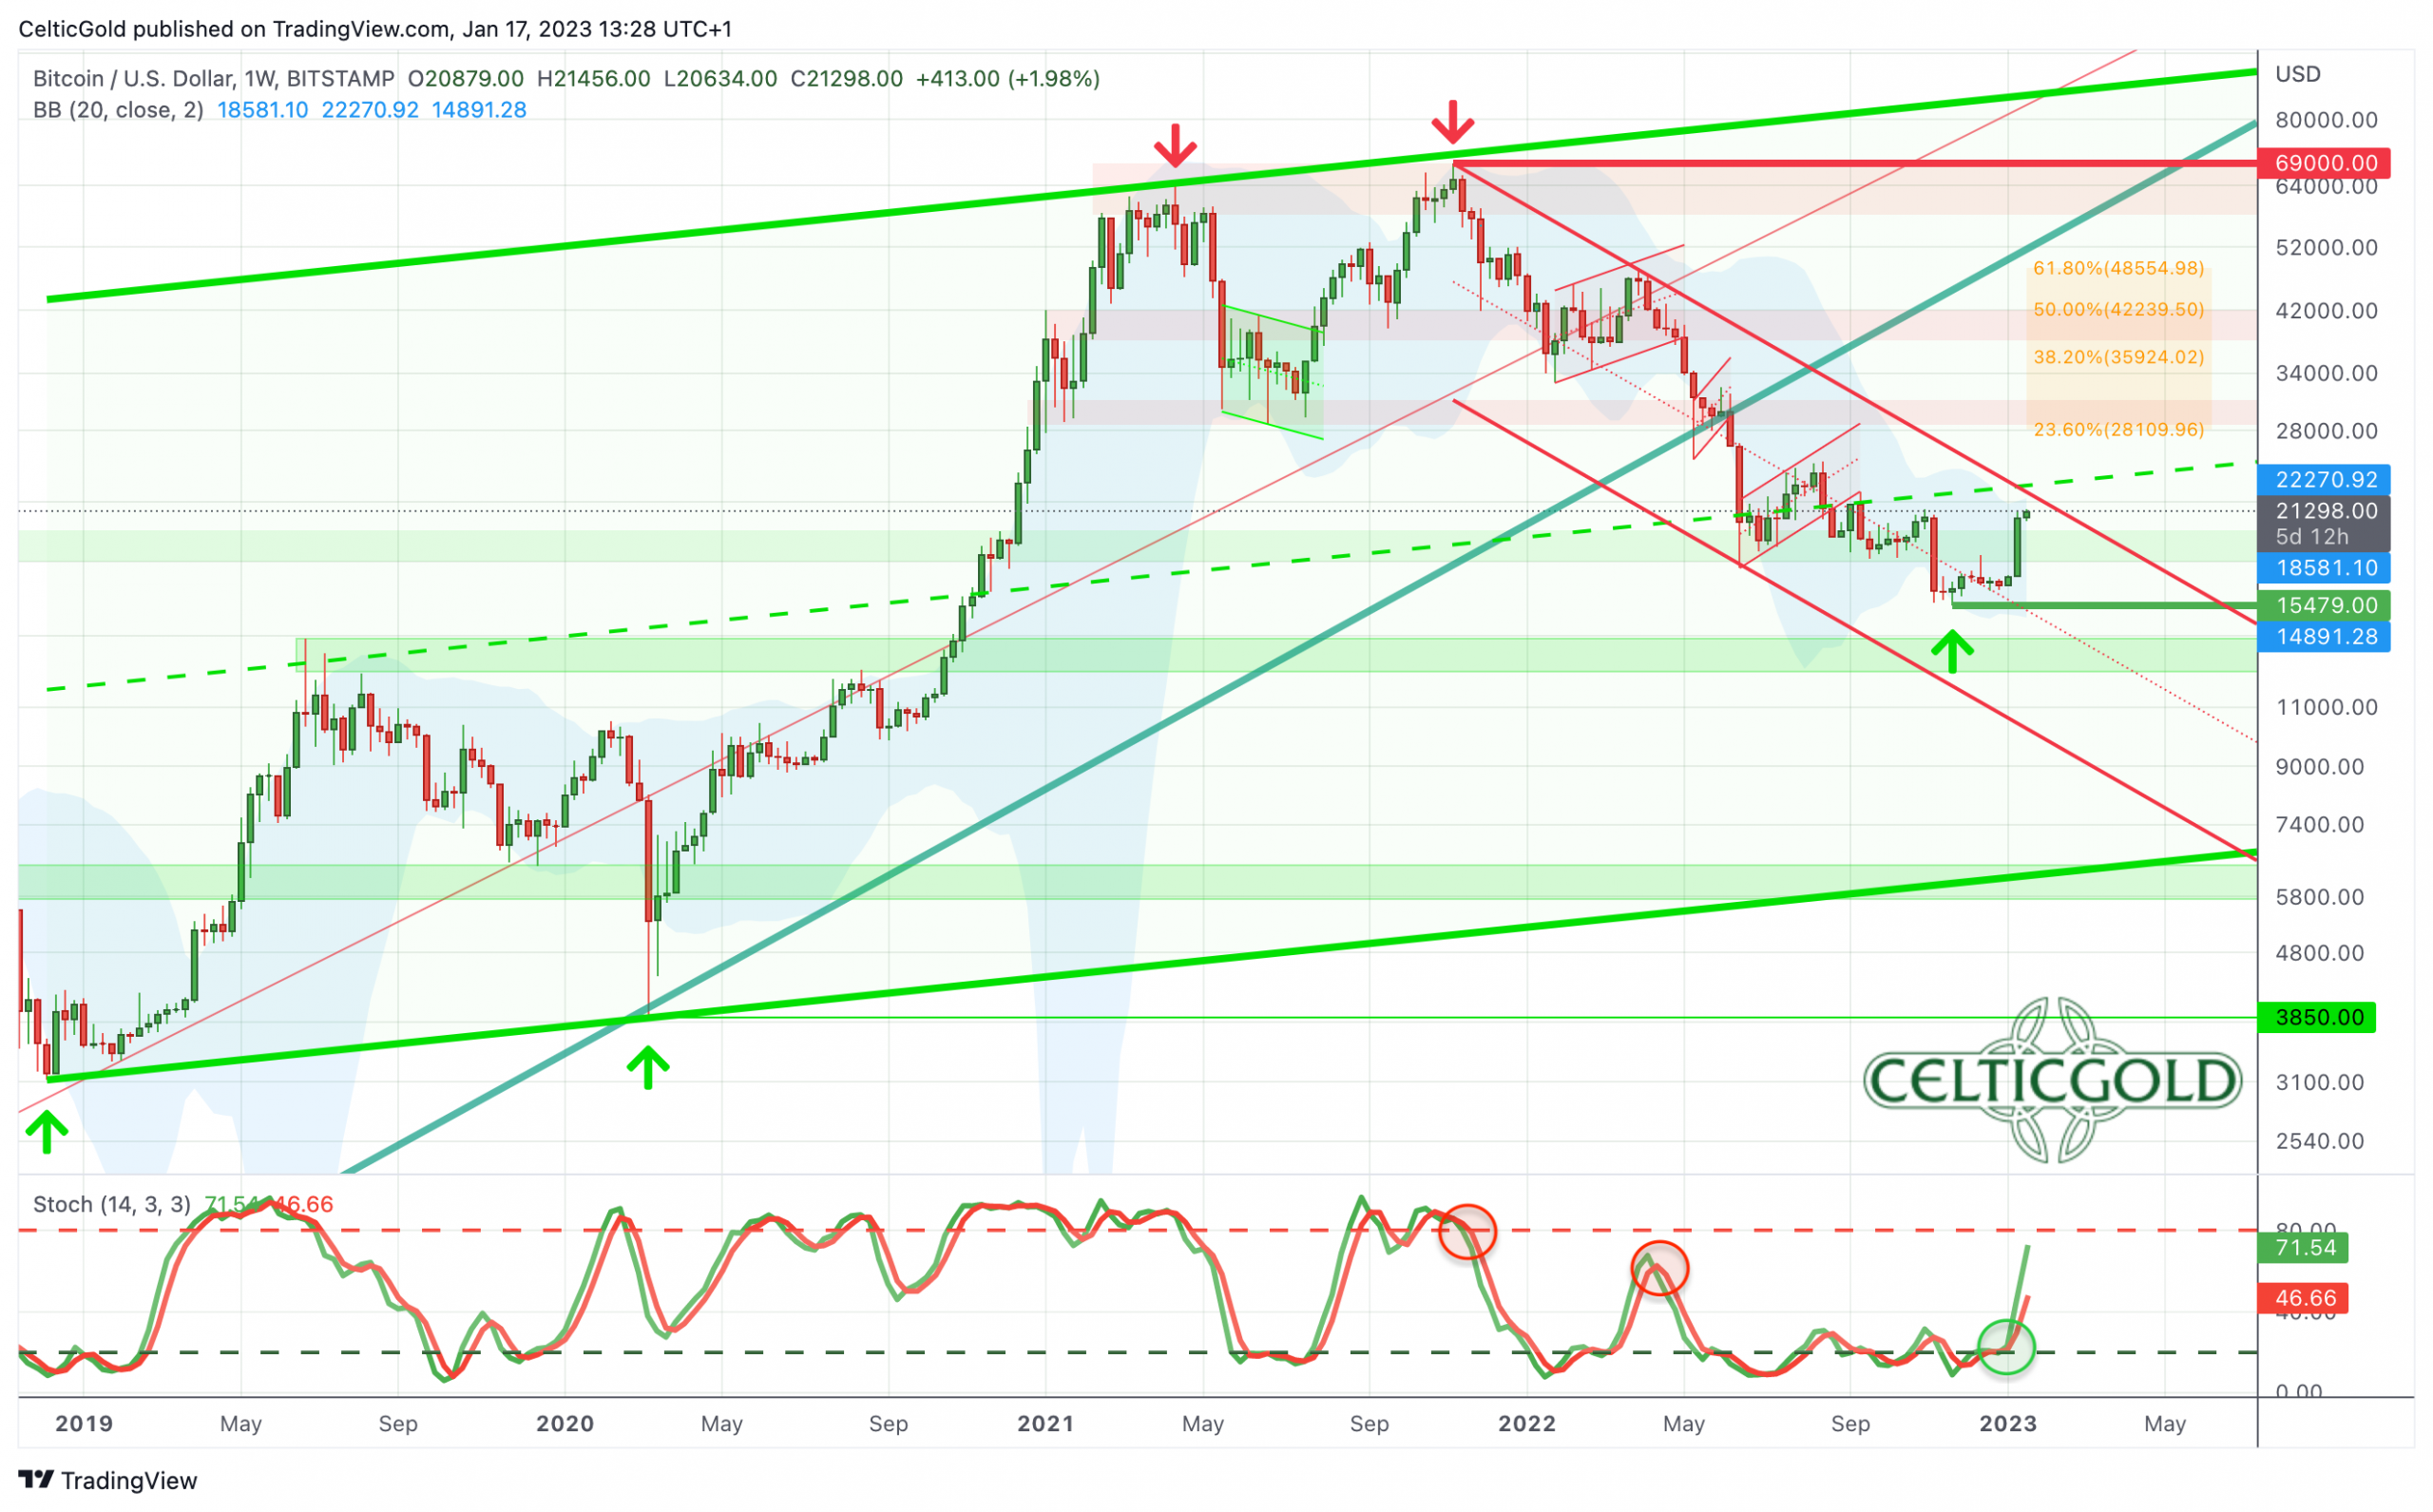
Historically, a weekly close with a 20% gain after a prolonged bear market with a loss of 75% or more has always resulted in Bitcoin bottoming out!
On the weekly chart, thanks to the large green weekly candle, Bitcoin has now almost reached the upper edge of the downtrend channel. Basically, a pullback could therefore take place starting between approx. 22,000 USD and 23,500 USD. However, the weekly stochastic provides a buy signal and still has room to run further towards and into the overbought zone. The upper Bollinger band (22,268 USD) does not stand in the way, neither. On a higher level, Bitcoin probably wants to approach at least one of the orange retracement levels.
Overall, the weekly chart is clearly bullish and suggests further price increases. If the downtrend channel stops the bulls around 22,500 USD, the support zone between 18,000 and 20,000 USD should absorb the first pullback.
Bitcoin Daily Chart – 200 day moving average now support
Bitcoin in USD, daily chart as of January 17th, 2023. Source: Tradingview
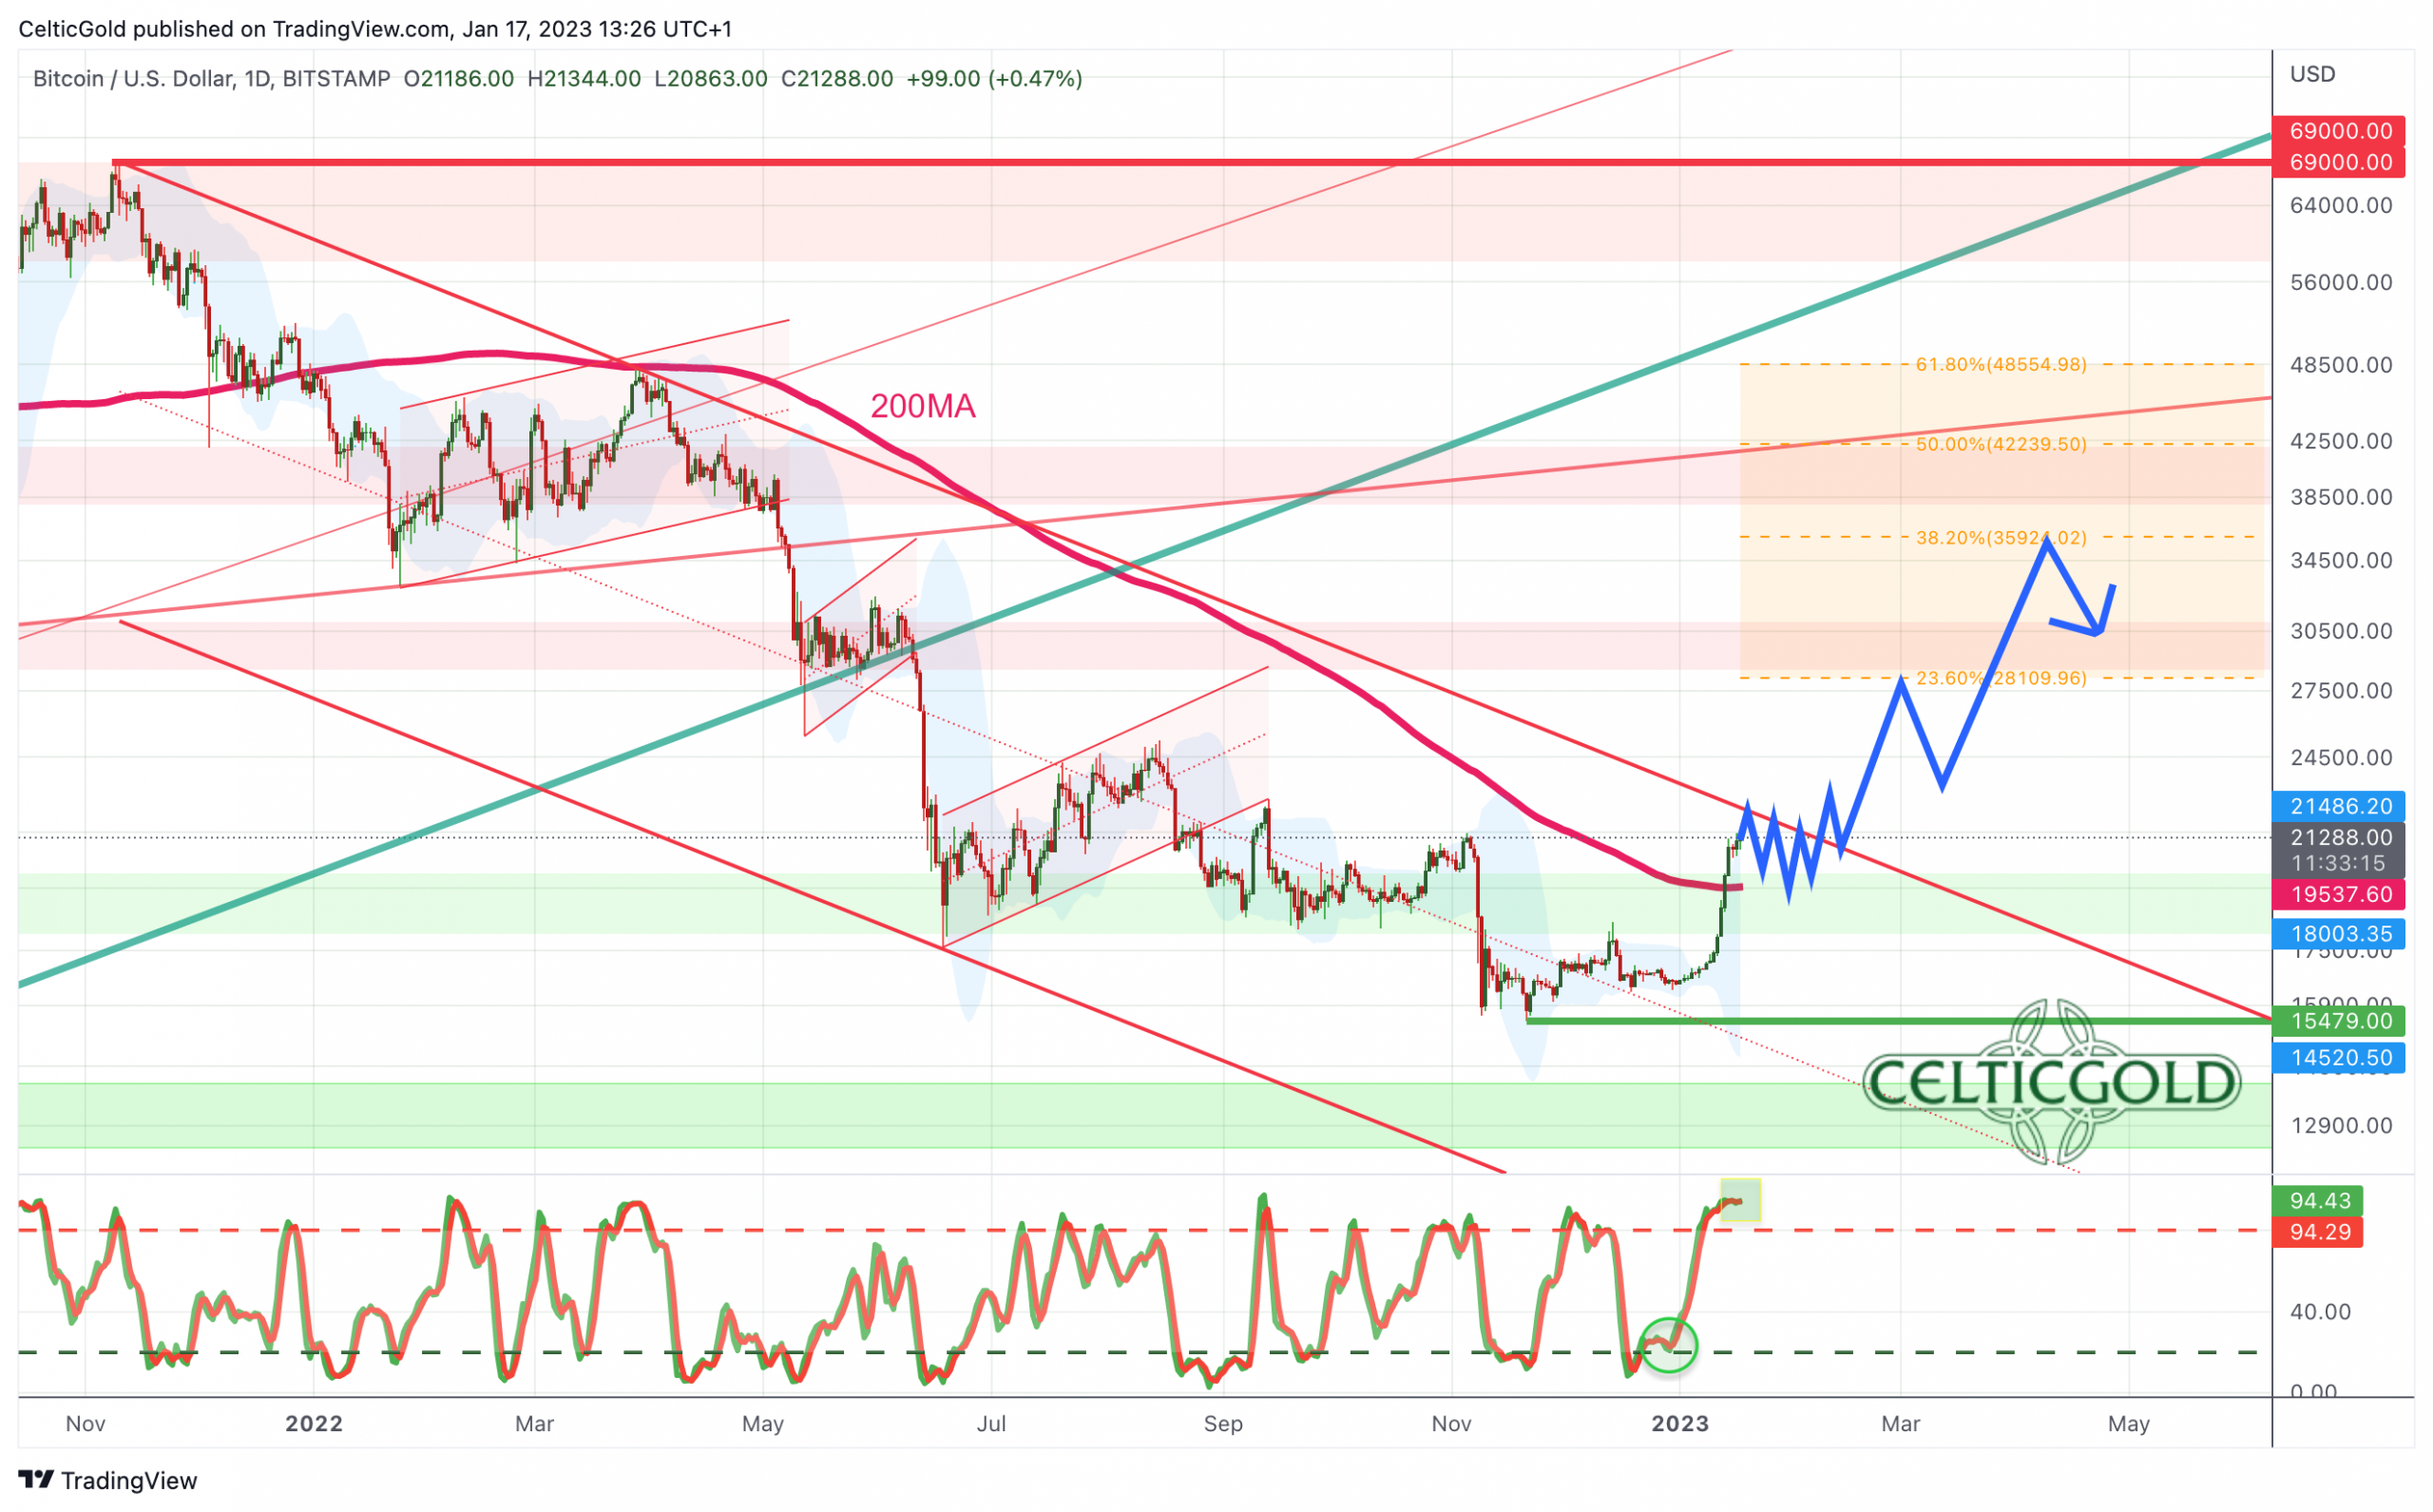
On the daily chart, Bitcoin easily managed to jump above the 200-day moving average (19,537 USD) on January 13th. Now, this much observed average acts as support. The last time Bitcoin traded above its 200-day moving average was back in December 2021. Thus, it is clear that a new chapter has been opened in the Bitcoin market.
The next target is obviously the upper edge of the downtrend channel (currently around 22,350 USD). Should a pullback or consolidation occur, plenty of strong support awaits in the area between 18,000 USD and 20,000 USD.
In summary, the daily chart is bullish. The stochastic oscillator, which is currently embedded with both lines above 80, secures the steep uptrend for the time being. Major pullbacks are therefore not expected any time soon.
Rather, the vast majority of market participants may have been completely surprised by the impulsive rally. Given the brutal 14-month bear market and the fact that Bitcoin can now be traded using numerous instruments or derivatives, the number of short sellers at the low in November was probably higher than ever before. These short sellers are now gradually getting further and further underwater and will become the buyers who could quickly push Bitcoin prices towards 35,000 USD and possibly even towards 50,000 USD by early summer as continuously rising prices forcing them to cover their short positions.
Sentiment Bitcoin – Sentiment returns to neutral

Crypto Fear & Greed Index, as of January 15th, 2023. Source: Lookintobitcoin
For the first time since the start of the bear market in November 2021, sentiment has recovered significantly. At 52 points, the “Crypto Fear & Greed Index” currently signals a rather balanced or neutral sentiment.
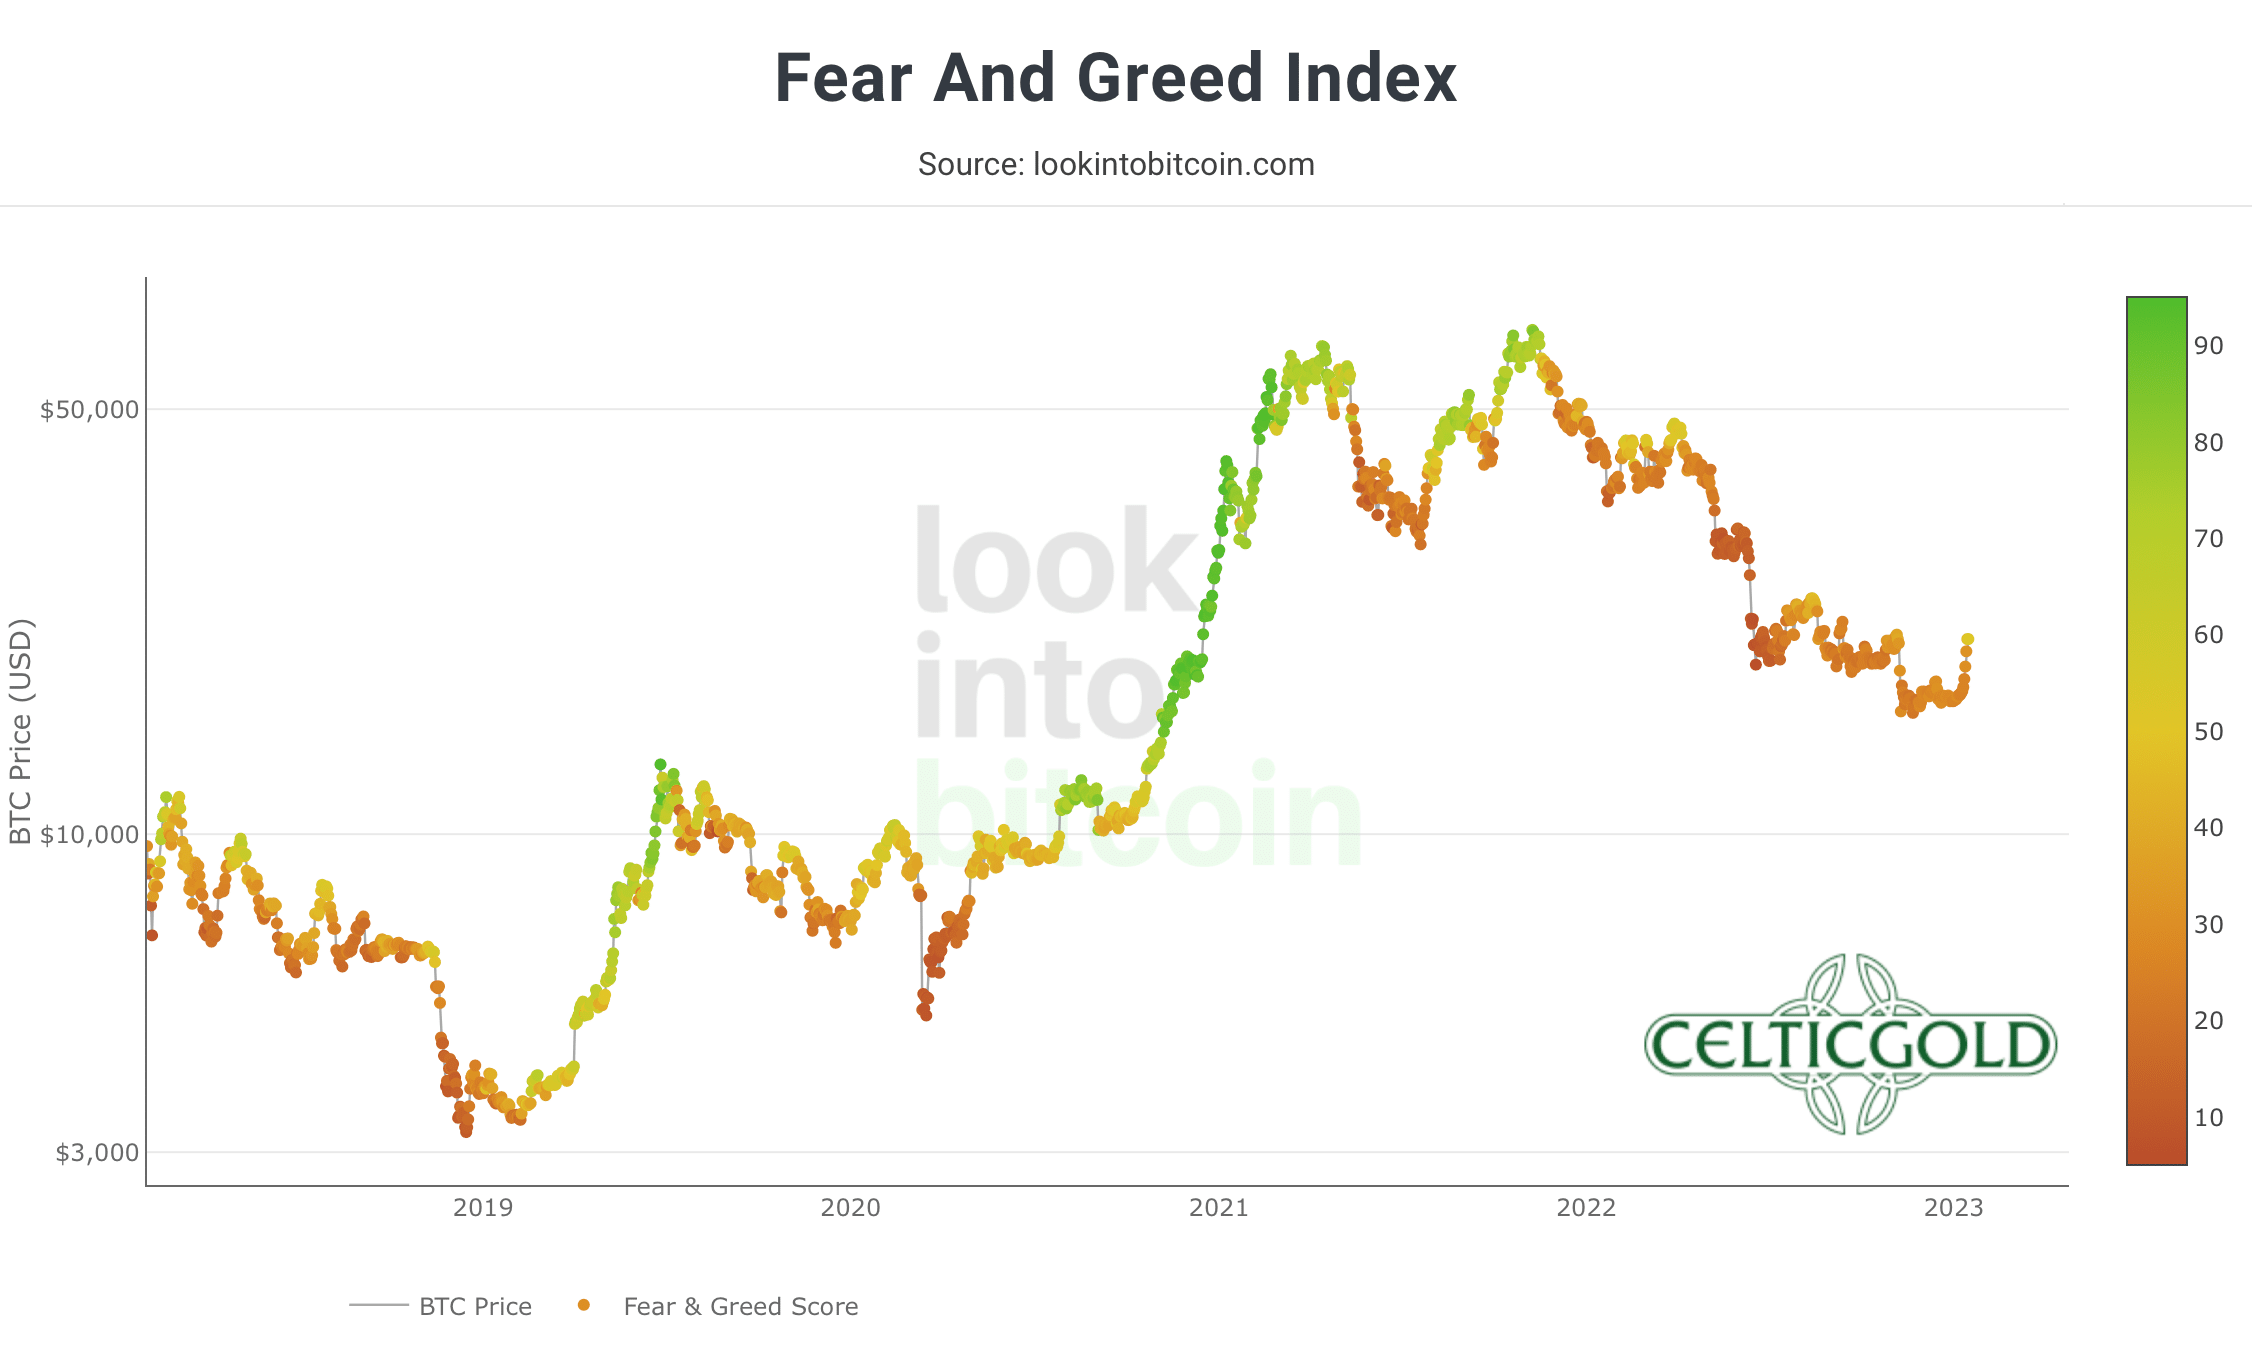
Crypto Fear & Greed Index long term, as of January 15th, 2023. Source: Lookintobitcoin
The contrarian buying opportunity which we have propagated in December is thus gone. However, significant price increases are likely to be needed until sentiment turns euphoric.
Seasonality Bitcoin – Positive until June
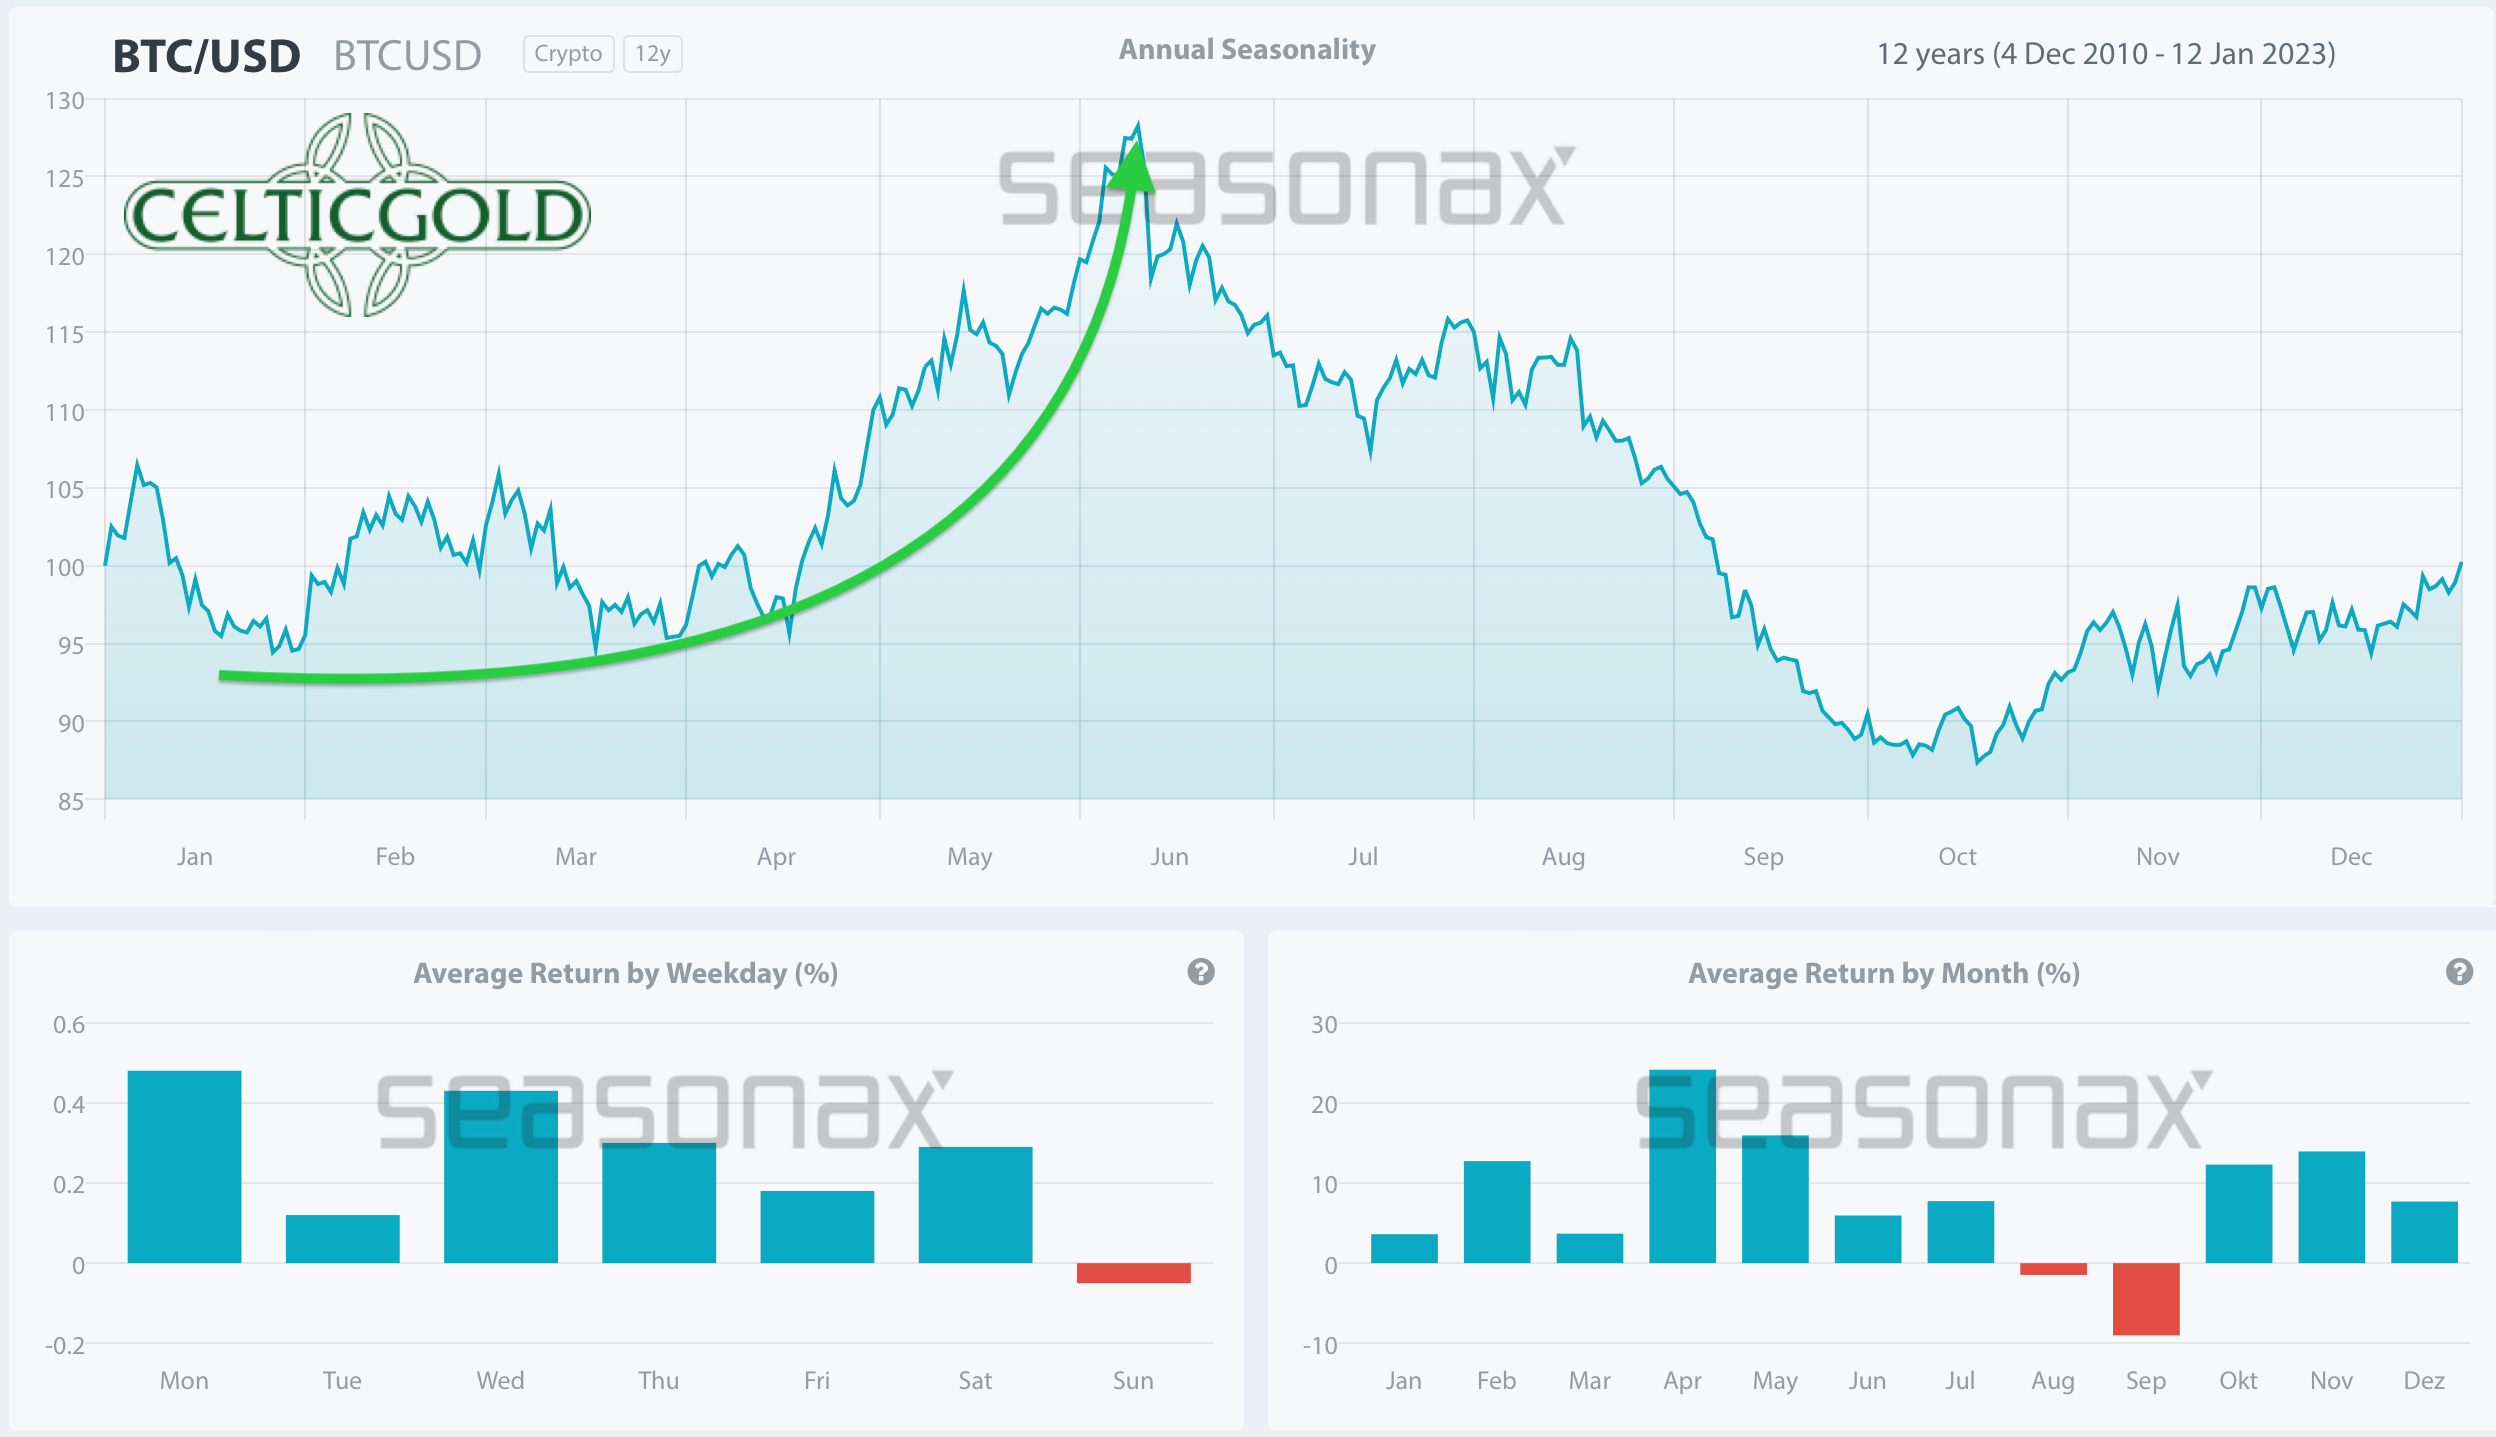
Seasonality for bitcoin, as of January 15th, 2023. Source: Seasonax
According to the seasonal pattern, Bitcoin is now very likely facing three to five positive months. Hence, the trend should be up until early summer.
Sound Money: Bitcoin vs. Gold
At current prices of around 21,200 USD for one Bitcoin and around 1,910 USD for one troy ounce of gold, you must pay around 11.08 ounces of gold for one Bitcoin. Put another way, a troy ounce of gold currently costs about 0.09 Bitcoin.
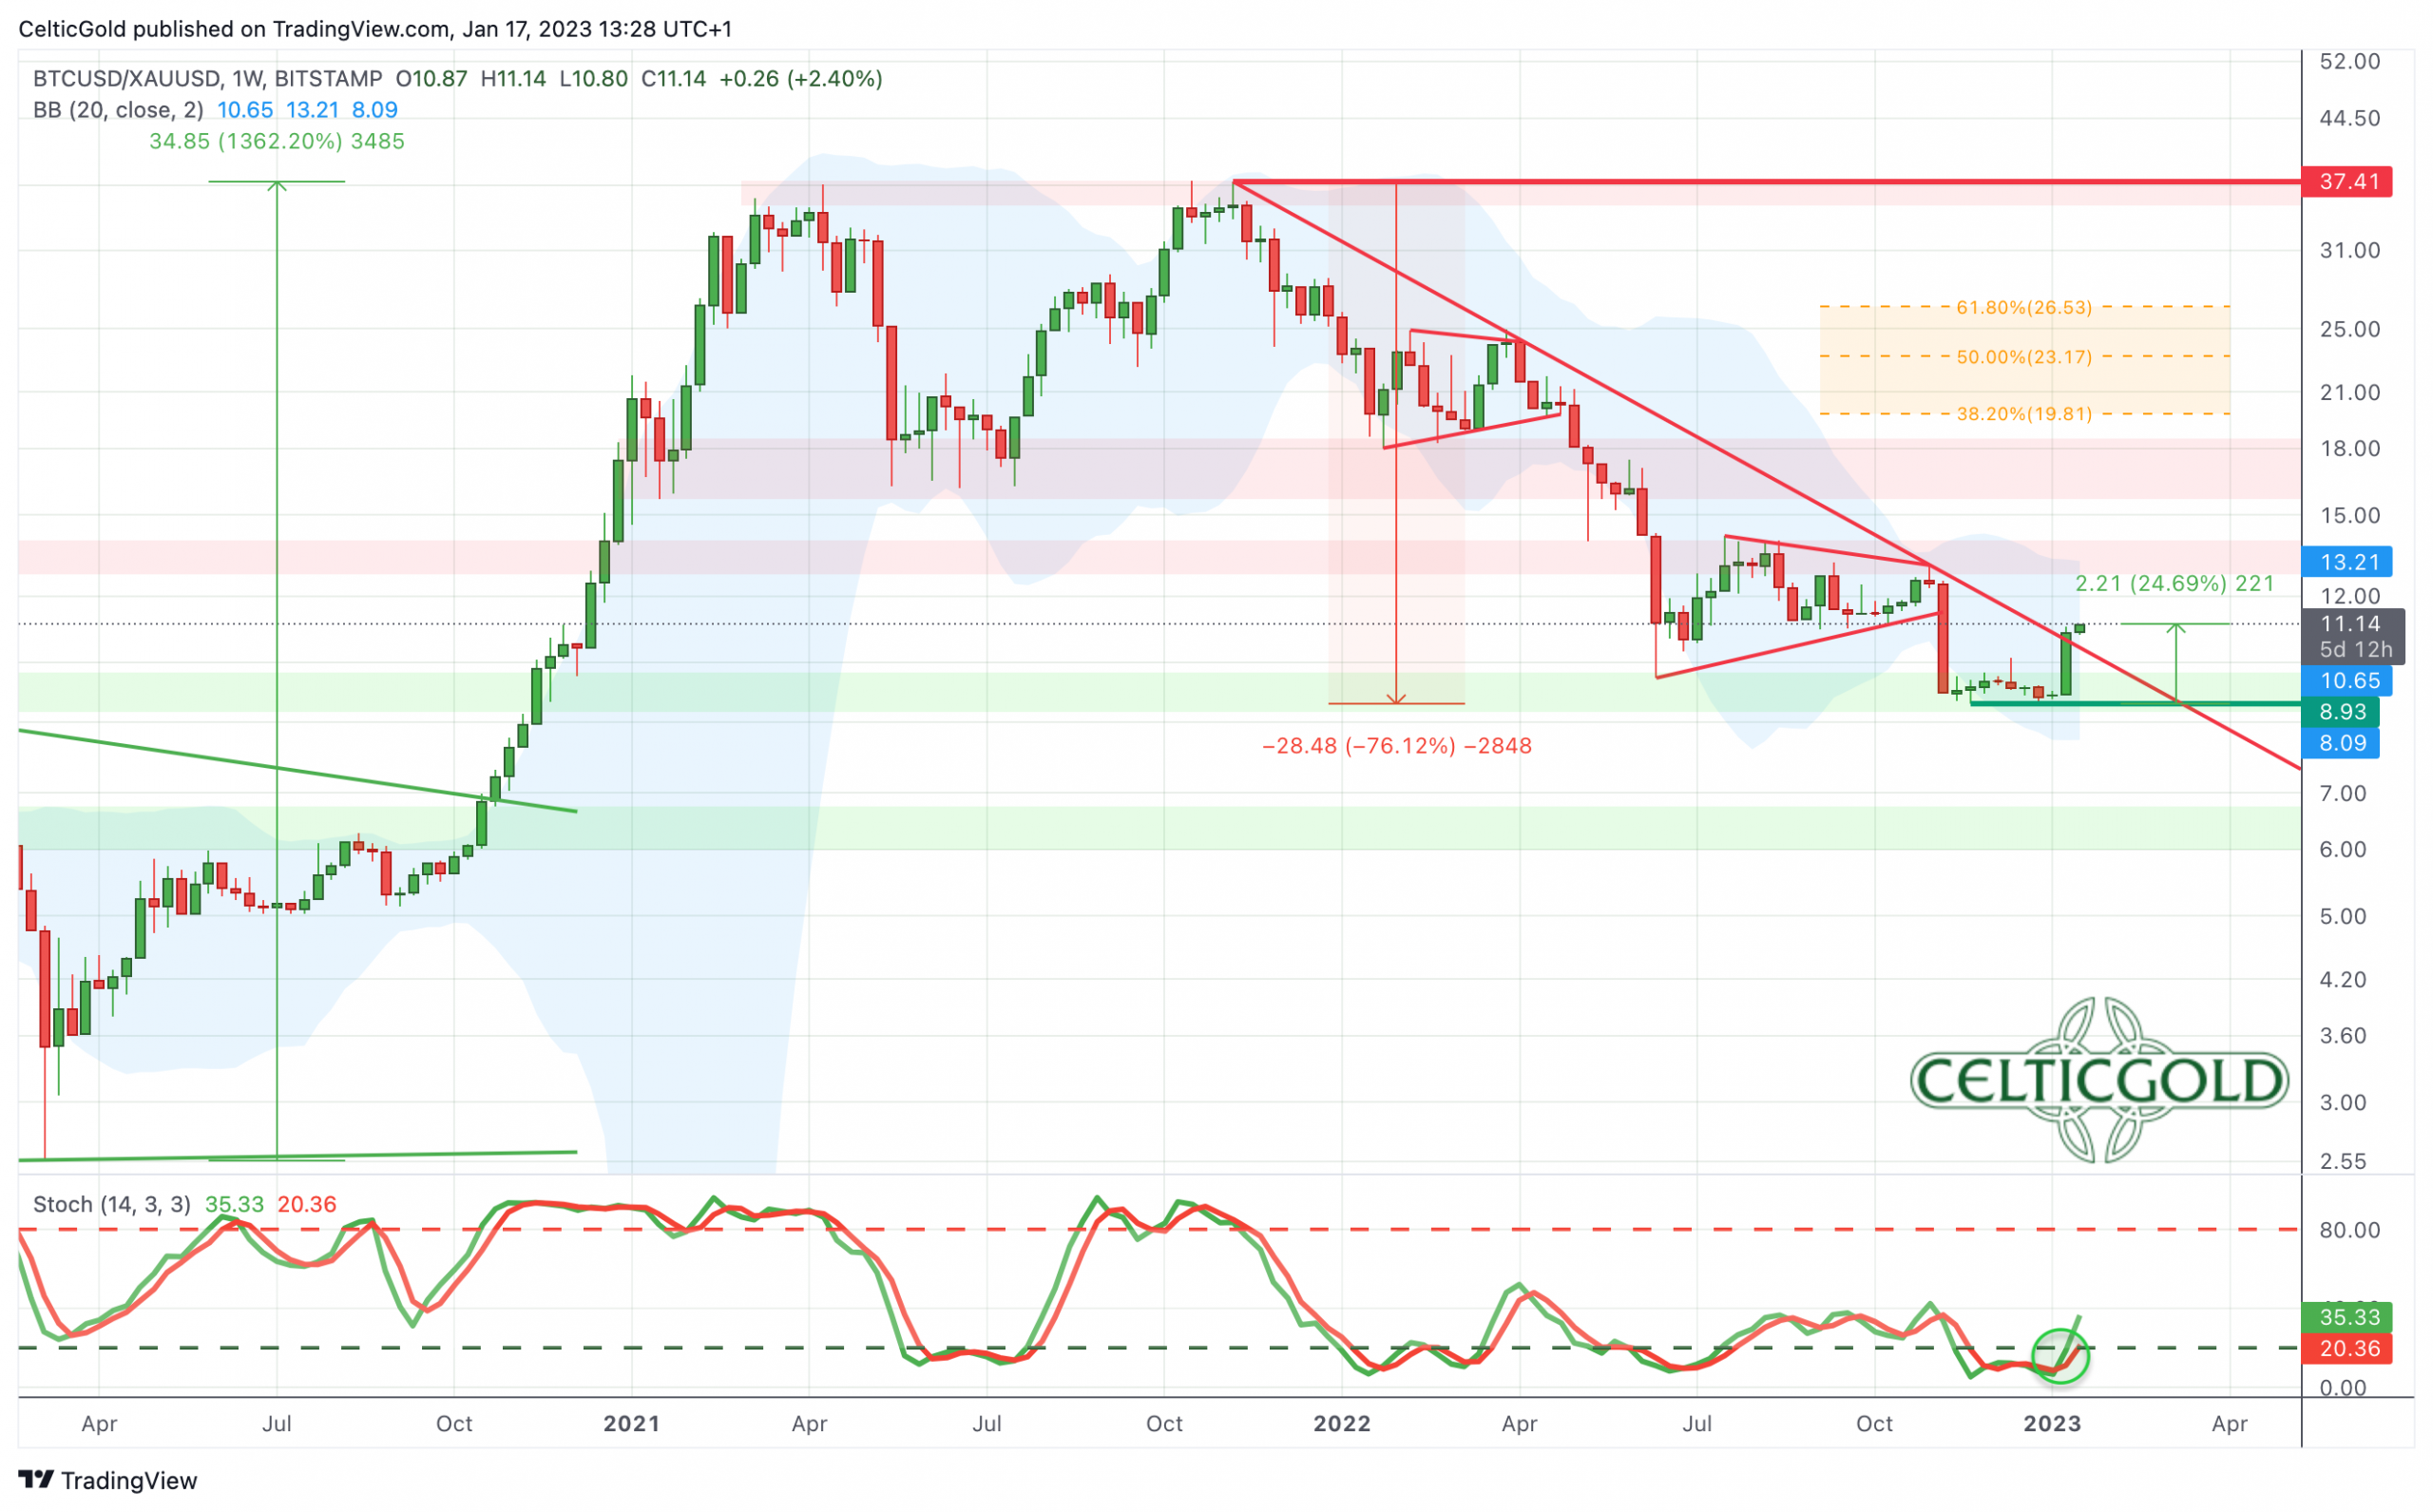
Bitcoin has thus risen in price by almost 25% against gold in no time at all. The Bitcoin/Gold-Ratio has therefore clearly turned upwards over the last two weeks. It has already broken out above the downtrend line of the last 14 months! The weekly stochastic provides a new buy signal in favor of Bitcoin. A normal recovery or counter-trend bounce could lead the ratio to a value of almost 20 in the coming months. With that, you would get nearly twice as much gold as currently for your Bitcoins! The first price target in the coming weeks would be the upper Bollinger Band on the weekly chart (13.20).
In summary, the Bitcoin/Gold-Ratio has bottomed and turned around. A larger recovery or counter-trend bounce is to be expected. Ratio values between 13 and 14 would be the minimum target. Hence, it is recommended to increase one’s Bitcoin allocation against gold.
Macro Update – Stagflation and Cold War 2.0
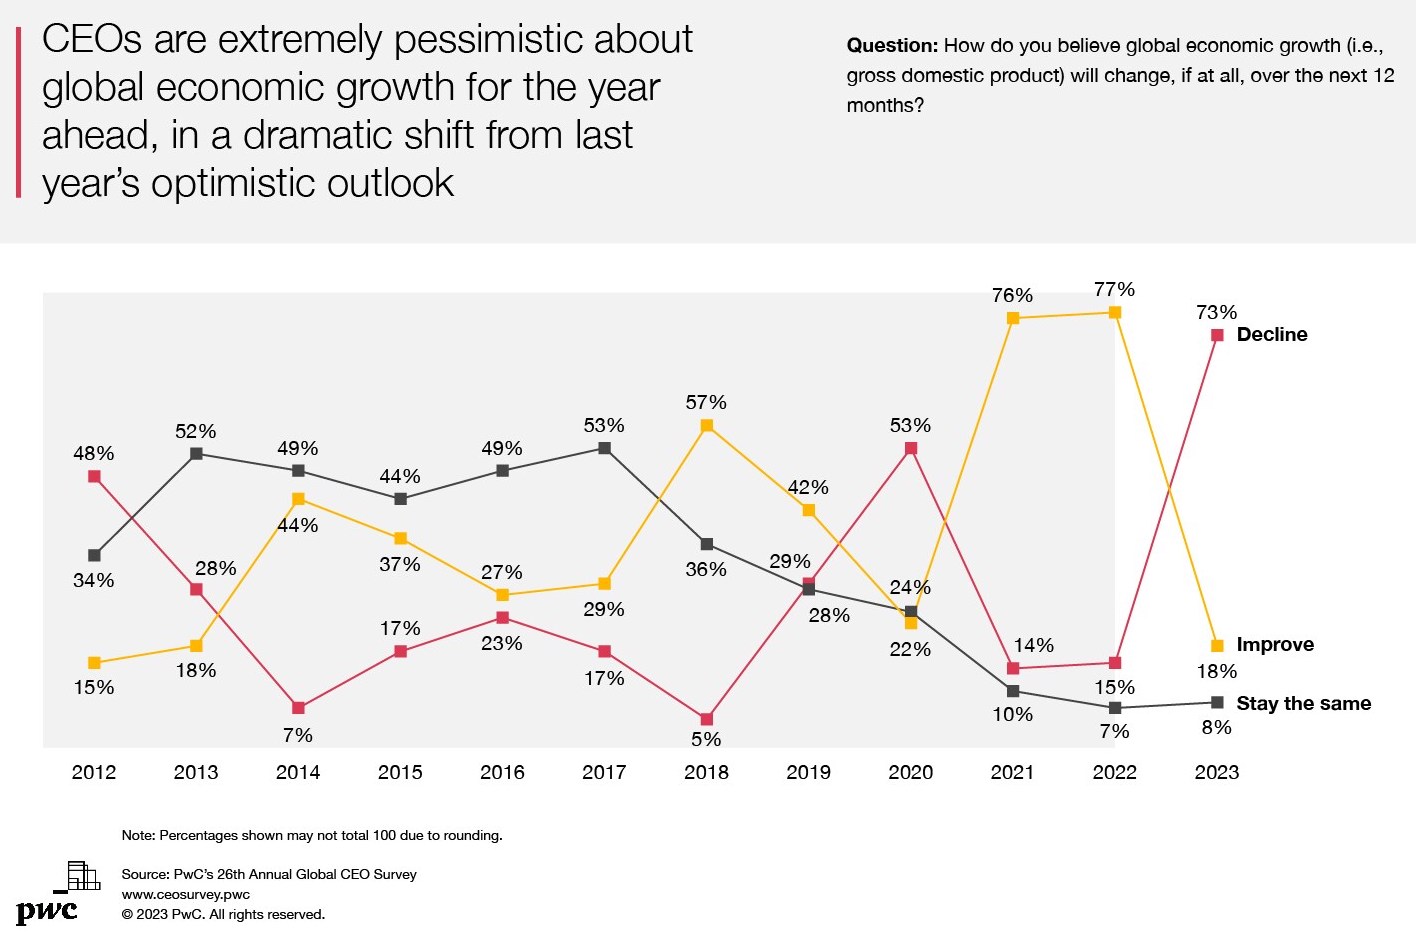
PwC’s 26th annual Global Survey, January 16th, 2023. Source: Holger Zschaepitz
High inflation figures and the thereby resulting sharp rise in interest rates, balance sheet reductions by central banks, the war in Ukraine and the bursting of the China bubble made 2022 one of the most difficult stock market years ever. However, following a month-long sell-off in almost all asset classes, there has been a gradual yet significant recovery in stock markets since mid-October. The weaker US-Dollar also favored a strong recovery in precious metal prices. Nevertheless, the mood among top managers is extremely pessimistic.
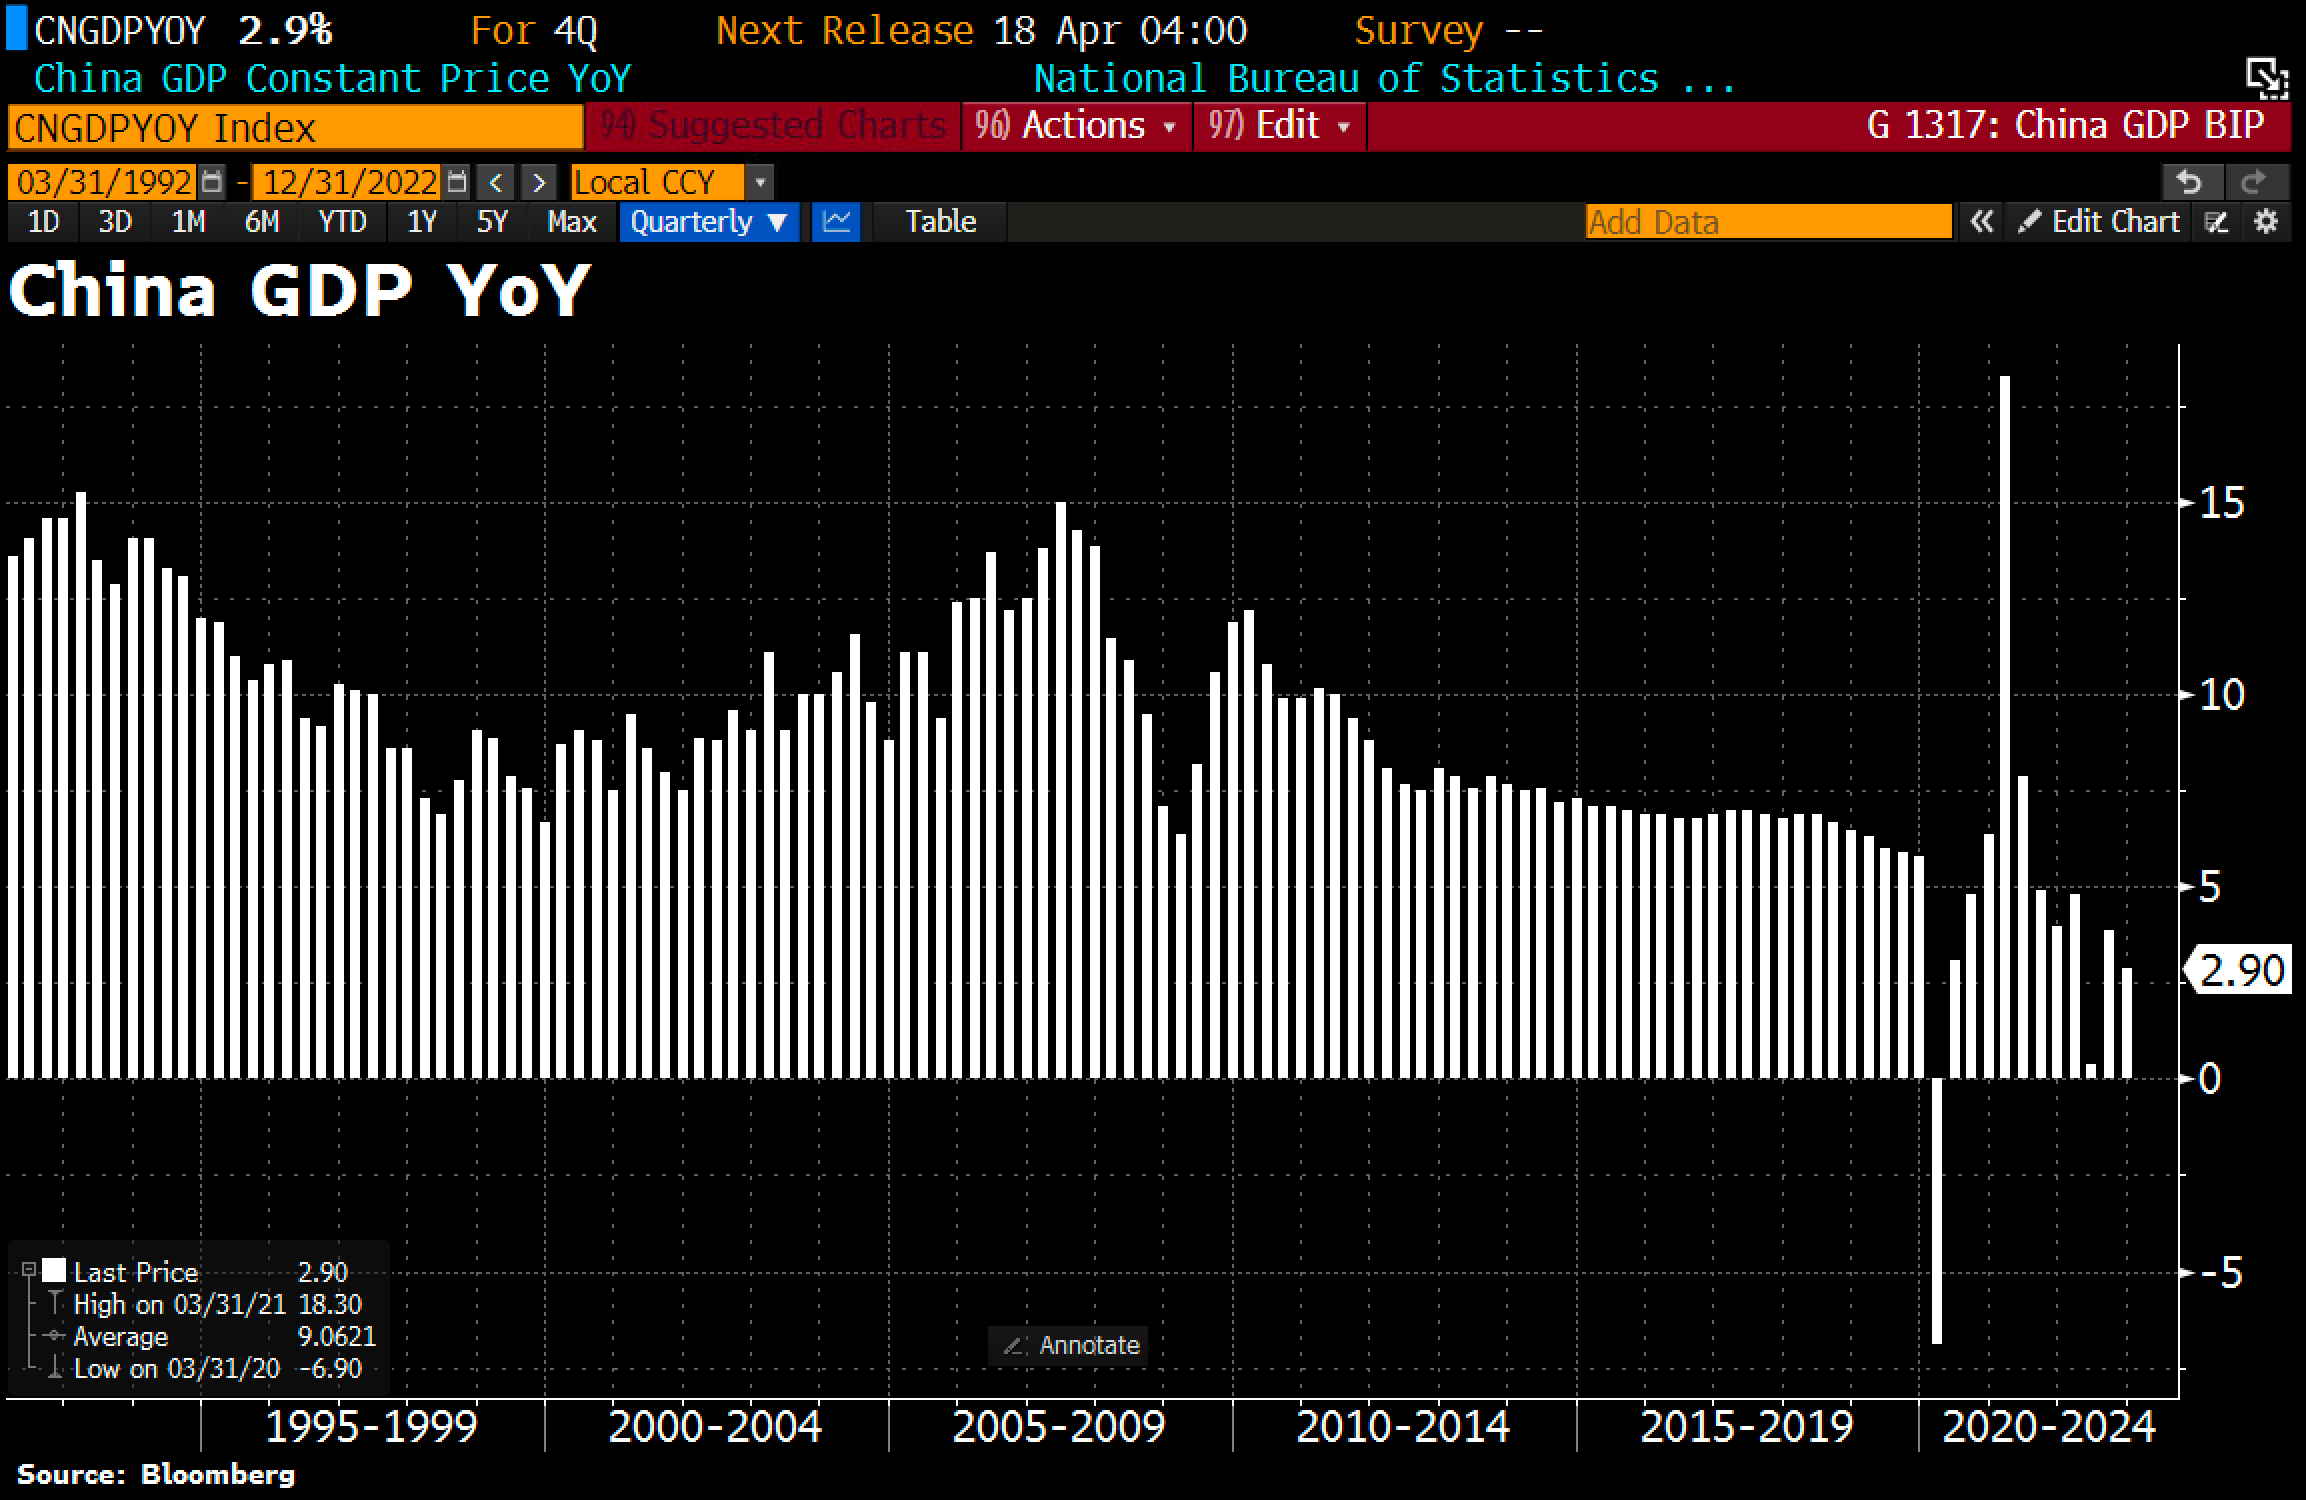
Gross domestic product in China as of January 17th, 2023. Source: Holger Zschaepitz
For several weeks now, the end of the zero-covid policy pushed by the Chinese government has been providing additional inflationary pressure. While the Chinese real estate sector is likely to continue to struggle, overall growth in China should normalize, putting demand pressure on global commodity prices.
Cold War 2.0
At the same time, massive geopolitical challenges lurk, as an end to the drama in Ukraine or a pacification between the West (USA & EU) and the East (China & Russia) are not in sight. For decades, geopolitical risks played only a minor role in financial markets. Now, however, the unipolar world order (“Pax Americana”) is breaking apart, and the world will have to reorganize and rebalance itself in the coming years.
China holds the better cards in this regard, as it is skillfully driving the de-dollarization of global trade flows via OPEC+, the BRICs and also by means of CBDCs. Thus, the US-Dollar has lost about 10% against the Chinese renminbi in the last two months. Currently, growth in China is picking up, while it is slowing down in the U.S.. In particular, the growing trend of invoicing oil and gas sales in renminbi must be a thorn in the Americans’ eye. The U.S. probably does not have much time, if any, left to prevail against an emerging China after all.
In view of all these developments, central bank policy could therefore lose influence on financial markets in the coming years and geopolitics could dominate instead.
Wall of worry until spring or early summer
In any case, regardless of the short-term recoveries, the monetary and fiscal policy situation in the West remains extremely complicated and the fundamental outlook unfavorable. Stagflation will probably be the most likely outcome. The end of the restrictive monetary policy by the FED and the ECB is not yet in sight. However, we expect a reversal in the course of this year. For hard assets such as equities and precious metals, but also Bitcoin, this would be very good news in the medium to longer term. In the short term, the poor fundamental outlook is still countered by too much pessimism and too many shaky hands. The markets could therefore initially continue to recover along a “wall of worry” until spring or early summer.
Conclusion: Bitcoin – Significant recovery expected
Given the strong start into the new year (+30%), chances for a big recovery in Bitcoin are very good. With the steep correction (-77.5%) since November 2021, all weak hands and unprofitable or dubious companies and players should have been flushed out of the market. It’s not that these players have been wiped out forever, but they will probably only return to the Bitcoin market at significantly higher prices.
The Achilles heel for the crypto sector and Bitcoin, on the other hand, remains the foreseeable regulation by policymakers. The FTX disaster has shaken confidence in the sector and has now really put all politicians and regulators on notice. Technically, the Bitcoin network is unstoppable, but with penalties and bans, exchange regulators might hit the sector hard in the coming months and years.
Nevertheless, we are bullish and think a major recovery with prices of 35,000 USD to maybe even 50,000 USD by early summer is quite possible.
Analysis sponsored and initially published on January 17th, 2023, by www.celticgold.eu. Translated into English and partially updated on January 18th, 2023.
Feel free to join us in our free Telegram channel for daily real time data and a great community. If you like to get regular updates on our gold model, precious metals, commodities, and cryptocurrencies, you can also subscribe to our free newsletter.
Disclosure:
This article and the content are for informational purposes only and do not contain investment advice or recommendations. Every investment and trading move involves risk, and readers should conduct their own research when making a decision. The views, thoughts, and opinions expressed here are the author’s alone. They do not necessarily reflect or represent the views and opinions of Midas Touch Consulting.


