


Bitcoin – Recovery reaches first price target
Review
Since our analysis on July 13th (Relief rally in summer?), bitcoin has recovered significantly, as expected. At the peak, bitcoin prices gained almost 33% in the last four weeks and reached the highest level since the crash in mid-June with prices around 25,212 USD. Ethereum performed even stronger, rallying nearly 102% over the same timeframe.
Over the last two weeks, however, bitcoin has been rather calmly running sideways between 22,500 USD and 24,500 USD. At the same time, stock markets as well as most commodity prices were able to recover a good bit in recent weeks, too. Hence, financial markets in general are experiencing the expected summer rally.
Since sentiment had reached an extreme panic mood in mid of June due to the month-long and severe correction in the financial markets, the perception among participants has now improved significantly in the course of the recent recovery. In itself, this is a classic pattern within an established bear market. Yet, whether and how the bears will return, will likely not get clearer until mid of September.
Technical Analysis For Bitcoin in US-Dollar
Bitcoin Weekly Chart – Stochastic oscillator with a buy signal.
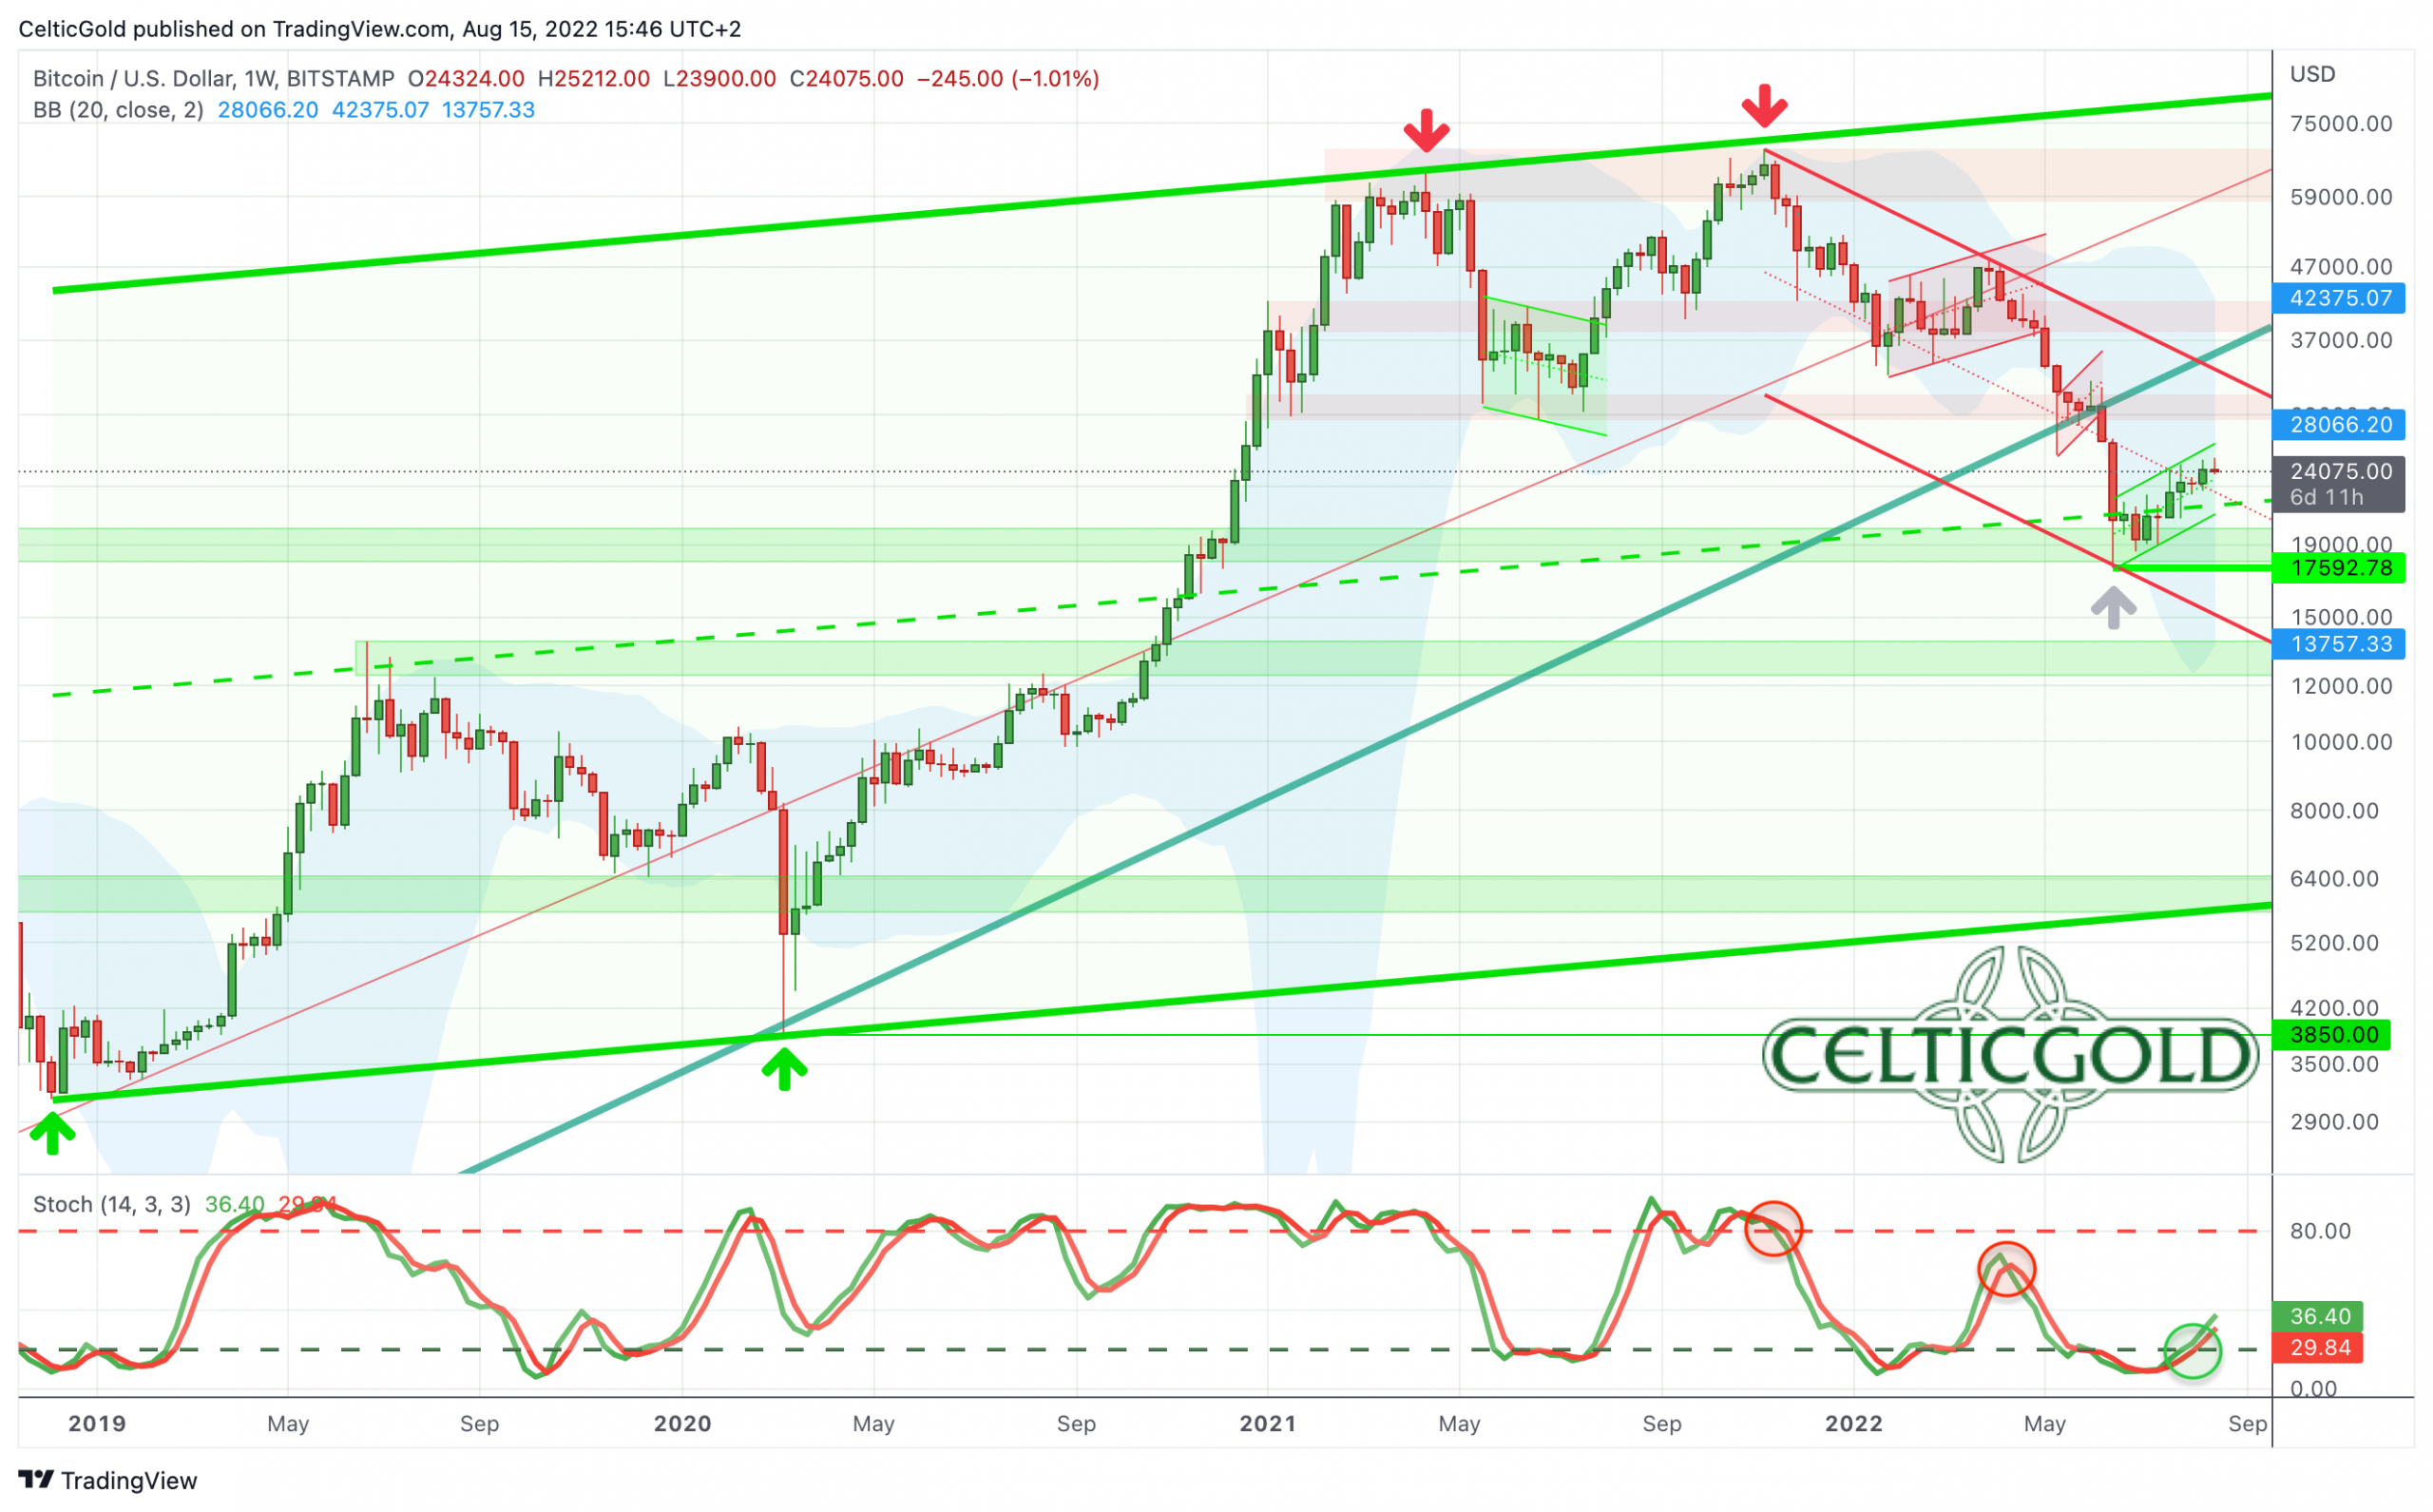
Bitcoin in USD, weekly chart as of August 15th, 2022. Source: Tradingview
Within the established downtrend channel, since the all-time high at 69,000 USD in November 2021, bitcoin was able to recover a good bit recently. Starting from the low around 17,600 USD, bitcoin is currently trading nearly 37% higher. This recovery has led to a buy signal from the weekly stochastic oscillator. As well, the recovery wave has also crossed the mid-trend line within the downtrend channel. Therefore, chances for a continuation of the recovery towards 29,000 USD to 30,000 USD are pretty good.
Overall, the weekly chart is providing a first bullish signal. It is still too early to speak of a sustainable trend reversal and the end of the crypto winter. However, a continuation of the recovery seems quite possible in any case and is the preferred scenario.
Bitcoin Daily Chart – 200-day moving average remains the recovery target
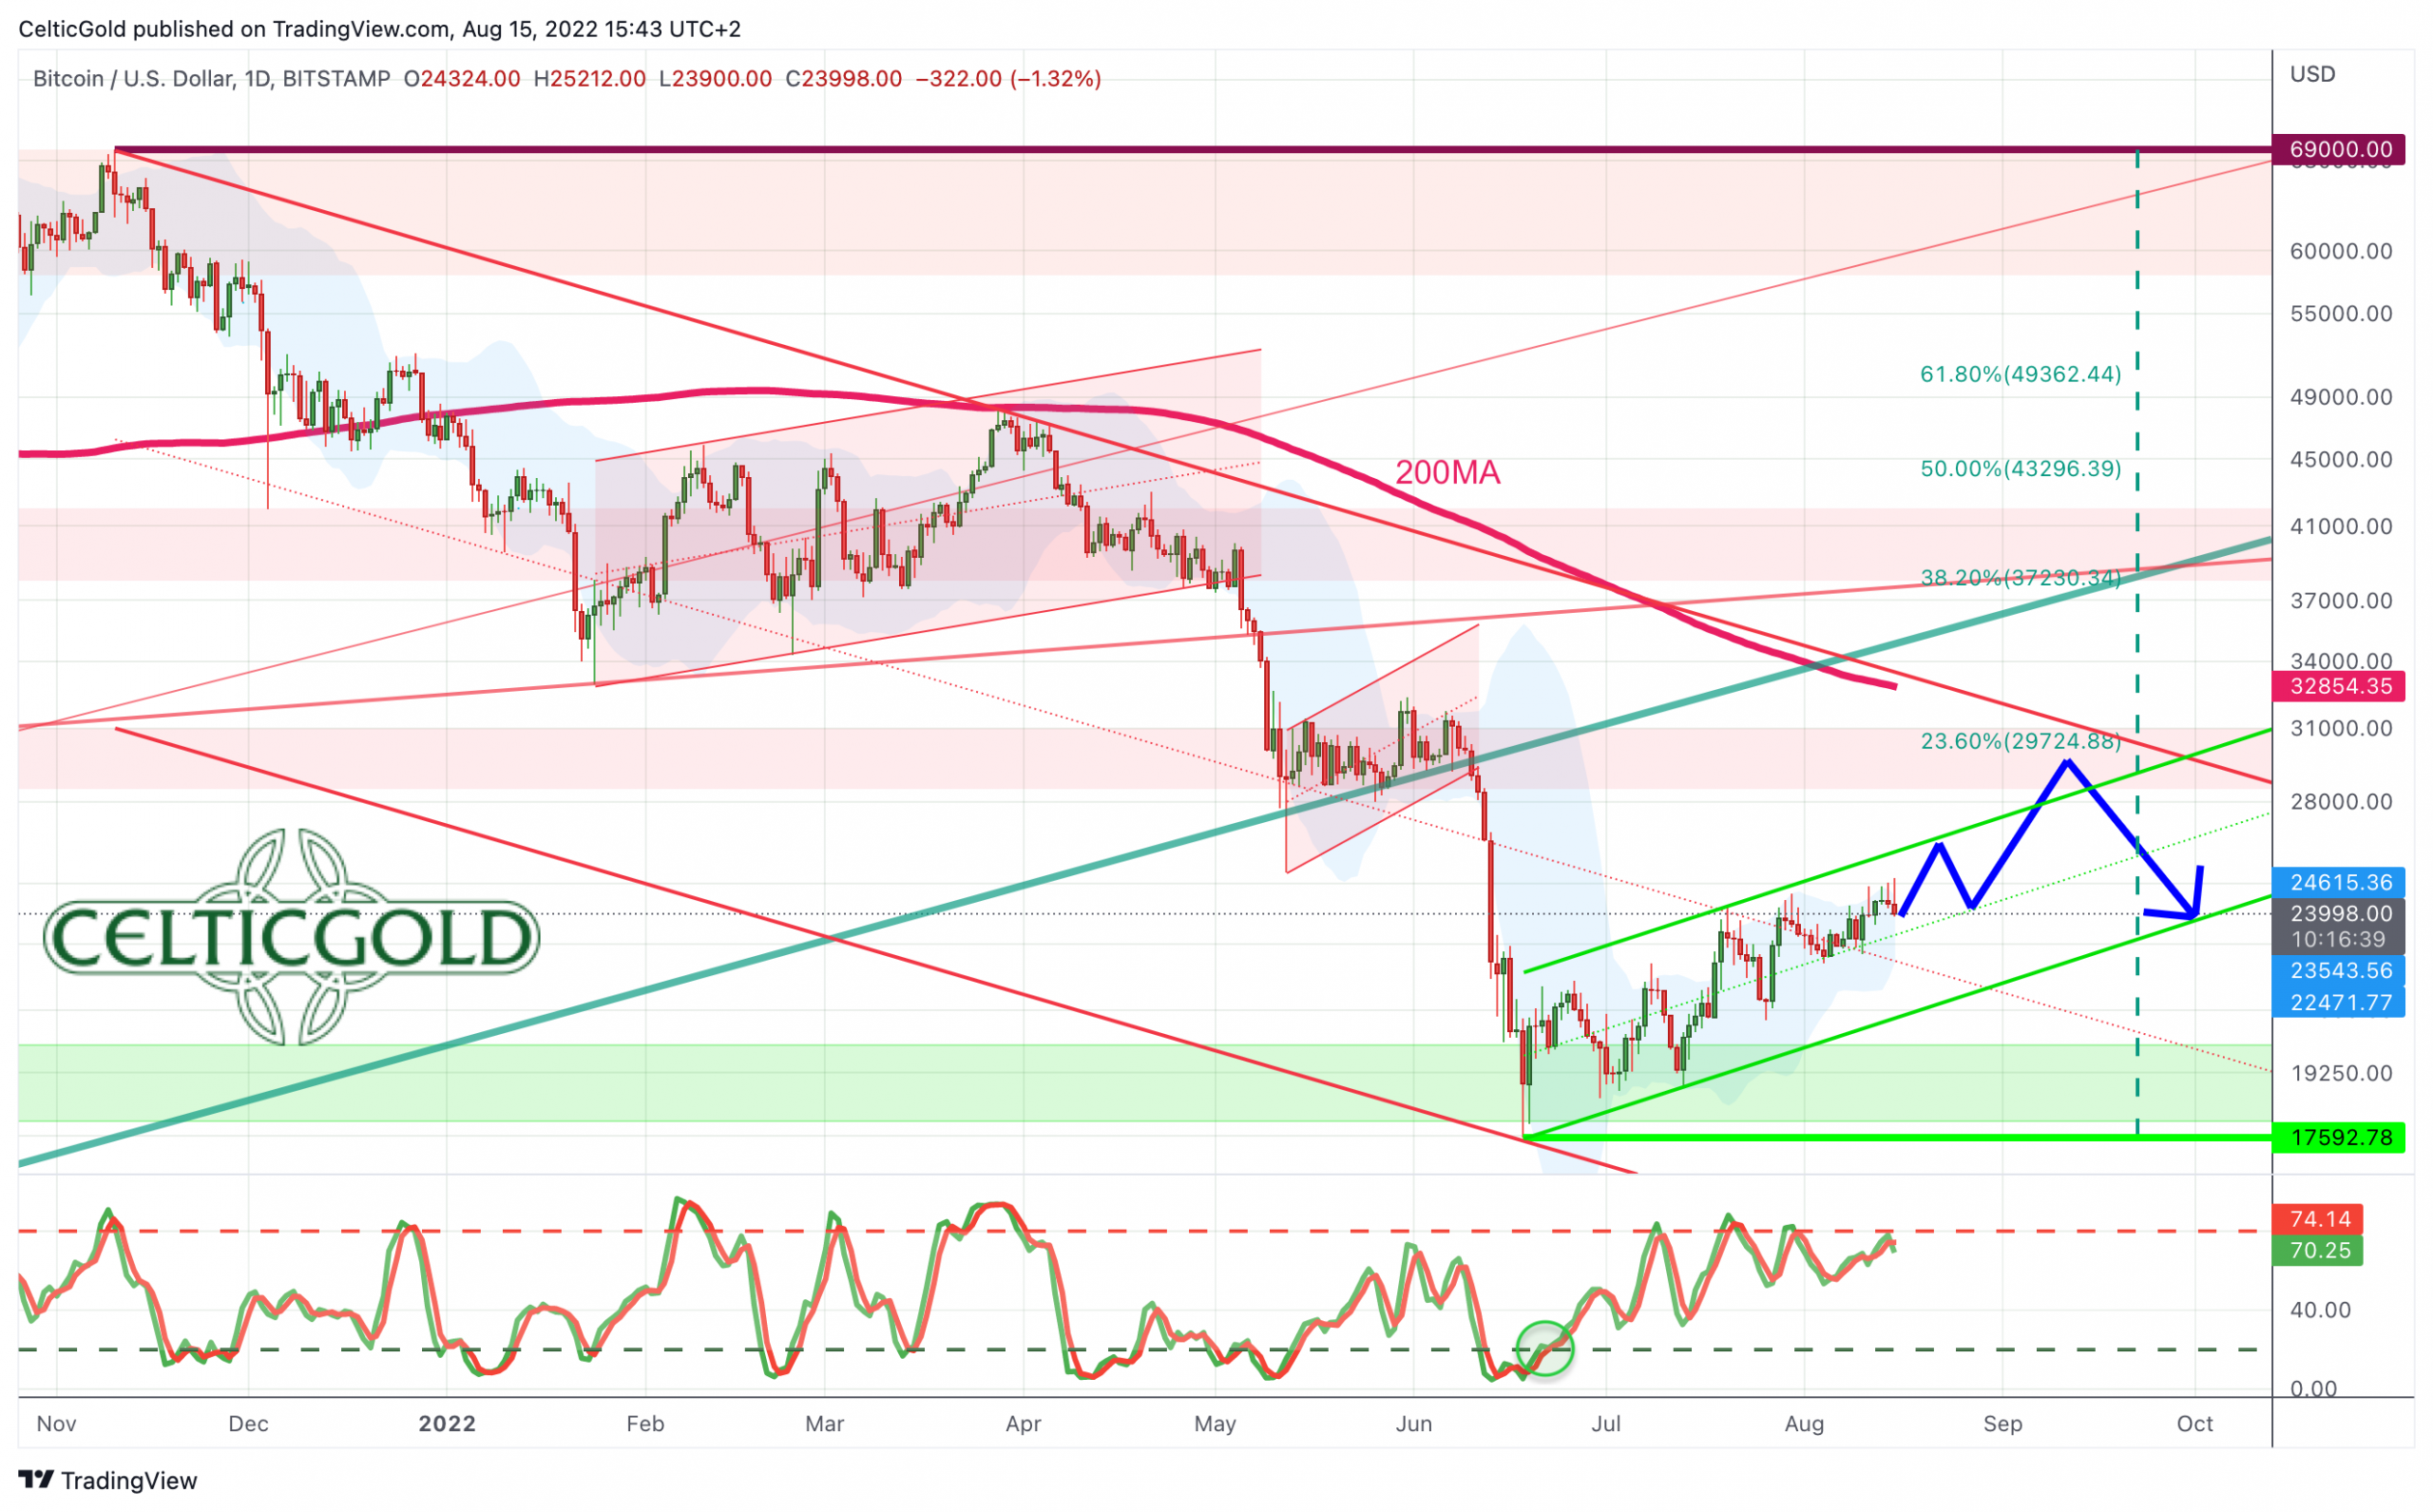
Bitcoin in USD, daily chart as of August 15th, 2022. Source: Tradingview
On the daily chart, bitcoin prices have reached our first price target around 25,000 USD. Currently, bitcoin is trading slightly below its upper Bollinger Band (24,622 USD). Though this resistance has been attacked various times in recent weeks, it has not (yet) released more room to the upside on a daily basis. While the stochastic oscillator is trying to hide its active buy signal, the distance to the falling 200-day line (32,855 USD) is still significant. A reunion with this moving average should therefore definitely succeed in the coming weeks or months.
Nevertheless, the flat uptrend can still turn out to be a bearish flag formation, similar to the beginning of May. But even then, the higher probability points towards the upside, at least in the short term. Thus, a sustained rise above 25,000 USD could force a short squeeze and entail a rapid rise towards 29,000 to 30,000 USD.
In summary, the daily chart is bullish. The recovery still has room to the upside. The next recovery target is the 30,000 USD mark and the fast falling 200-day moving average line. Only below 22,000 USD, the picture would degrade significantly.
Sentiment Bitcoin – Recovery reaches first price target
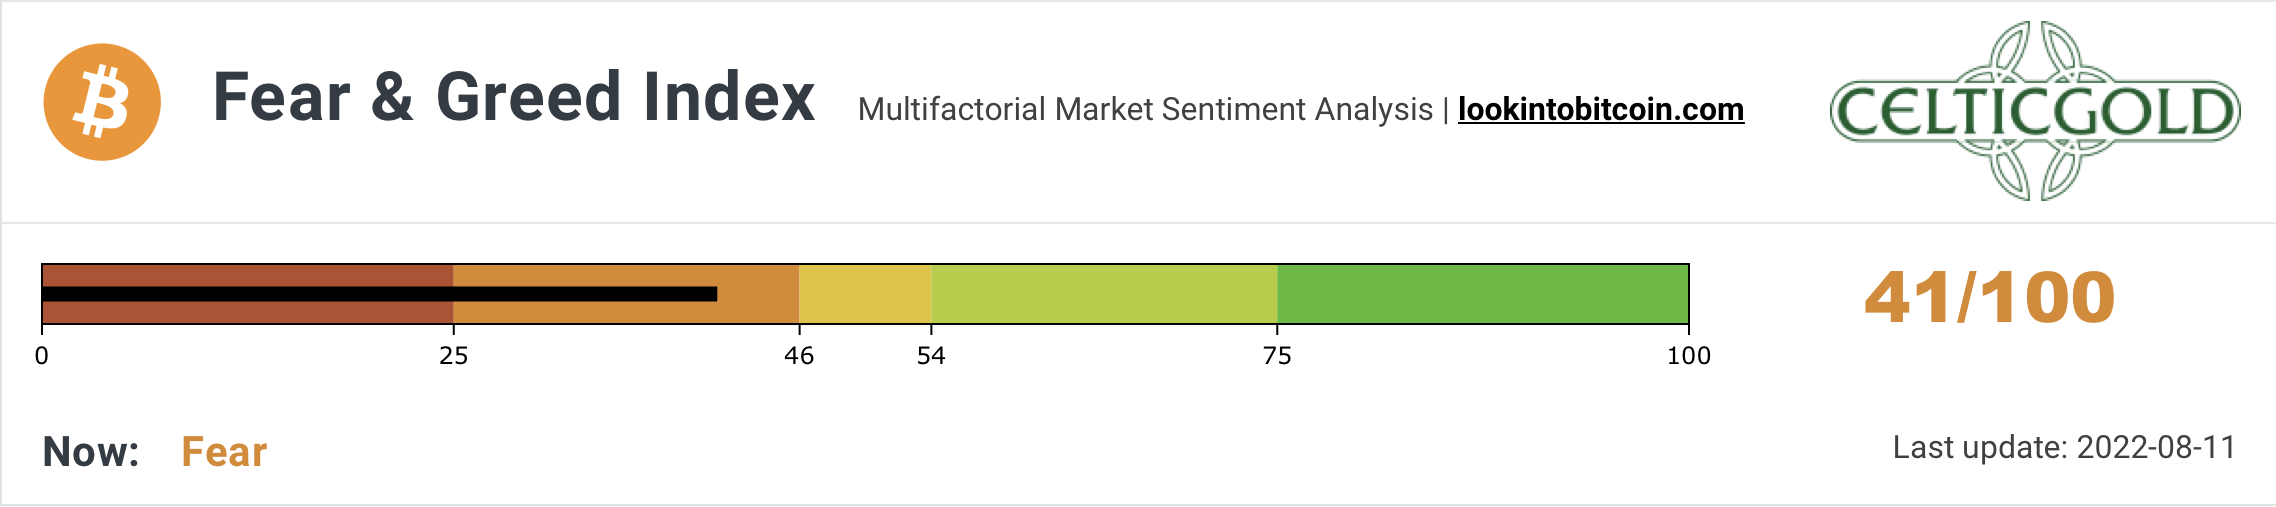
Crypto Fear & Greed Index, as of August 11th, 2022. Source: Lookintobitcoin
The Crypto Fear & Greed Index has recovered significantly over the past four weeks. However, it still measures a rather fearful sentiment. After the brutal sell-off, which spanned over seven months, fear continues to run deep in the crypto sector.
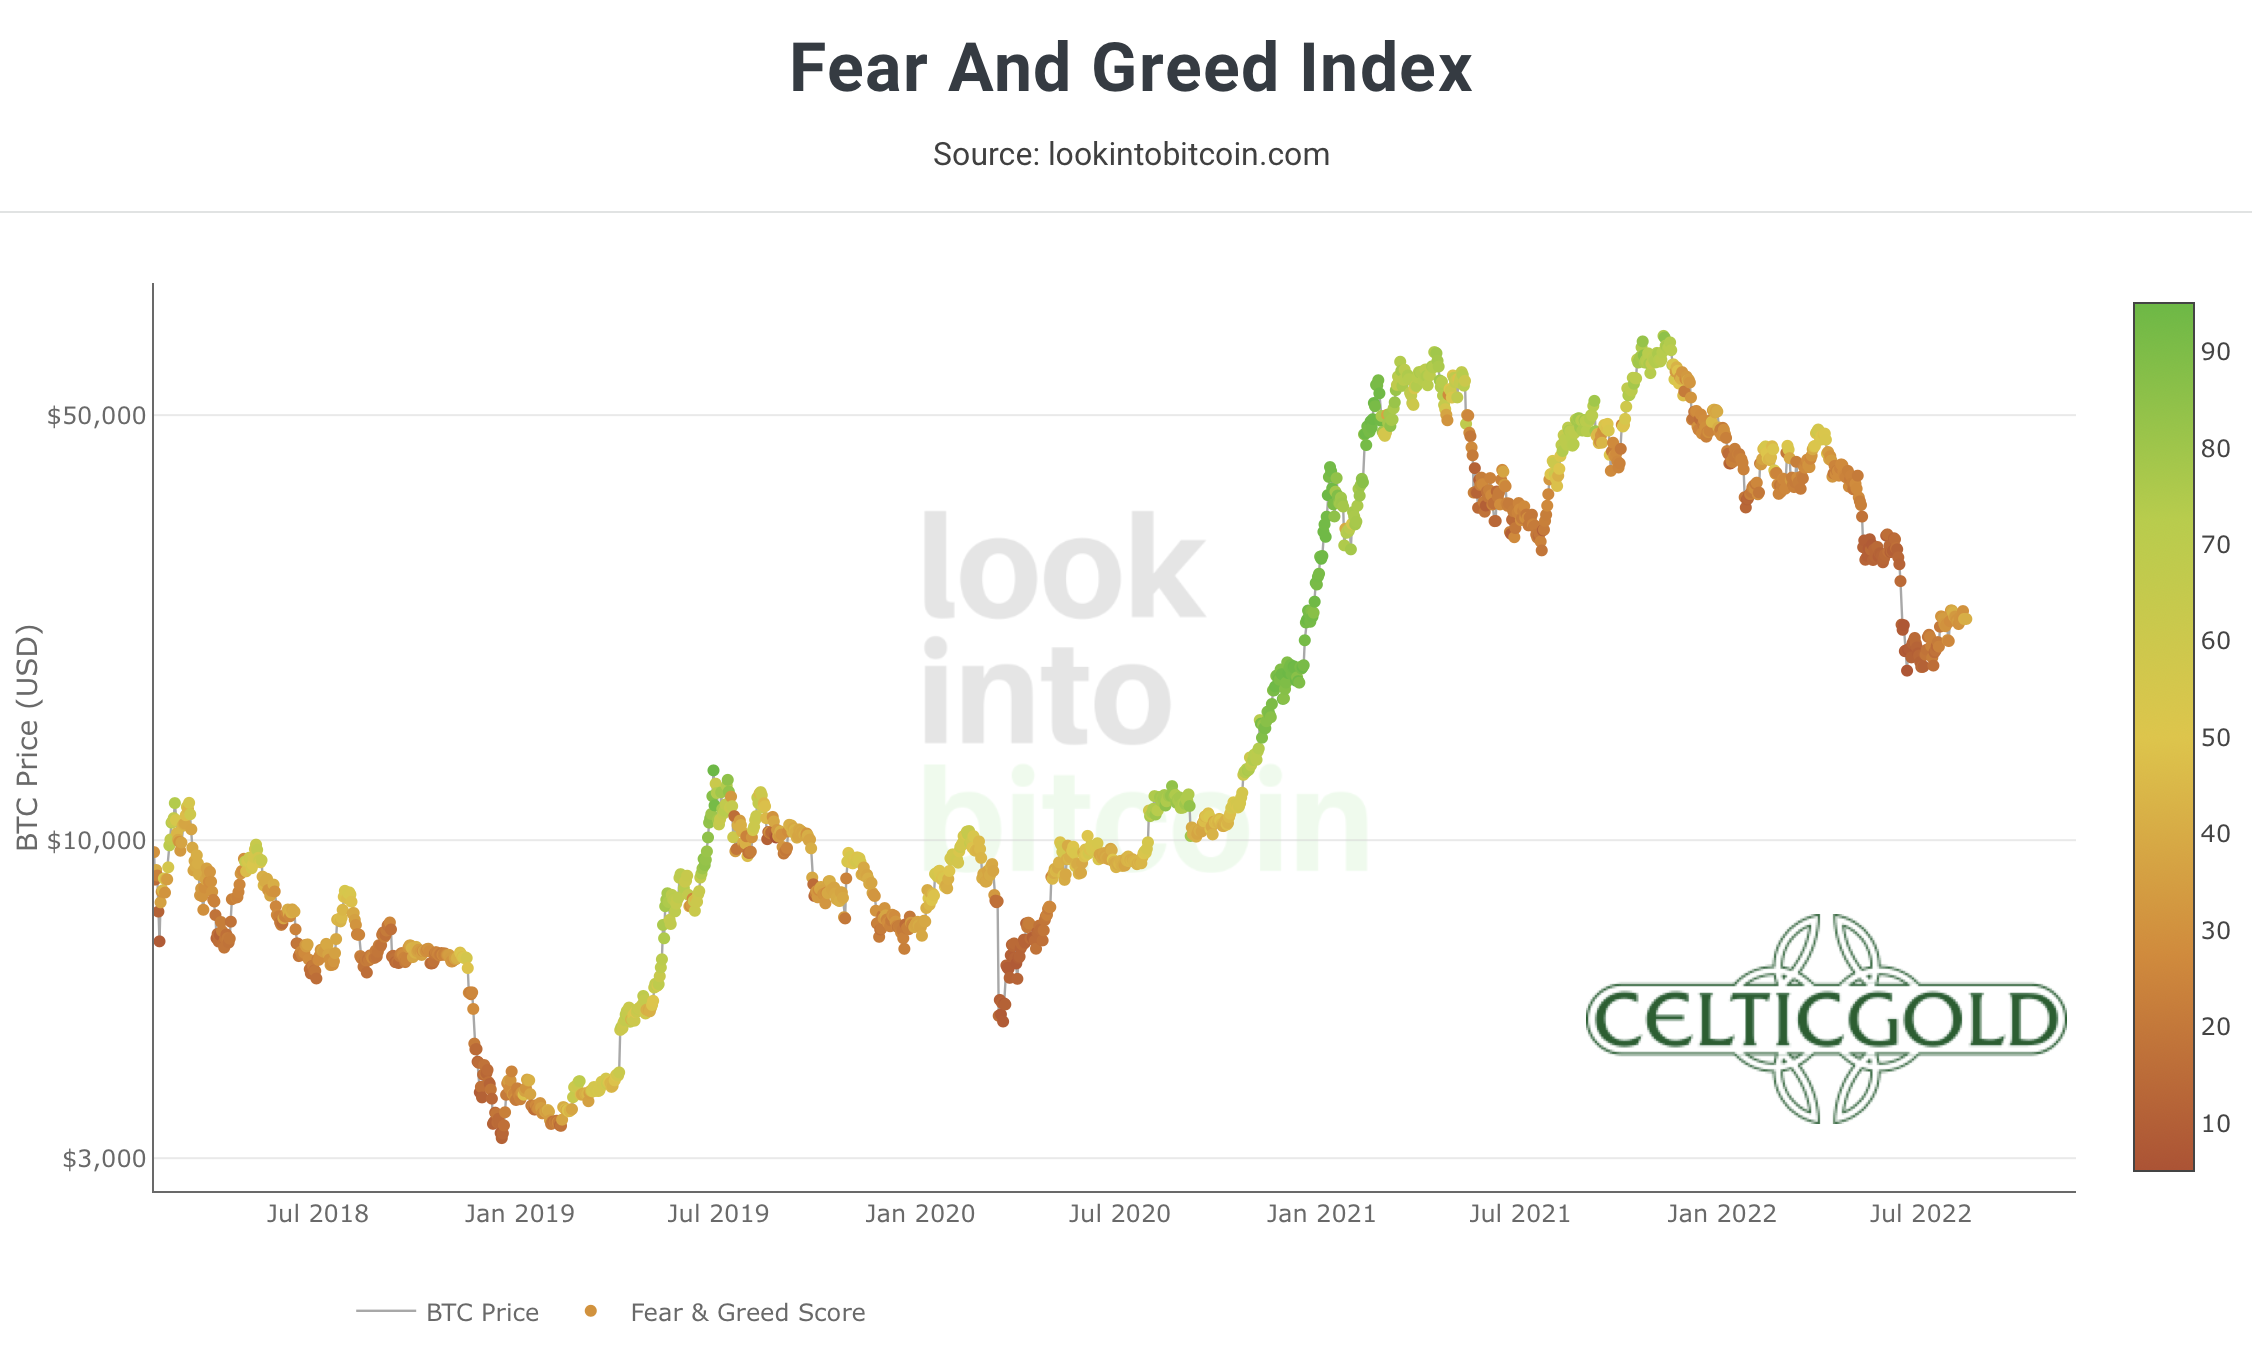
Crypto Fear & Greed Index long term, as of August 11th, 2022. Source: Lookintobitcoin
In the bigger picture, the beaten down sentiment remains in place, as well. This setup holds some really good contrarian opportunities.
Overall, the fearful sentiment continues to provide a contrarian buy signal.
Seasonality Bitcoin – Recovery reaches first price target
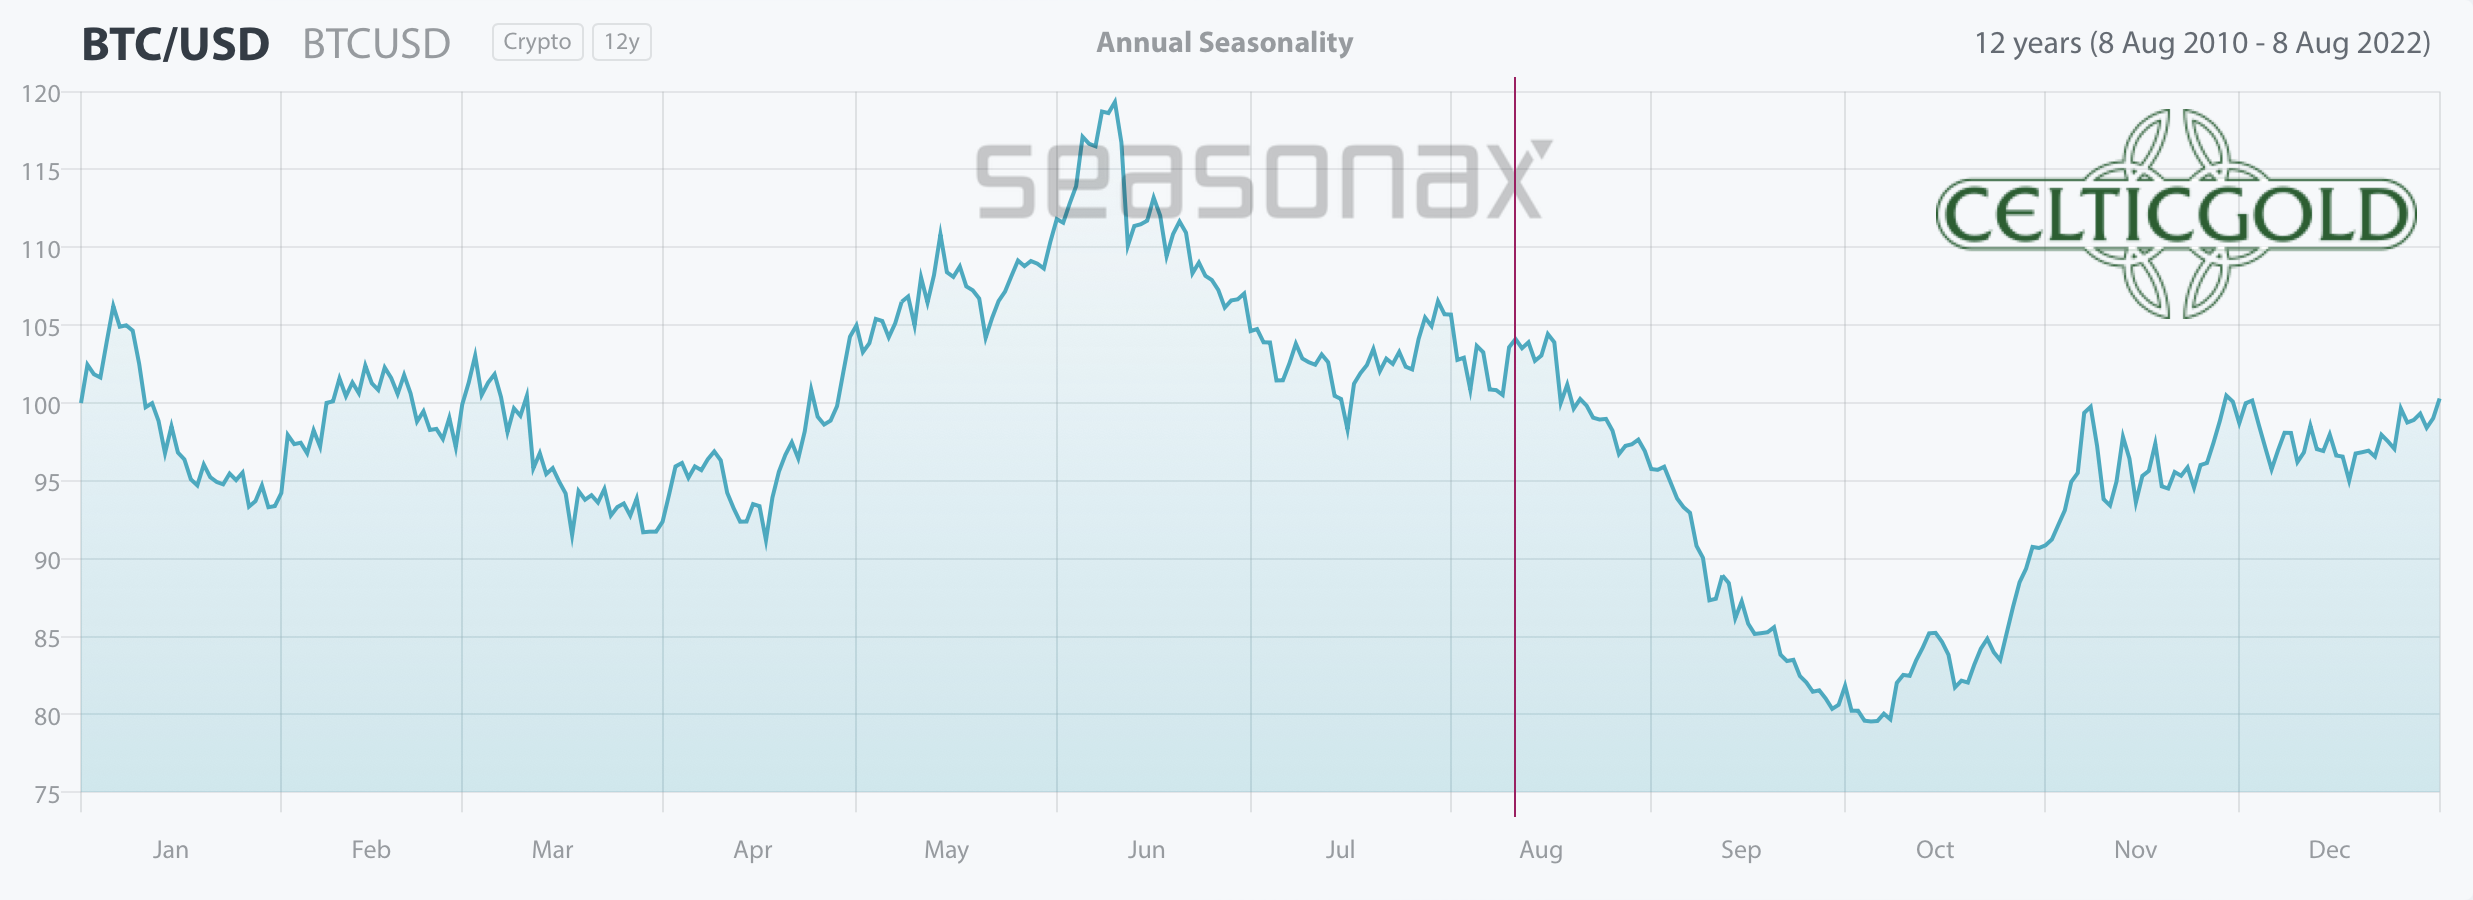
Seasonality for bitcoin, as of August 11th, 2022. Source: Seasonax
The seasonal component remains rather unfavorable until the end of September or the beginning of October. In particular, September is traditionally a weak month in the stock markets. Since bitcoin and the stock markets have been strongly correlated for months, the weak seasonal trend might therefore get reinforced in September. However, according to the seasonal pattern, October could see the start of a new uptrend in the crypto sector.
Given the “midterm elections” on November 8th in the U.S., sharp drops in the financial markets would be very counterproductive to keep the current administration in place. Therefore, only a mild pullback in financial markets during September would be more conceivable. From those lows the markets could then recover further until the U.S. election.
Overall, the seasonal component still calls for patience. Statistically speaking, the situation does not brighten up significantly until mid-October. In the very short term, however, the continuation of the summer rally is still possible.
Sound Money: Bitcoin vs. Gold
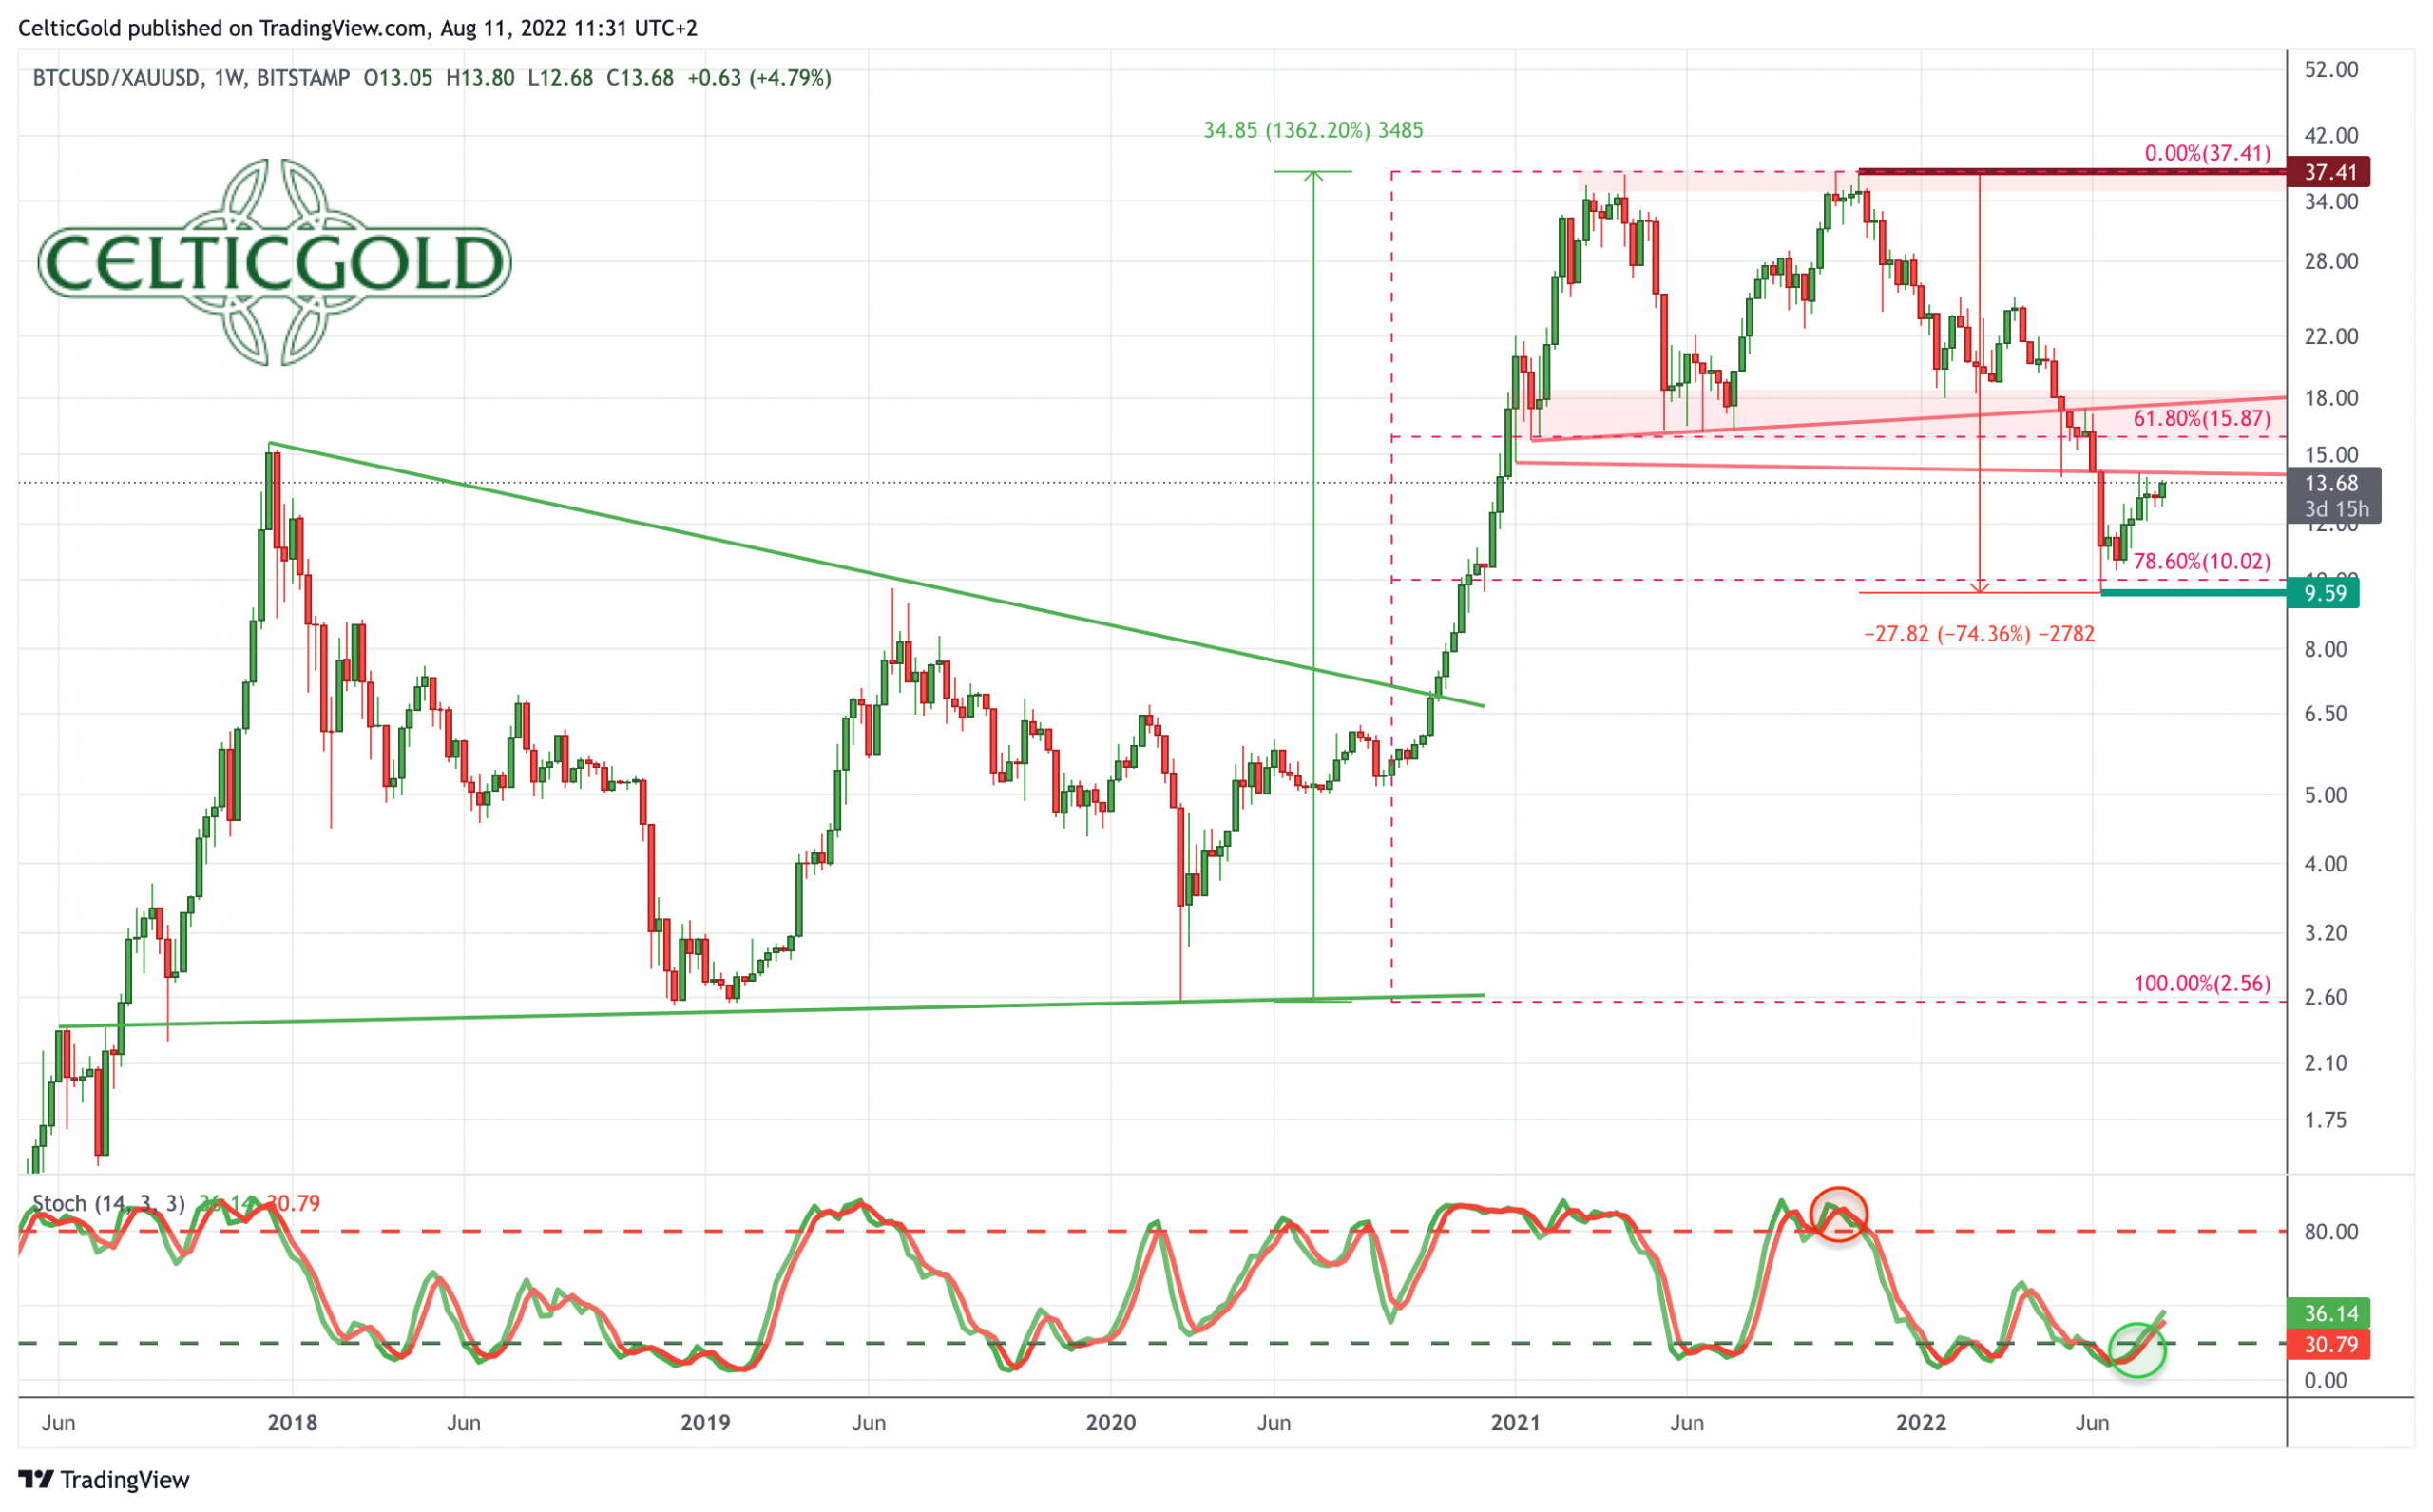
Bitcoin/Gold-Ratio as of August 15th, 2022.Source: Tradingview
The bitcoin/gold-ratio recovered from its low of 9.59 to its current level of 13.5. At prices of currently around 24,000 USD for one bitcoin and around 1,775 for one troy ounce of gold, you have to pay 13.5 ounces of gold for one bitcoin. Put another way, a troy ounce of gold currently costs about 0.074 bitcoin.
Overall, a recovery in favor of bitcoin against gold has been on its way over the past four weeks. The aforementioned recovery target in the range of about 15 to 16 has not yet been reached, but is now in sight. Due to the rise, the stochastic on the weekly chart has activated a new buy signal. If the ratio can break out above the current resistance around 14, a continuation of the recovery to around 16.50 to 17.50 would be conceivable. In this region, the ratio then again encounters strong resistance.
Allocation of sound money
Generally, buying and selling Bitcoin against gold only makes sense to the extent that one balances the allocation in those two asset classes! At least 10% up to a maximum of 25% of one’s total assets should be invested in precious metals physically, while in cryptos and especially in bitcoin one should hold at least 1% but max. 5%. If you are very familiar with cryptocurrencies and bitcoin, you can certainly allocate much higher percentages to bitcoin on an individual basis. For the average investor, who is primarily invested in equities and real estate, a maximum of 5% in the still highly speculative and highly volatile bitcoin is a good guideline!
“Overall, you want to own gold and bitcoin, since opposites complement each other. In our dualistic world of Yin and Yang, body and mind, up and down, warm and cold, we are bound by the necessary attraction of opposites. In this sense you can view gold and bitcoin as such a pair of strength. With the physical scarcity of gold and the digital scarcity of bitcoin you have a complementary unit of hard assets that will act as a true safe haven in the 21st century. You want to own both!” – Florian Grummes
In summary, the bitcoin/gold-ratio still has a good chance to continue its recovery in favor of bitcoin in the direction of about 16.50 to 17.50 over the coming weeks .
Macro Update – Summer recovery more than just a bear market rally?
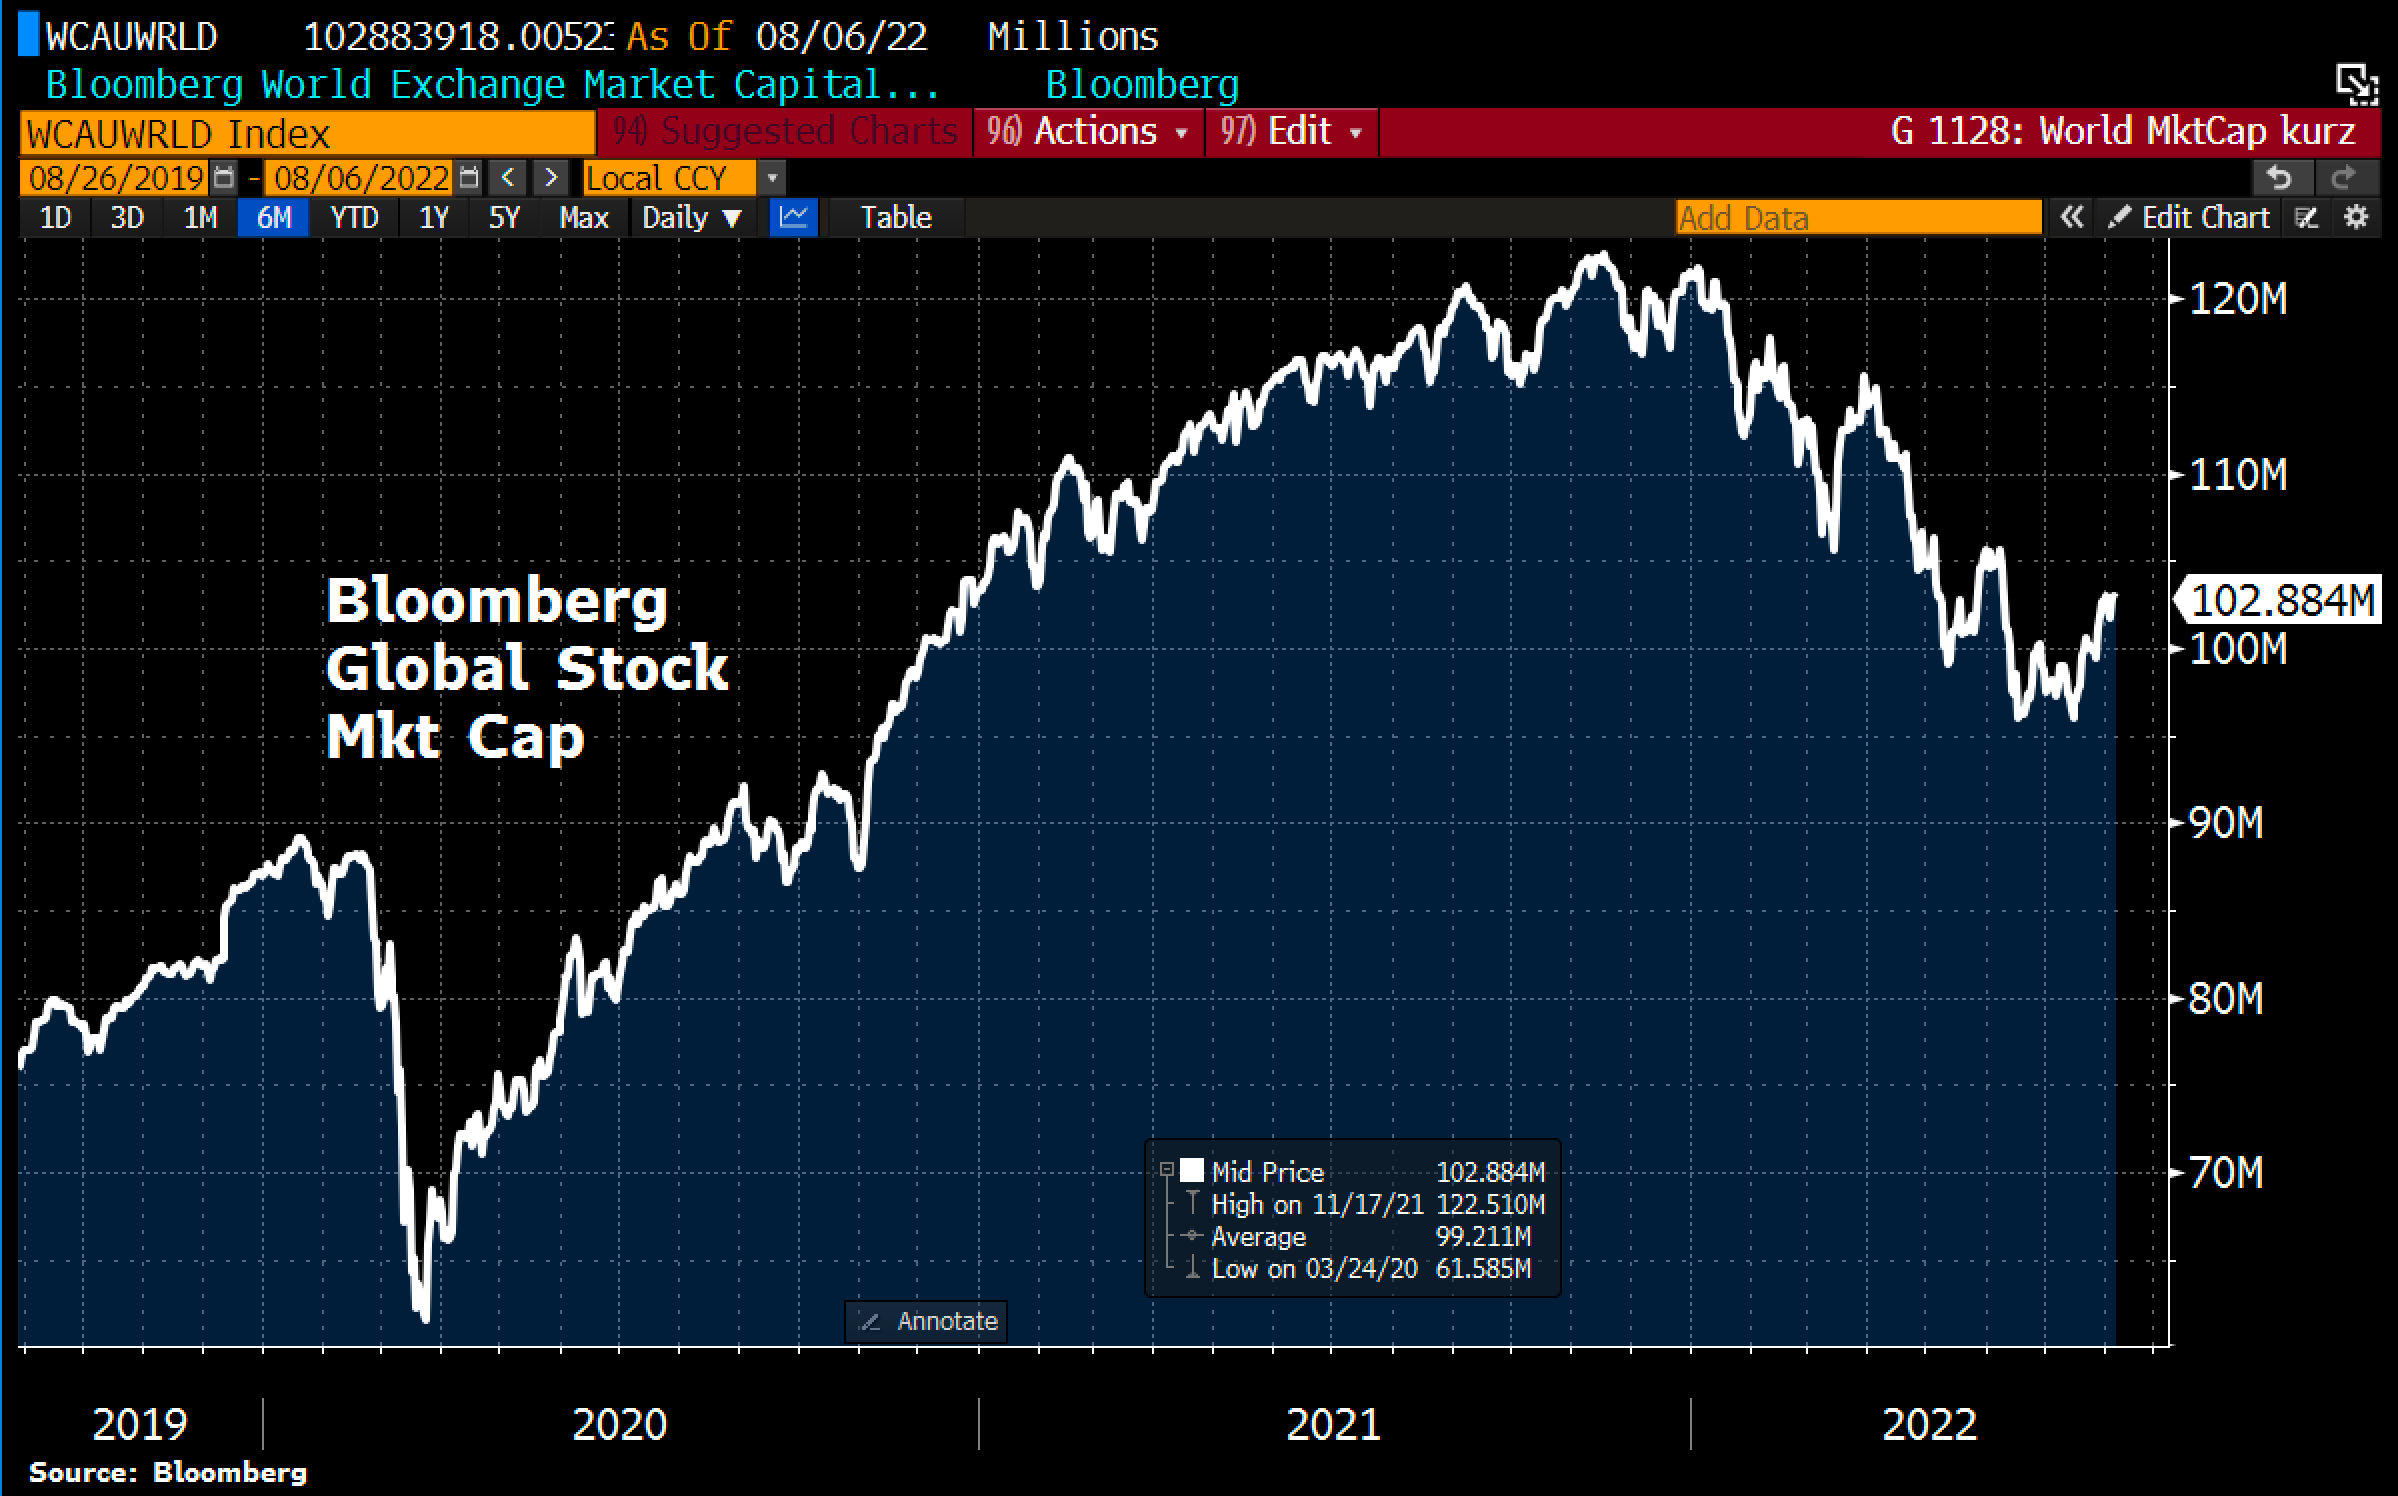
Global stock-market capitalization, as of August 6th, 2022. ©Holger Zschaepitz
After months of tremendous pressure in equity and crypto markets since November 2021, a broad-based recovery has now been underway for just over four weeks. In this process, global equity markets have gained over 420 billion USD in market value and the technology-heavy Nasdaq Composite has risen over 20% from its low on June 16th. By definition, this would mean the bear market is over!
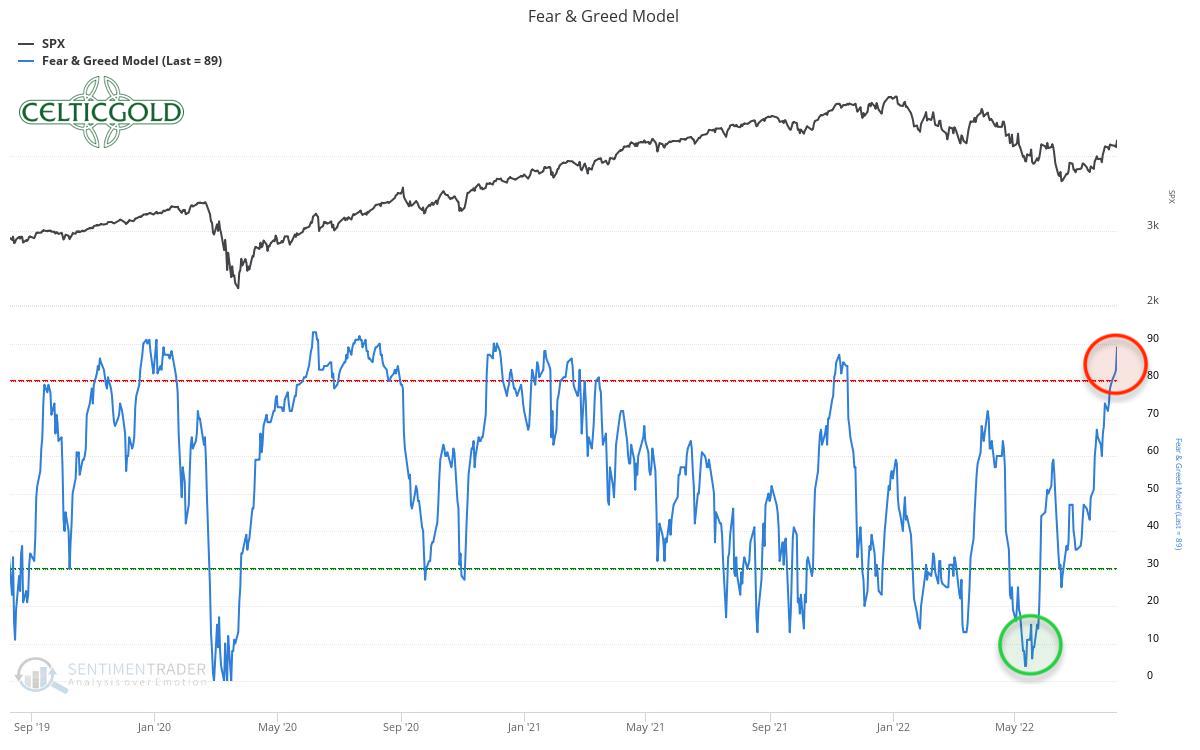
Fear and Greed model, as of August 10th, 2022. Source: Sentimentrader
However, this recent recovery has brought about a shift in sentiment and the majority of market participants are now more optimistic about the future again. Thus, the Fear & Greed model has shifted from maximum fear to extreme greed in no time and the “Dumb Money” is daring to enter the markets again. This is the point at which bear market rallies usually turn!
Given the ongoing recovery rally, however, clarity might not come before September about whether the month-long wave down in the markets was merely corrective in nature, or whether the markets are actually in a major cyclical bear market.
In any case, the significant reduction in the Fed’s balance sheet only starts to gain momentum in September. From the current level of around 10 to 30 billion USD per month, almost half a trillion USD per month will then be wiped out. The midterm elections on November 8, on the other hand, could provide numerous fiscal stimuli on all fronts in order to prevent a landslide victory for the Republicans after all.
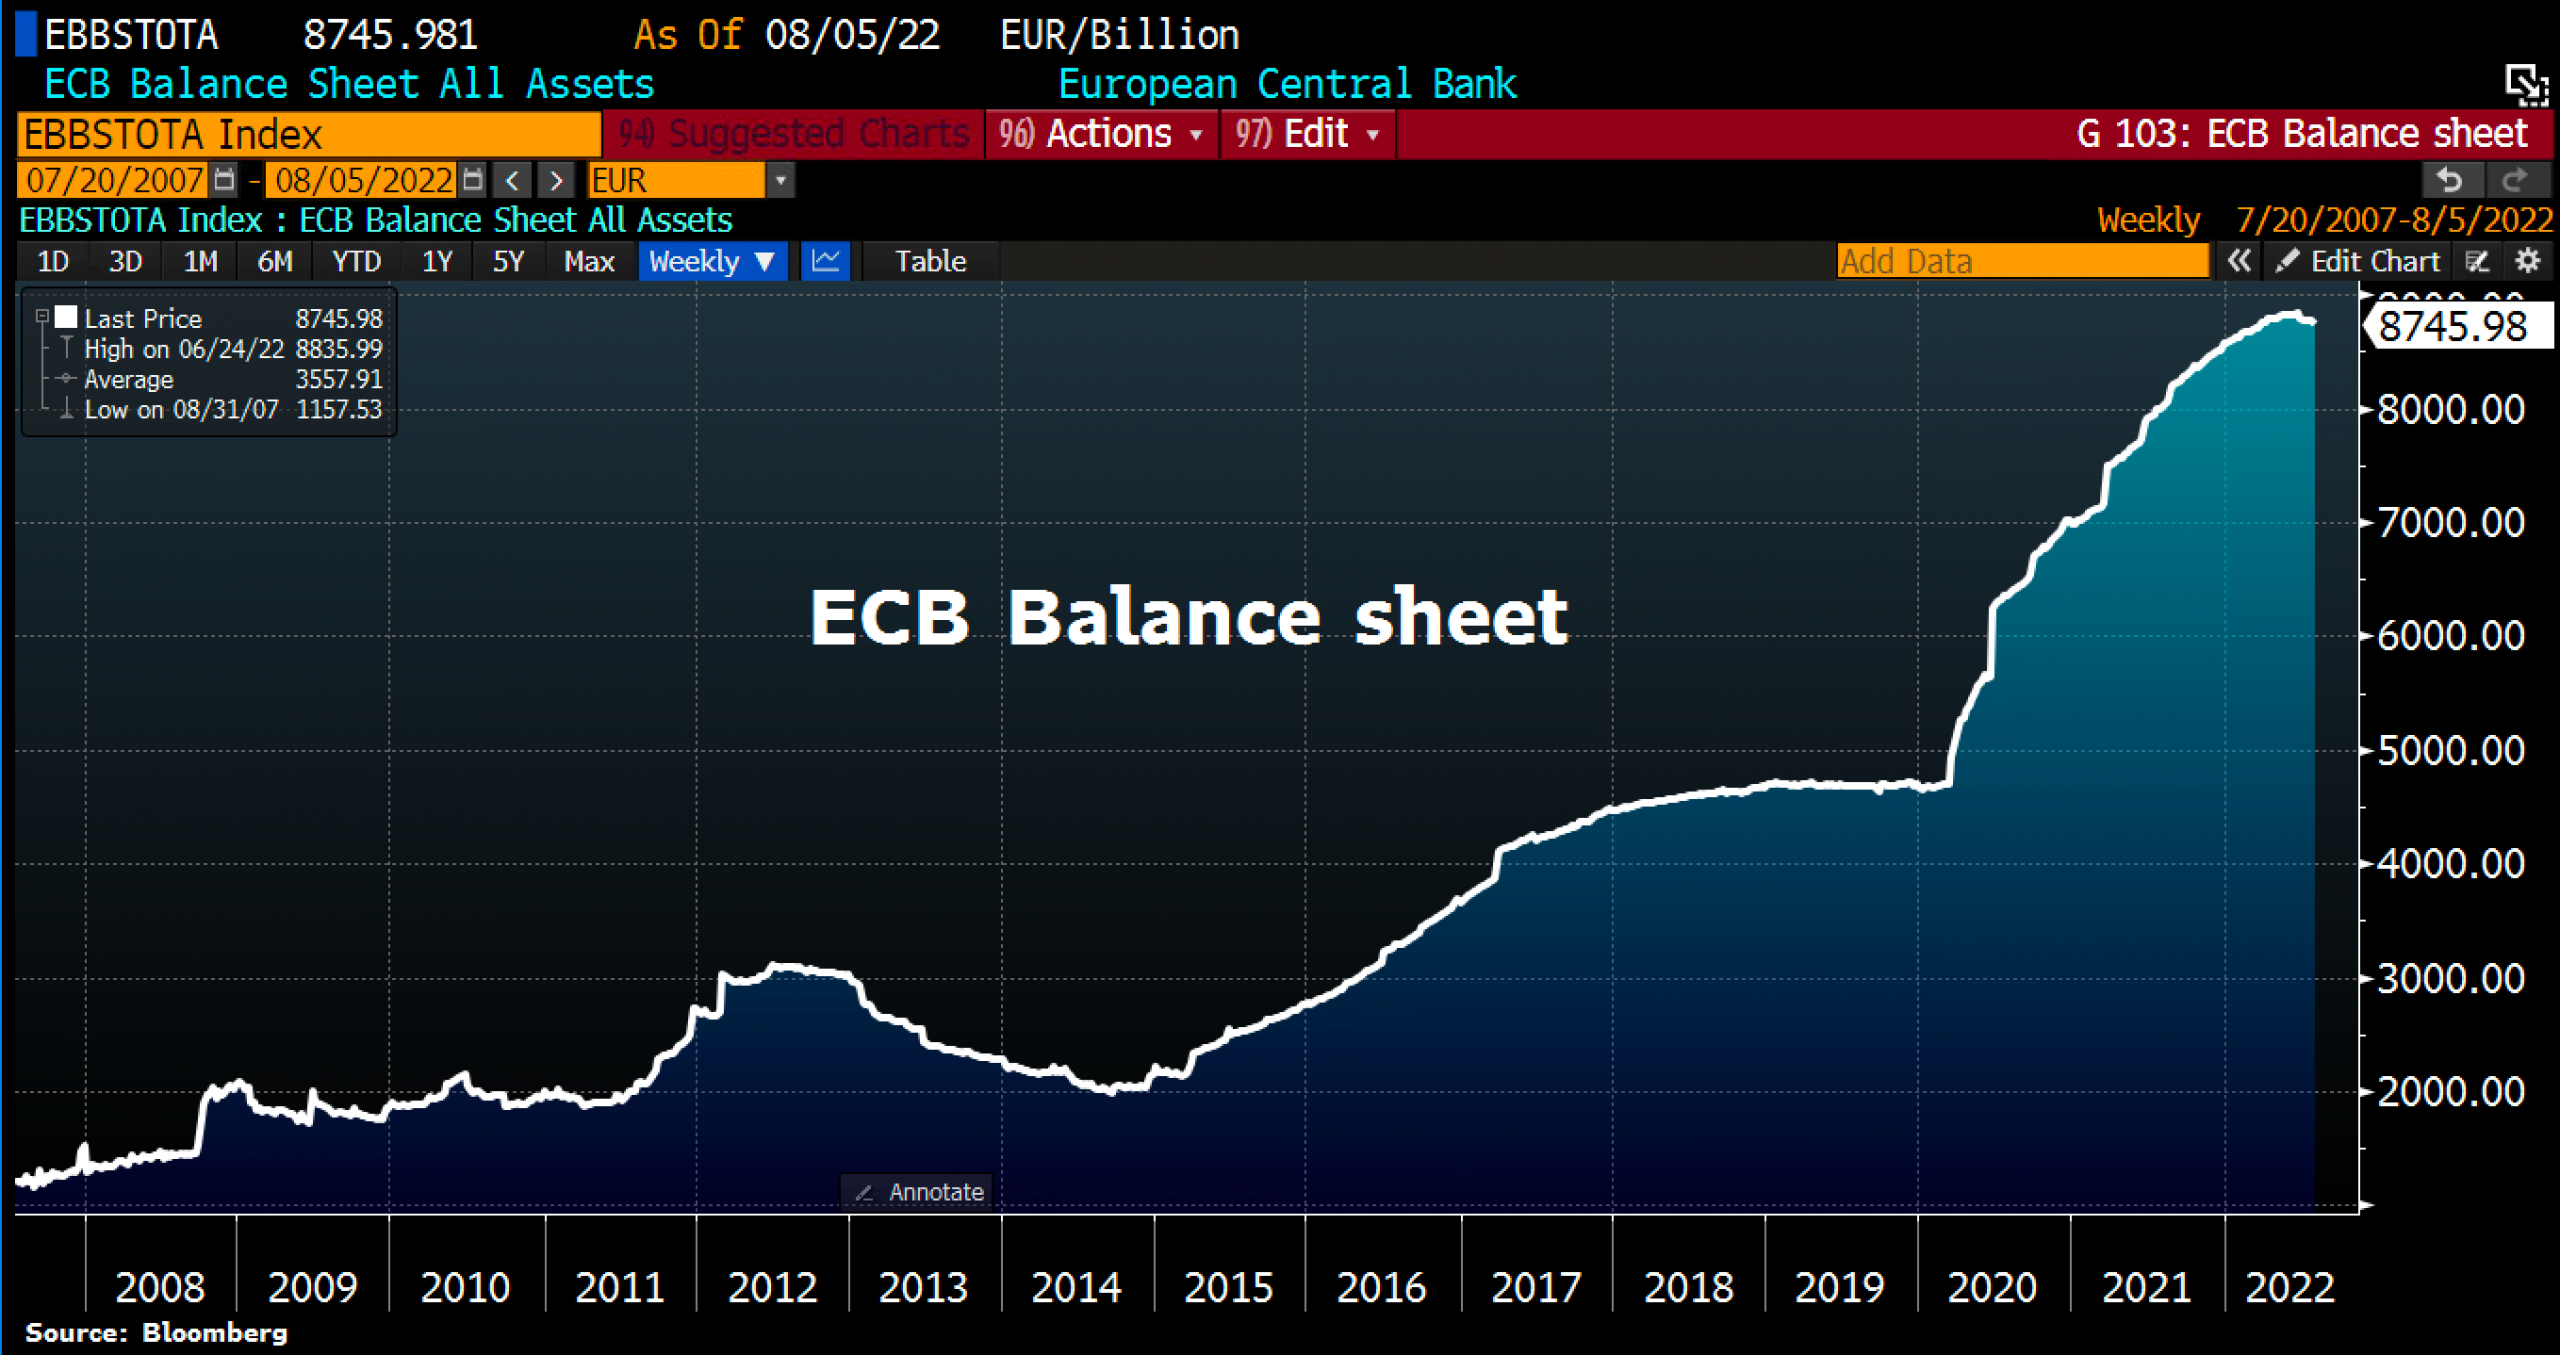
ECB balance sheet, as of August 5th, 2022. ©Holger Zschaepitz
The central bank’s balance sheet is also shrinking in the eurozone. The week before last, the ECB announced the fifth decline in six weeks. Overall, total assets fell by a further 18.5 billion EUR to 8,746 billion EUR, and are now just under 90 billion EUR below their all-time high.
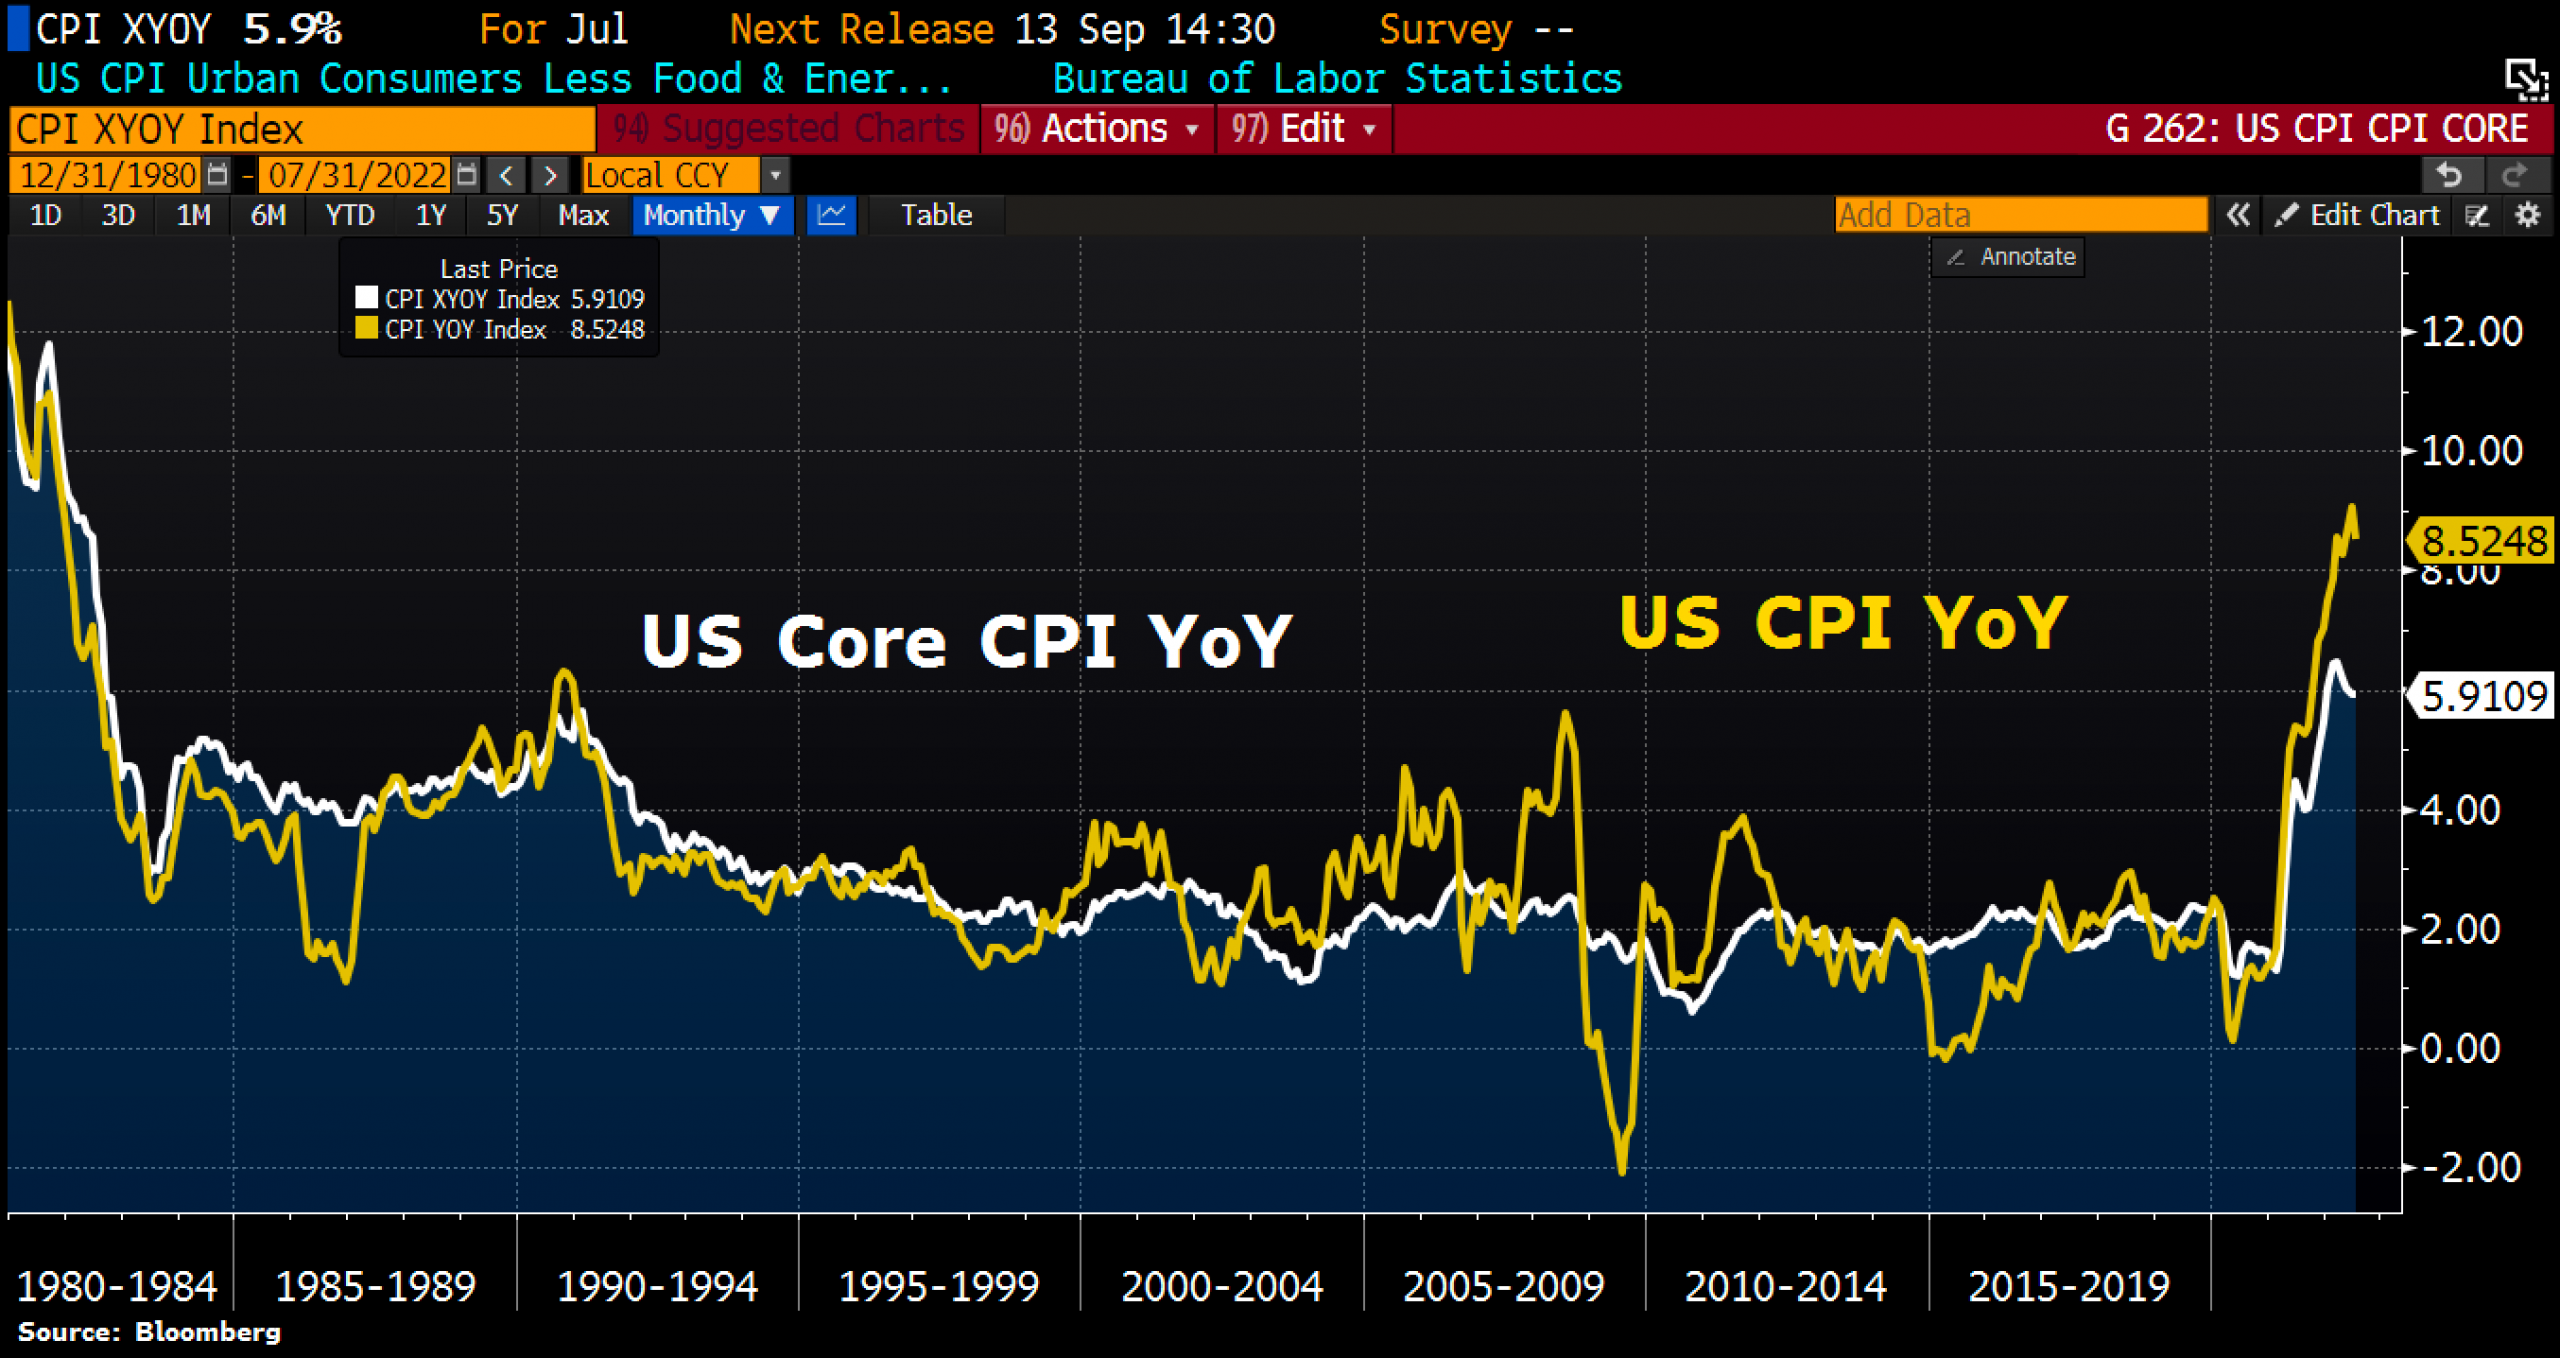
U.S. inflation, as of August 10th, 2022. ©Holger Zschaepitz
At the same time, there are increasing signs that inflation may have peaked. For example, U.S. overall consumer prices rose 8.5% year-over-year in July, but were unchanged month-over-month. Of course, these are embellished baskets and the stabilization at a high level is primarily due to a weaker oil price. Nevertheless, the stock markets received the figures bullishly.
Overall, we must continue to assume for the time being that the current recovery is merely a bear market rally. Nevertheless, fiscal stimulus in the U.S. could at least halfway stabilize the markets over the next three months. But there is still no reason to significantly increase exposure to the markets again.
Conclusion: Bitcoin – Recovery reaches first price target
Our assumption of a “relief rally in the summer?” came at exactly the right time four weeks ago, because bitcoin was able to stage a significant rally sine then. Trading around 18,900 USD back then and how sitting around 24,000 USD represents a gain of 27%. As well, our first price target of 25,000 USD has been hit.
While optimism has now returned to the stock markets, fear and skepticism are still rather high in the crypto sector. The path of greatest pain therefore continues to lead upwards in the crypto sector. Our next price target for bitcoin is the 23.6% retracement around 29,725 USD. And at the round psychological number of 30,000 USD, we also expect a reunion with the falling 200-day moving average line at some point. Nevertheless, the end of the crypto winter cannot be proclaimed yet.
Analysis sponsored and initially published on August 11th, 2022, by www.celticgold.eu. Translated into English and partially updated on August 15th, 2022.
Feel free to join us in our free Telegram channel for daily real time data and a great community. If you like to get regular updates on our gold model, precious metals, commodities, and cryptocurrencies you can also subscribe to our free newsletter.
Disclosure:
This article and the content are for informational purposes only and do not contain investment advice or recommendations. Every investment and trading move involves risk, and readers should conduct their own research when making a decision. The views, thoughts and opinions expressed here are the author’s alone. They do not necessarily reflect or represent the views and opinions of Midas Touch Consulting.

