


Gold – Close to the edge
In our last in-depth gold analysis we had been optimistically forecasting a recovery and summer rally for the gold price. And indeed, from its low at 1,680 USD gold rallied to 1,808 USD within less than three weeks. However, since mid of August gold came down hard again and is now training just slightly above 1,700 USD. Gold – Close to the edge.
Review
Although gold prices have held up much better against the US-Dollar (-6.74%) and especially against the Euro (+5.83%) than almost all other asset classes so far this year, investors’ nerves have also been strained here. While official inflation rates shot up to record highs, the gold market has instead seen first euphoria, then sheer panic and finally a disappointing summer rally over the past eight months.
The first three months, however, brought an attack on the all-time high with a top at 2,070 USD. From mid-March, though, gold bears gradually took control again and pushed prices down mercilessly in the wake of the crashing financial markets. Only at a low of 1,680 USD on July 21st (= a discount of almost 400 USD from the high on March 8th) the gold bear temporarily disappeared after a four and a half months assault.
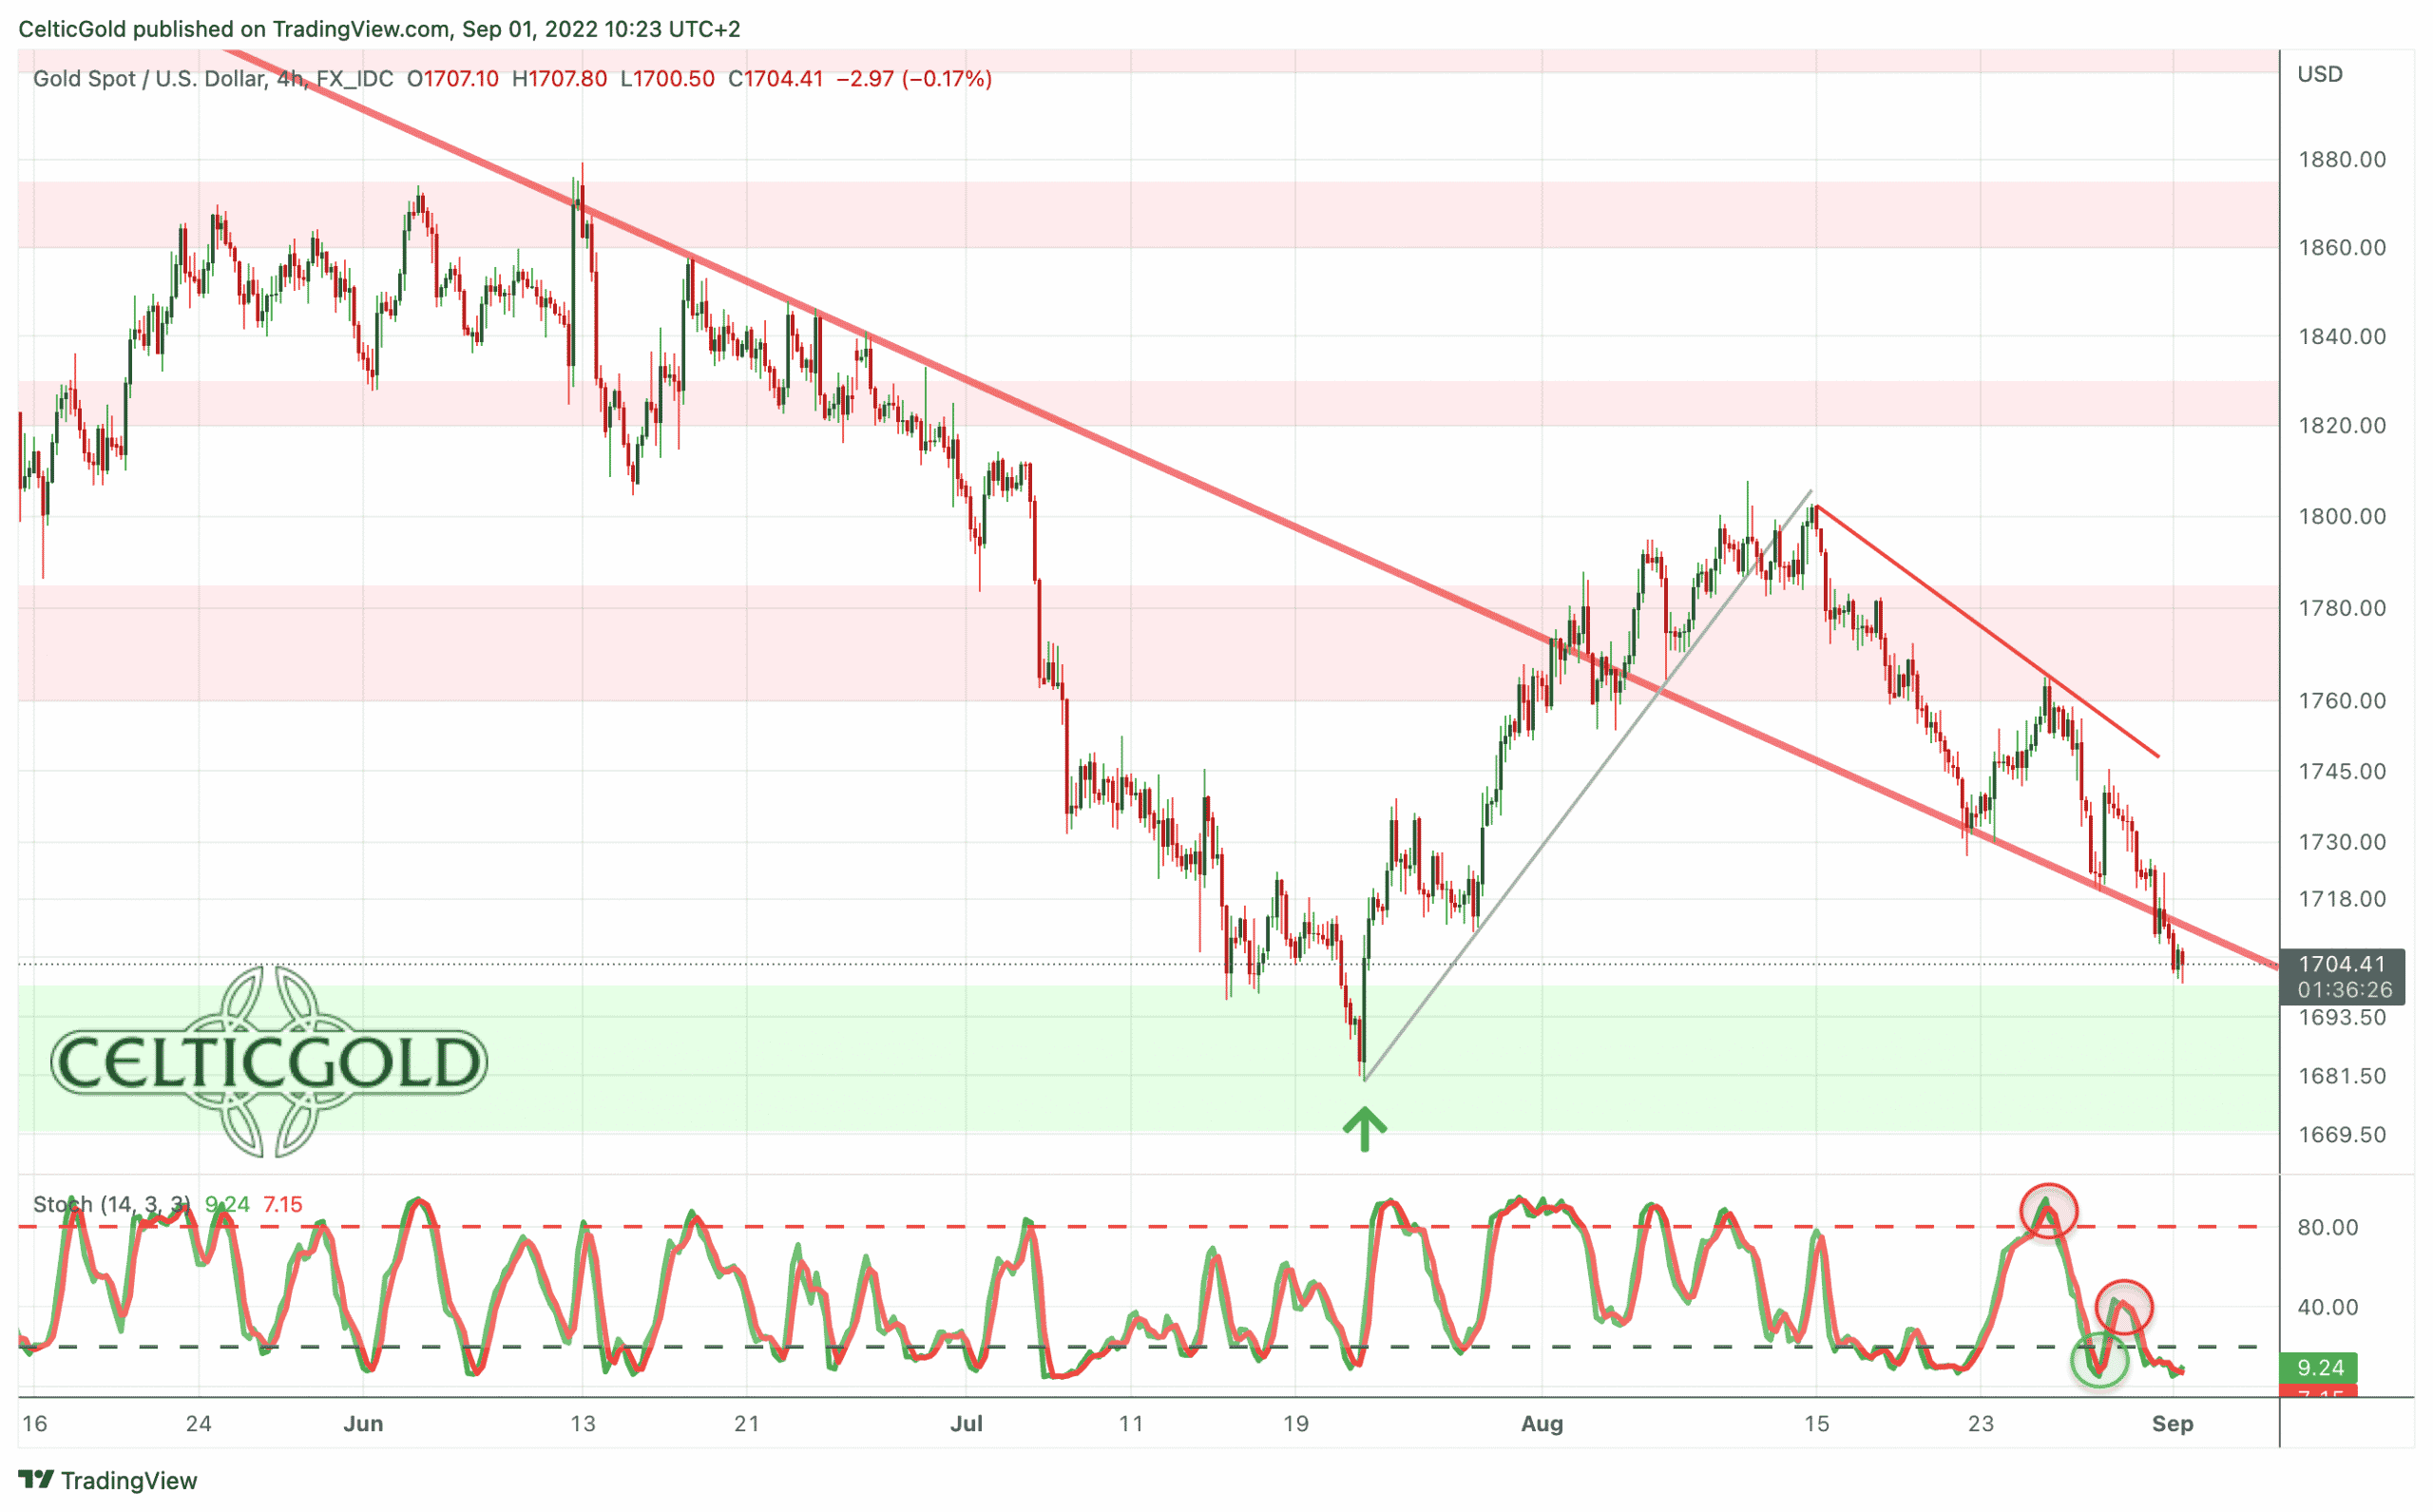
Gold in US dollars, 4-hour chart from September 1st, 2022. Source: Tradingview
Since then, a brisk recovery initially made its way back to 1,808 USD. However, this summer rally is seriously called into question with a deep pullback towards 1,702 USD as of today.
In the wake of Fed President Jerome Powell’s speech last Friday in Jackson Hole, all markets came under such significant pressure. Hence, the end of the bear-market rally in financial markets is likely in place.
Gold prices also had to let go again and trading at a five-week low. Thus, the threat of dropping below the extremely important support at 1,680 USD is growing by the hour.
Technical Analysis: Gold in US-Dollar
Weekly Chart – Back below the upper edge of the 2-year up-trend channel
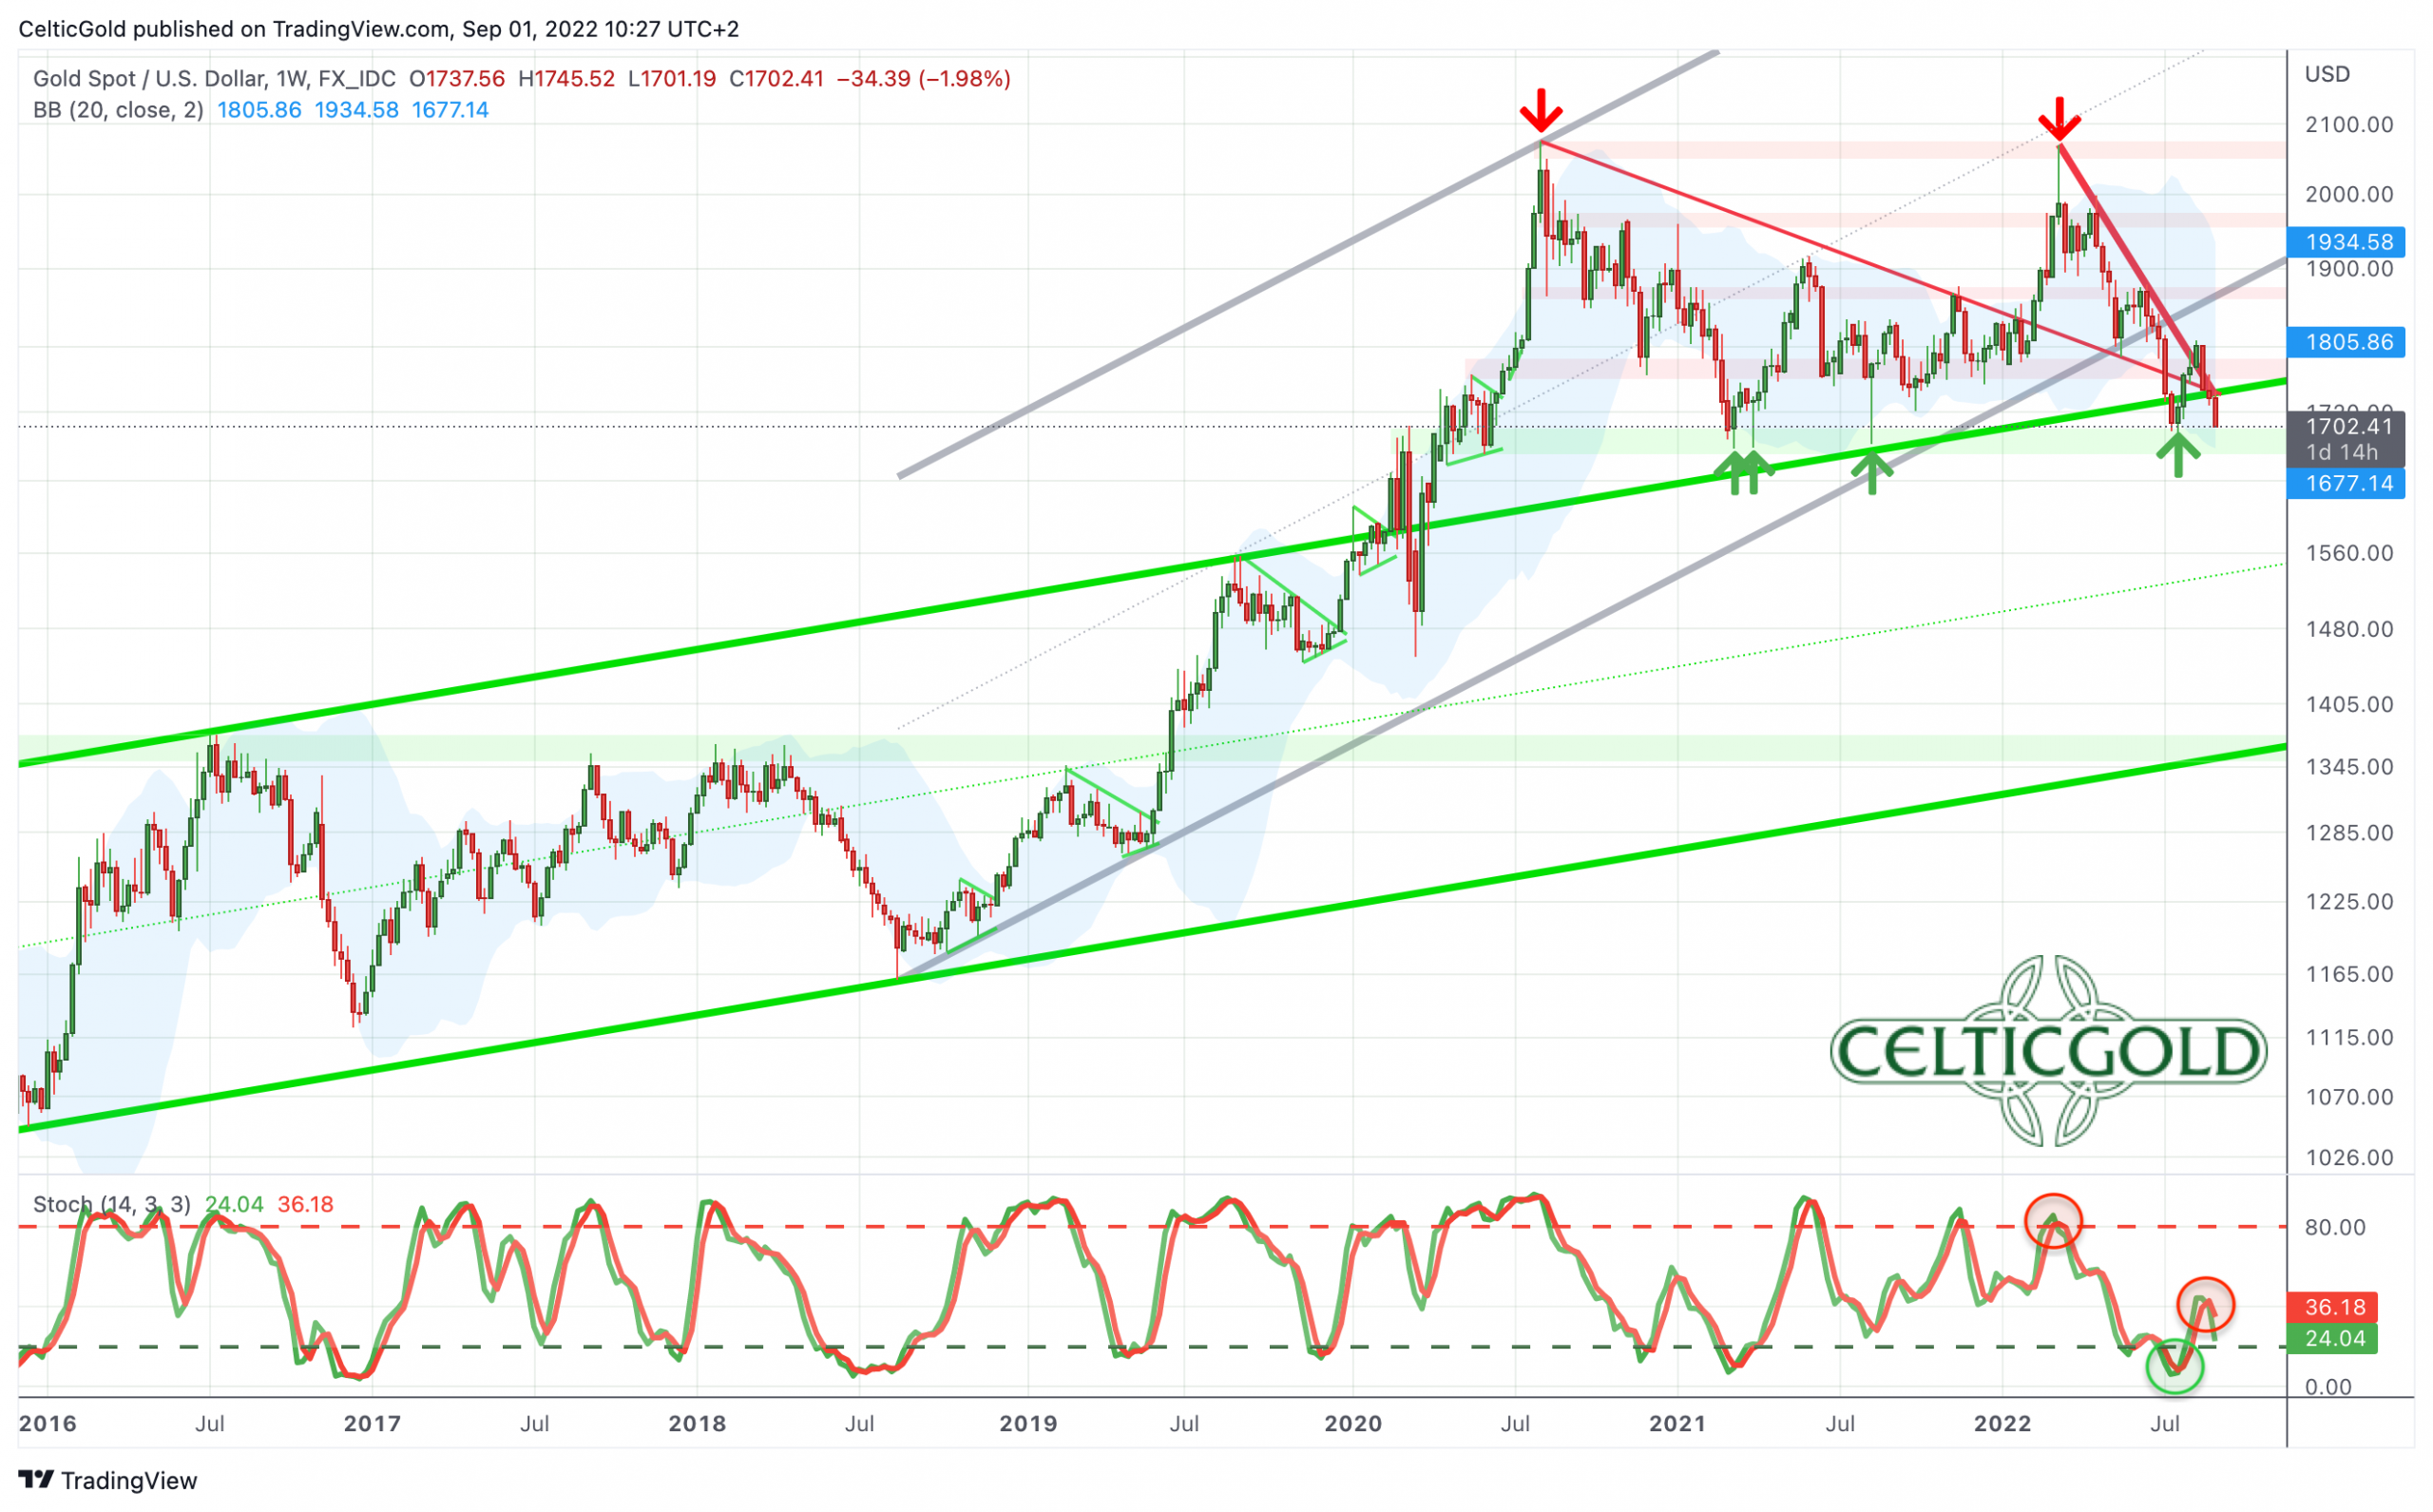
Gold in US-Dollars, weekly chart as of September 1st, 2022. Source: Tradingview
On the weekly chart, gold managed to catch a bid just below the upper edge of the light green uptrend channel five and a half weeks ago. This fourth low around 1,680 USD, in conjunction with a strongly oversold condition, provided a quick bounce in the order of +7.55%. However, at a high of 1,808 USD the summer rally did not run very far and did not even reach the 38.2% retracement (1,820 USD) of the entire correction wave down since March 7th. The promising buy signal from the stochastic oscillator was quickly lost again due to the weak price performance since August 10th.
Thus, the situation on the weekly chart has deteriorated significantly. If gold bulls could stabilize price action around the upper edge of the light green up-trend channel once again, a second recovery wave towards the middle Bollinger Band (1,819 USD) and higher is still a possibility. But as prices are already flirting with the round psychological number of 1,700 USD, a fifth test of 1,680 USD seems to be rather imminent and would further soften this support.
Hence, a breakdown below this extremely important support is very likely after all. In this case, gold could quickly plunge lower and prices around 1,625 USD would be the minimum target. However, since a break below 1,680 USD would also mean a clear dive back into the old uptrend channel, a test of the bottom of the channel (currently around 1,350 USD) would be the “worst case” scenario.
Overall, the weekly chart is neutral, but a directional decision should crystallize over the coming weeks. As long as gold can defend the zone between 1,700 and 1,720 USD, there is a chance of a continuation of the summer rally. However, below 1,700 USD at the latest, the path is clearly pointing to the downside and gold is likely to sail further south in the fall together with the presumably collapsing financial markets.
Daily Chart – 130 USD below the 200-day moving average
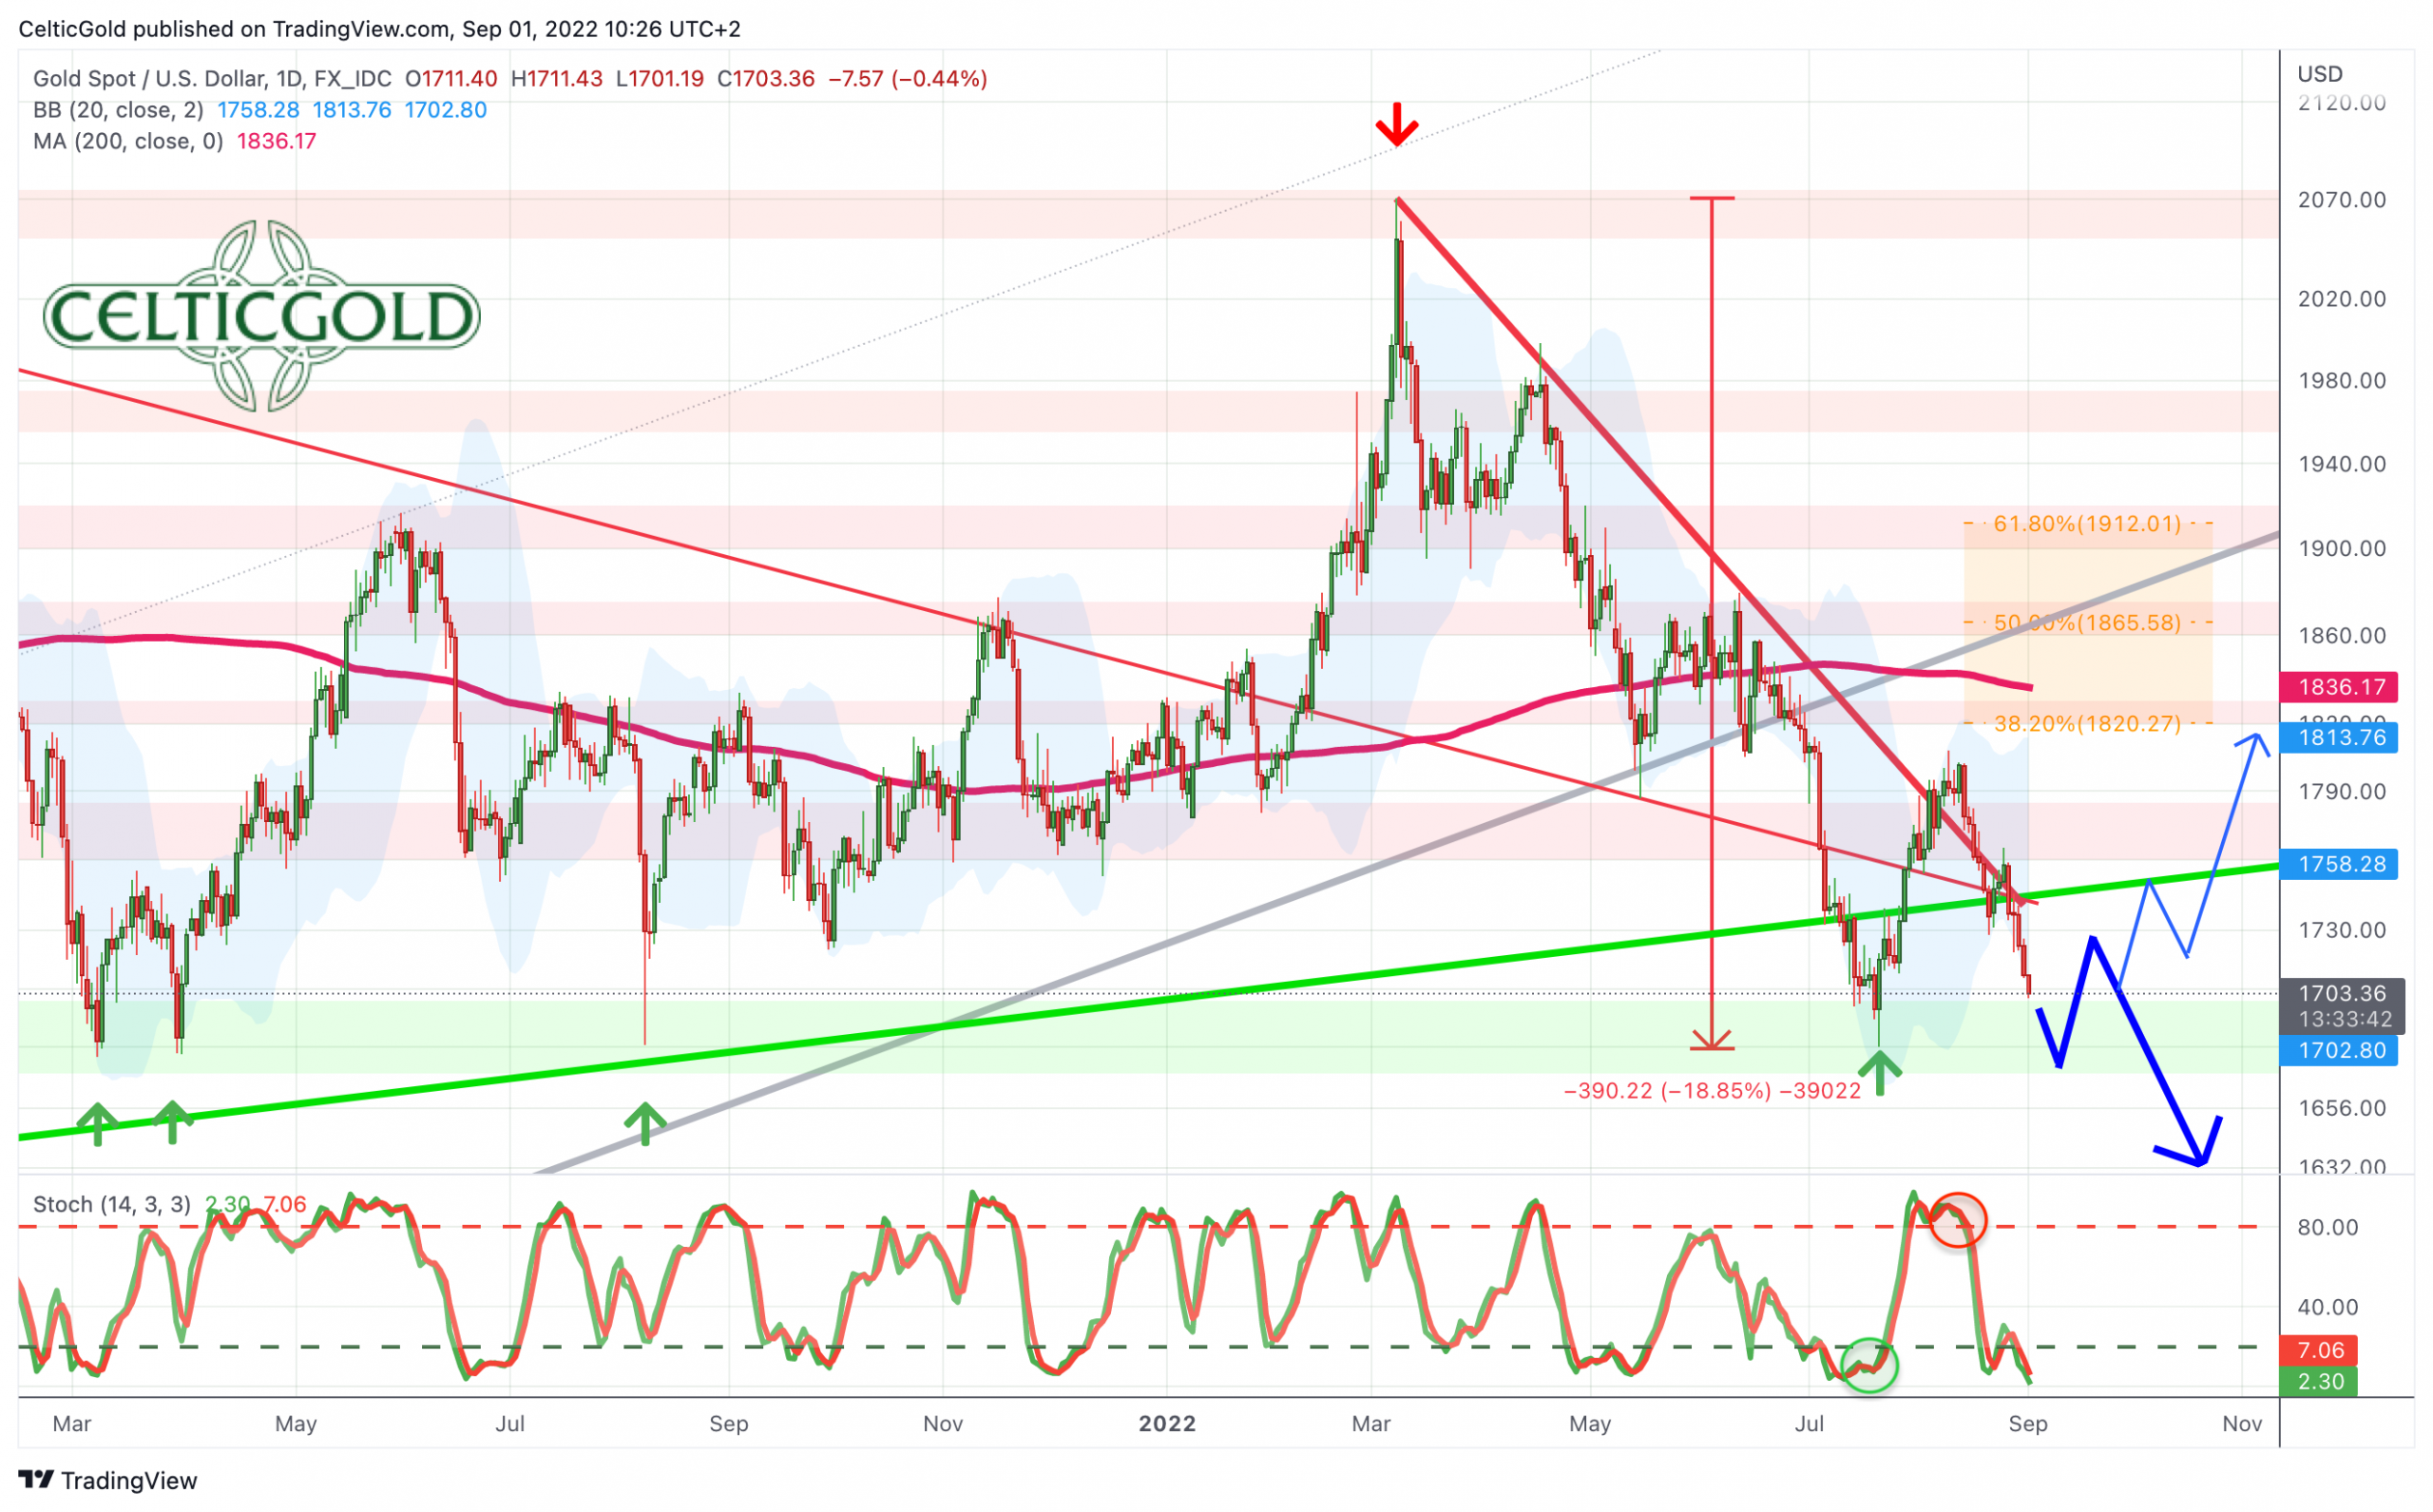
Gold in US-Dollars, daily chart as of September 1st, 2022. Source: Tradingview
On its daily chart, gold is currently trading 130 USD below its slightly falling 200-day line (USD 1,835). This classic moving average would have been predestined as the minimum target of the summer rally. So far, gold has not made it back to that line in the sand. Instead, bulls already ran out of steam at 1,808 USD and the deep pullback towards 1,713 USD rather confirms the bearish setup.
At least, the daily stochastic oscillator is extremely oversold. But markets can remain oversold for much longer than most investors can imagine! At the moment, the lower Bollinger Band (USD 1,705) is bending to the downside and hence not offering good support.
All in all, the daily chart is bearish and gold looks very weak. Given the oversold stochastic and the numerous support between USD 1,680 and USD 1,700, a continuation of the recovery towards USD 1,835 plus X still has a chance for now. Nevertheless, the dangers on the downside must be taken very seriously in view of the unstable overall situation in financial markets.
Commitments of Traders for Gold – Close to the edge
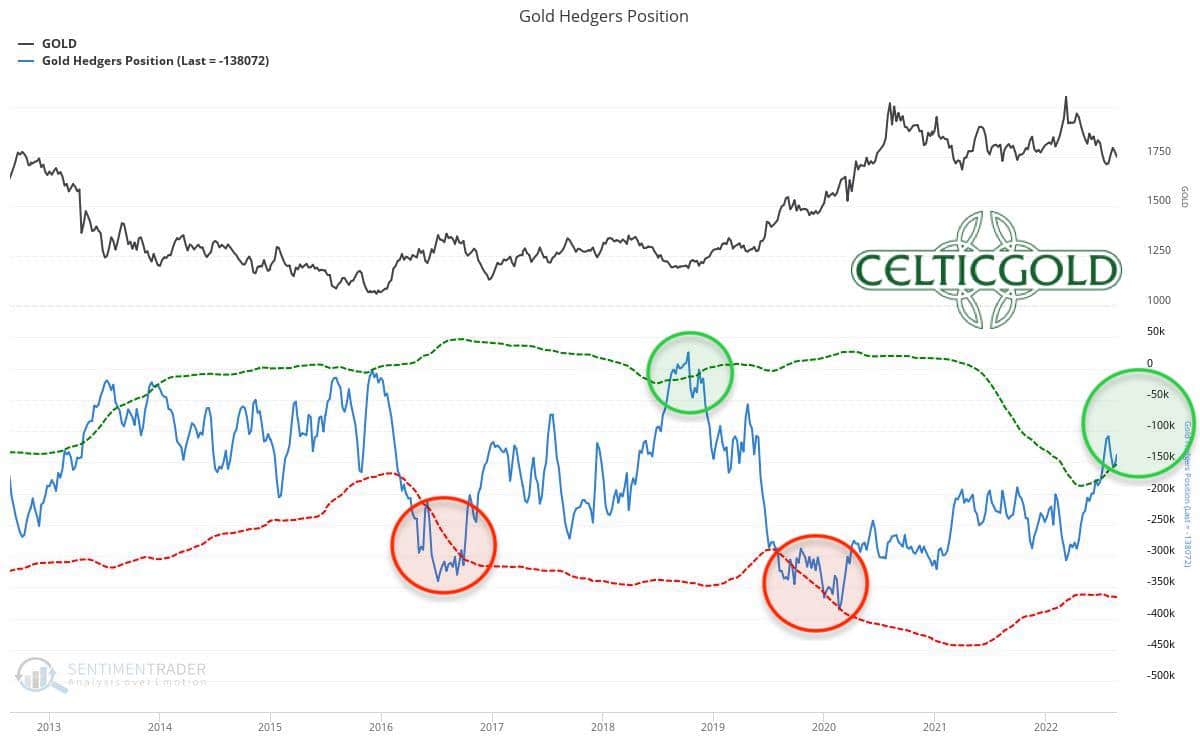
Commitments of Traders for Gold as of August 27th, 2022. Source: Sentimentrader
The cumulative net short position of commercial market participants has recently reduced slightly again and stood at 138,072 short sold contracts as of Tuesday, August 27th. The commercial net short position is thus again close to the threshold of 100,000 short contracts, at which one can speak of a rather bullish CoT report for the gold market.
In summary, the CoT report is to be classified as cautiously bullish.
Sentiment for Gold – Close to the edge
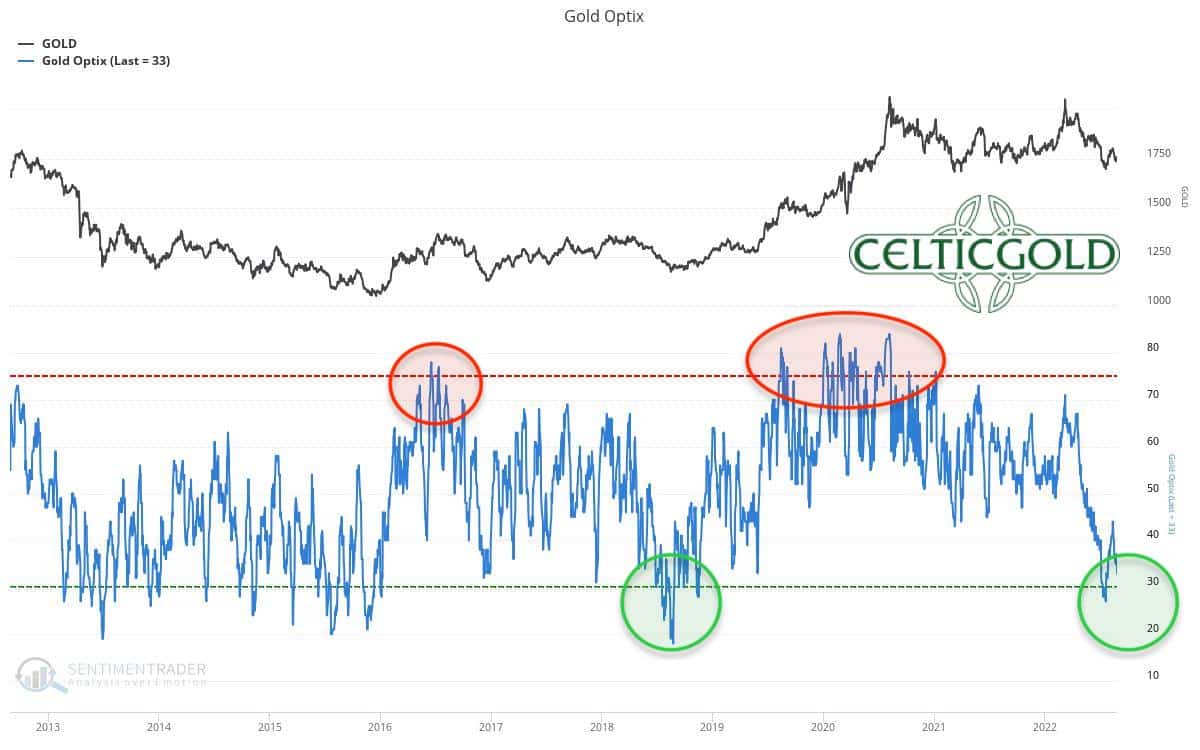
Sentiment Optix for Gold as of August 27th, 2022. Source: Sentimentrader
In July, gold´s sentiment had fallen to its lowest level in four years. The interim recovery led to an initial relief. Now, sentiment analysis is again measuring relatively high levels of pessimism, pointing to a contrarian opportunity in the bigger picture. However, a bottoming process may well take some time, similar to the fall of 2018. Back then, high pessimism levels occurred repeatedly over a period of almost five and a half months. This bombed-out sentiment then laid the foundation for the fulminant rise from 1,160 USD to 2,070 USD within the following two years.
Overall, the sentiment traffic light is green and continues to provide a contrarian buy signal!
Seasonality for Gold – Close to the edge
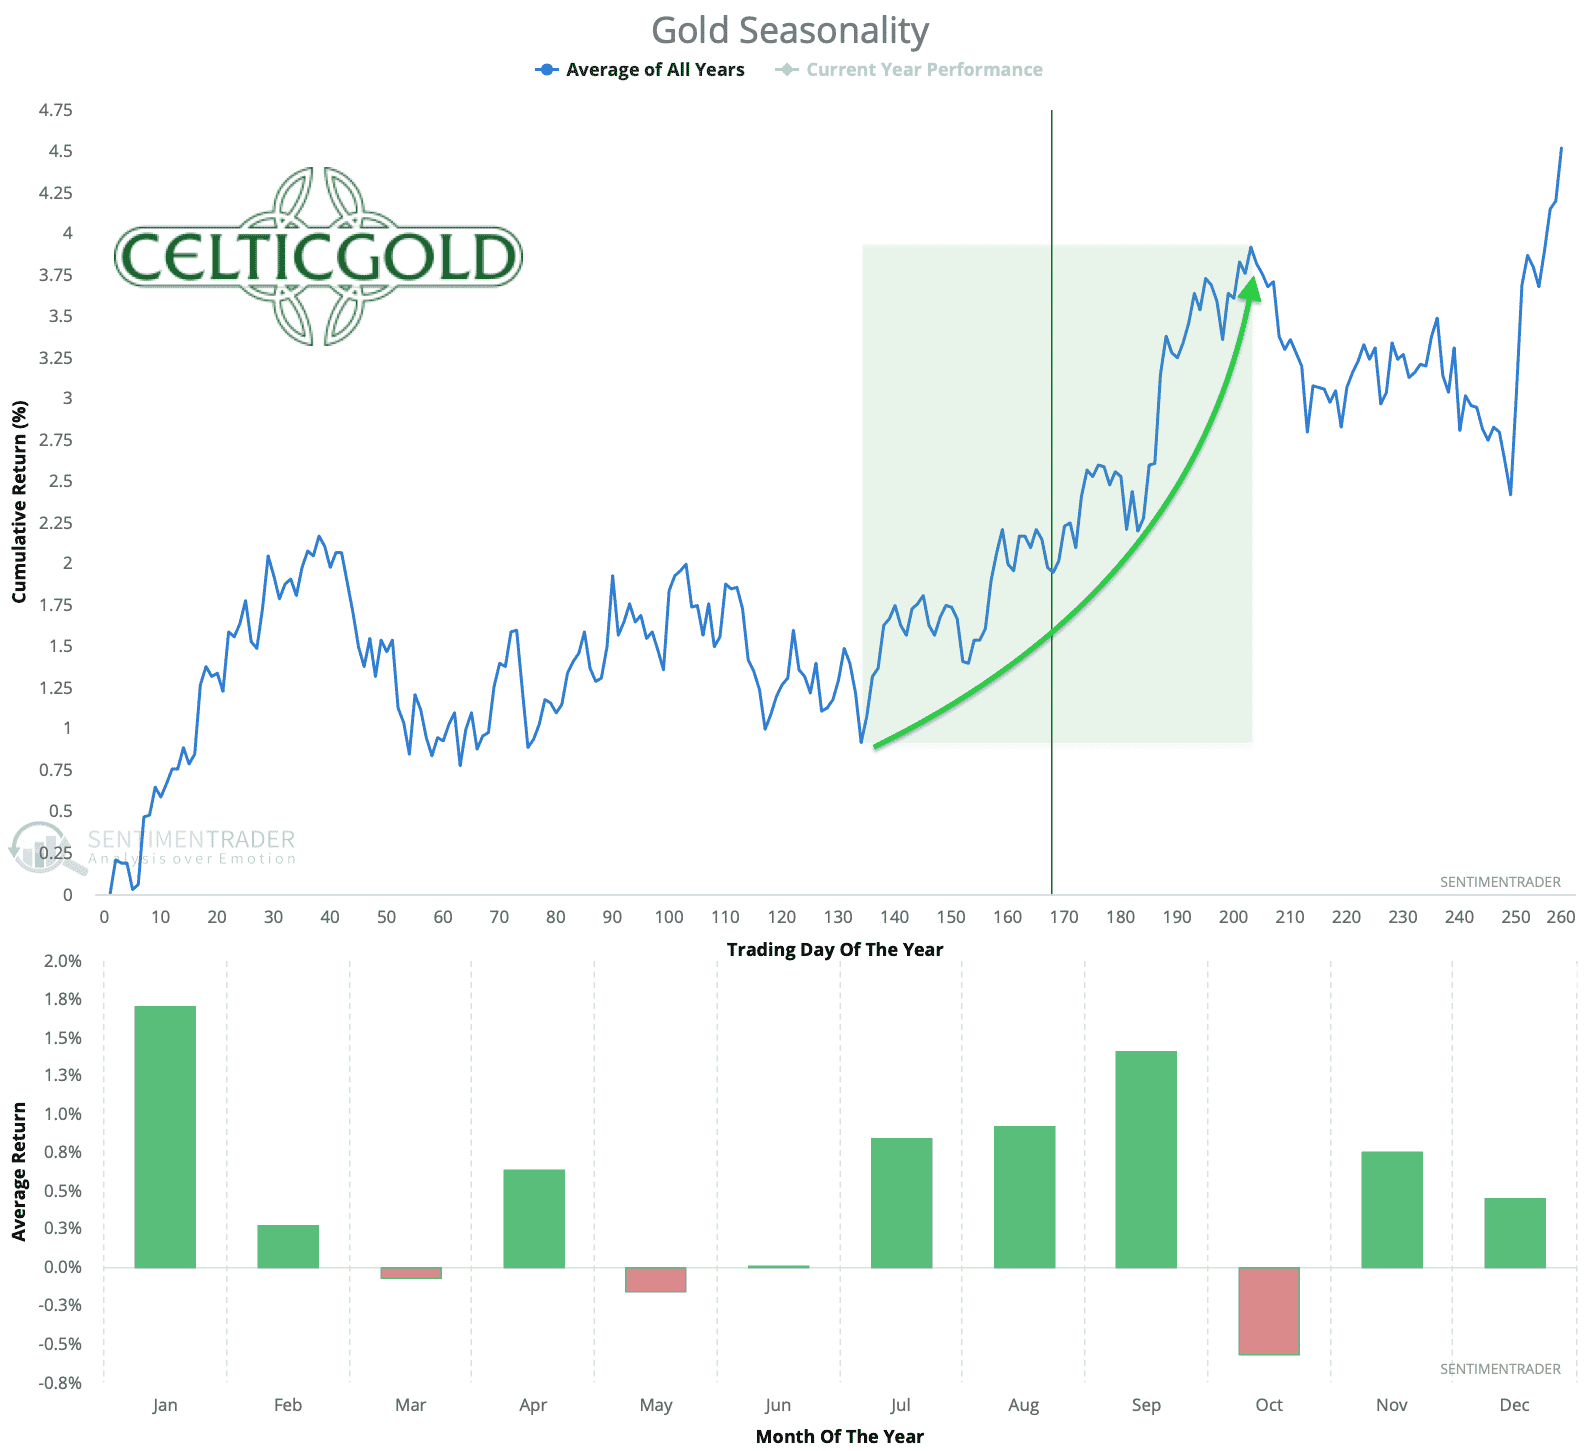
Seasonality for Gold over the last 53-years as of August 27th, 2022. Source: Seasonax
From a seasonal perspective, gold is currently right in the middle of its best phase of the year. According to the statistics of the last 54 years, this favorable timeframe typically extends from the beginning of July to the beginning of October. Accordingly, the seasonal component would still be very supportive for the next four to six weeks.
Seasonality for gold and silver is still strongly bullish until early October.
Macro update: Recession and stagflation
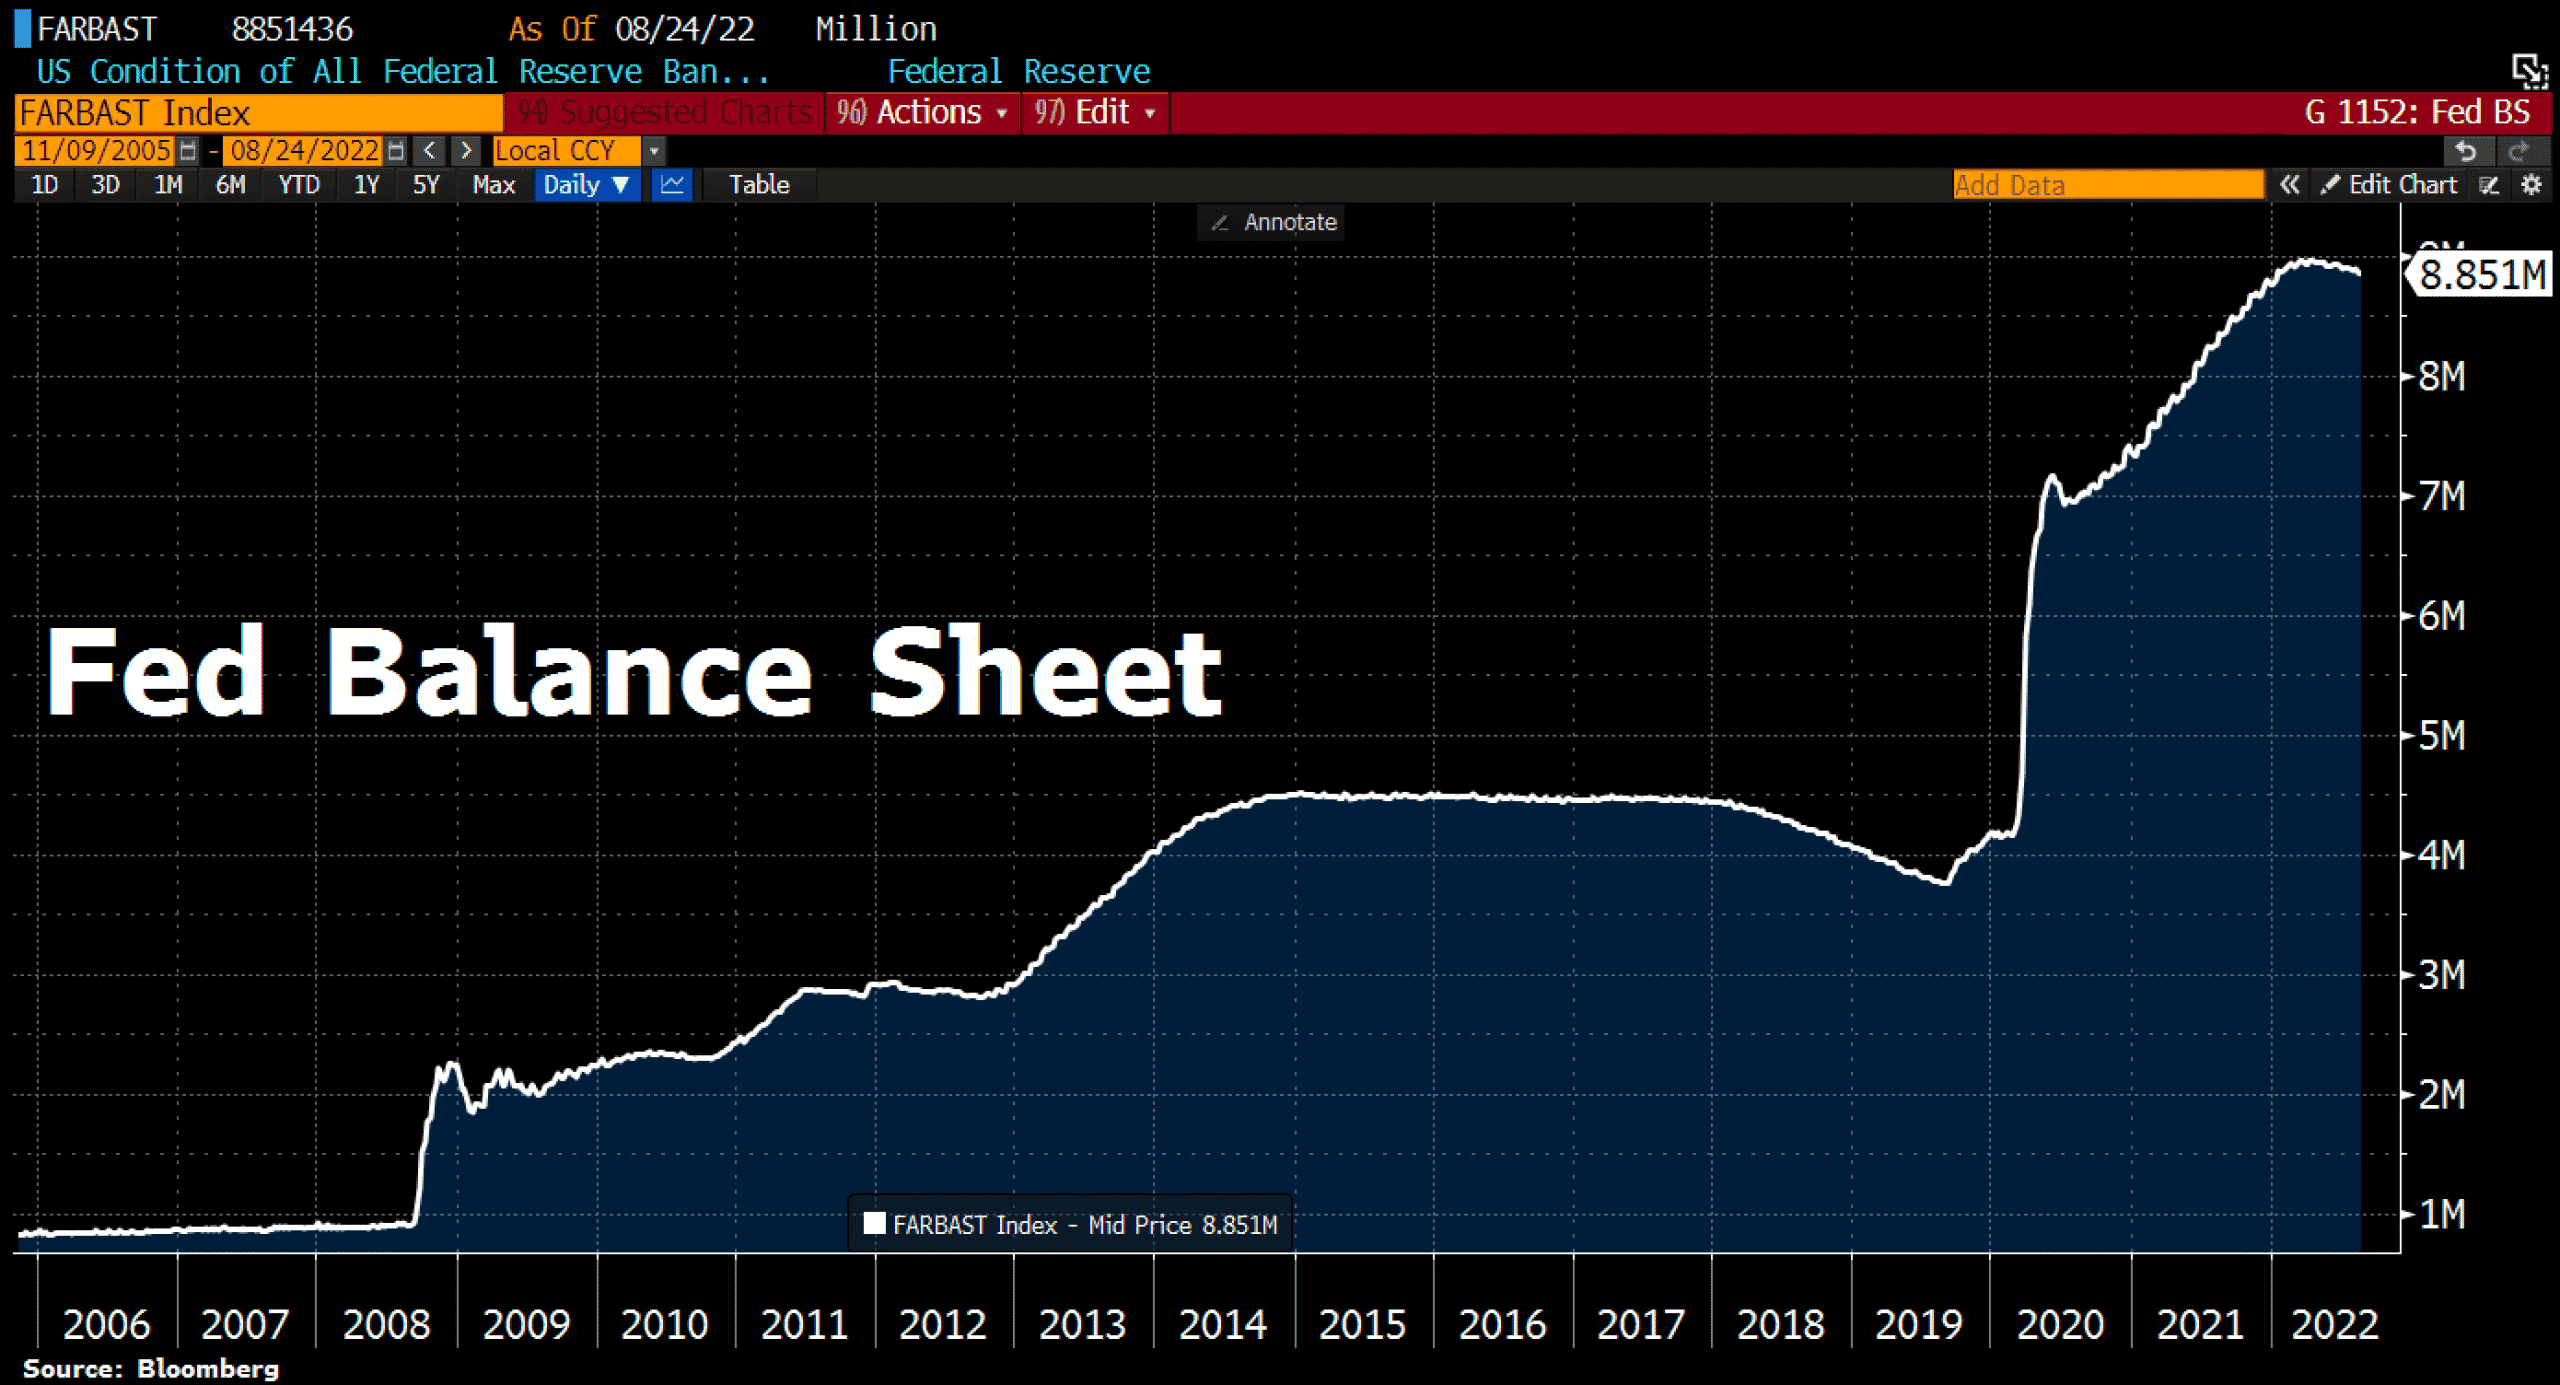
FED Balance Sheet Total as of August 24th , 2022, ©Holger Zschaepitz
Last Friday, U.S. Federal Reserve Chairman Jerome Powell announced a tough stance on inflation in his speech at the key central bankers’ meeting in Jackson Hole. He signaled new rate hikes and prepared investors for a weaker economy. In reality, however, shrinking the Fed’s balance sheet does not appear to be that easy. Last week, for example, the Fed’s total assets rose by 1.7 billion USD to 8,851.4 billion USD. In retrospect, total assets have been reduced by just 114 billion USD, or 1.3%, since the start of quantitative tightening.
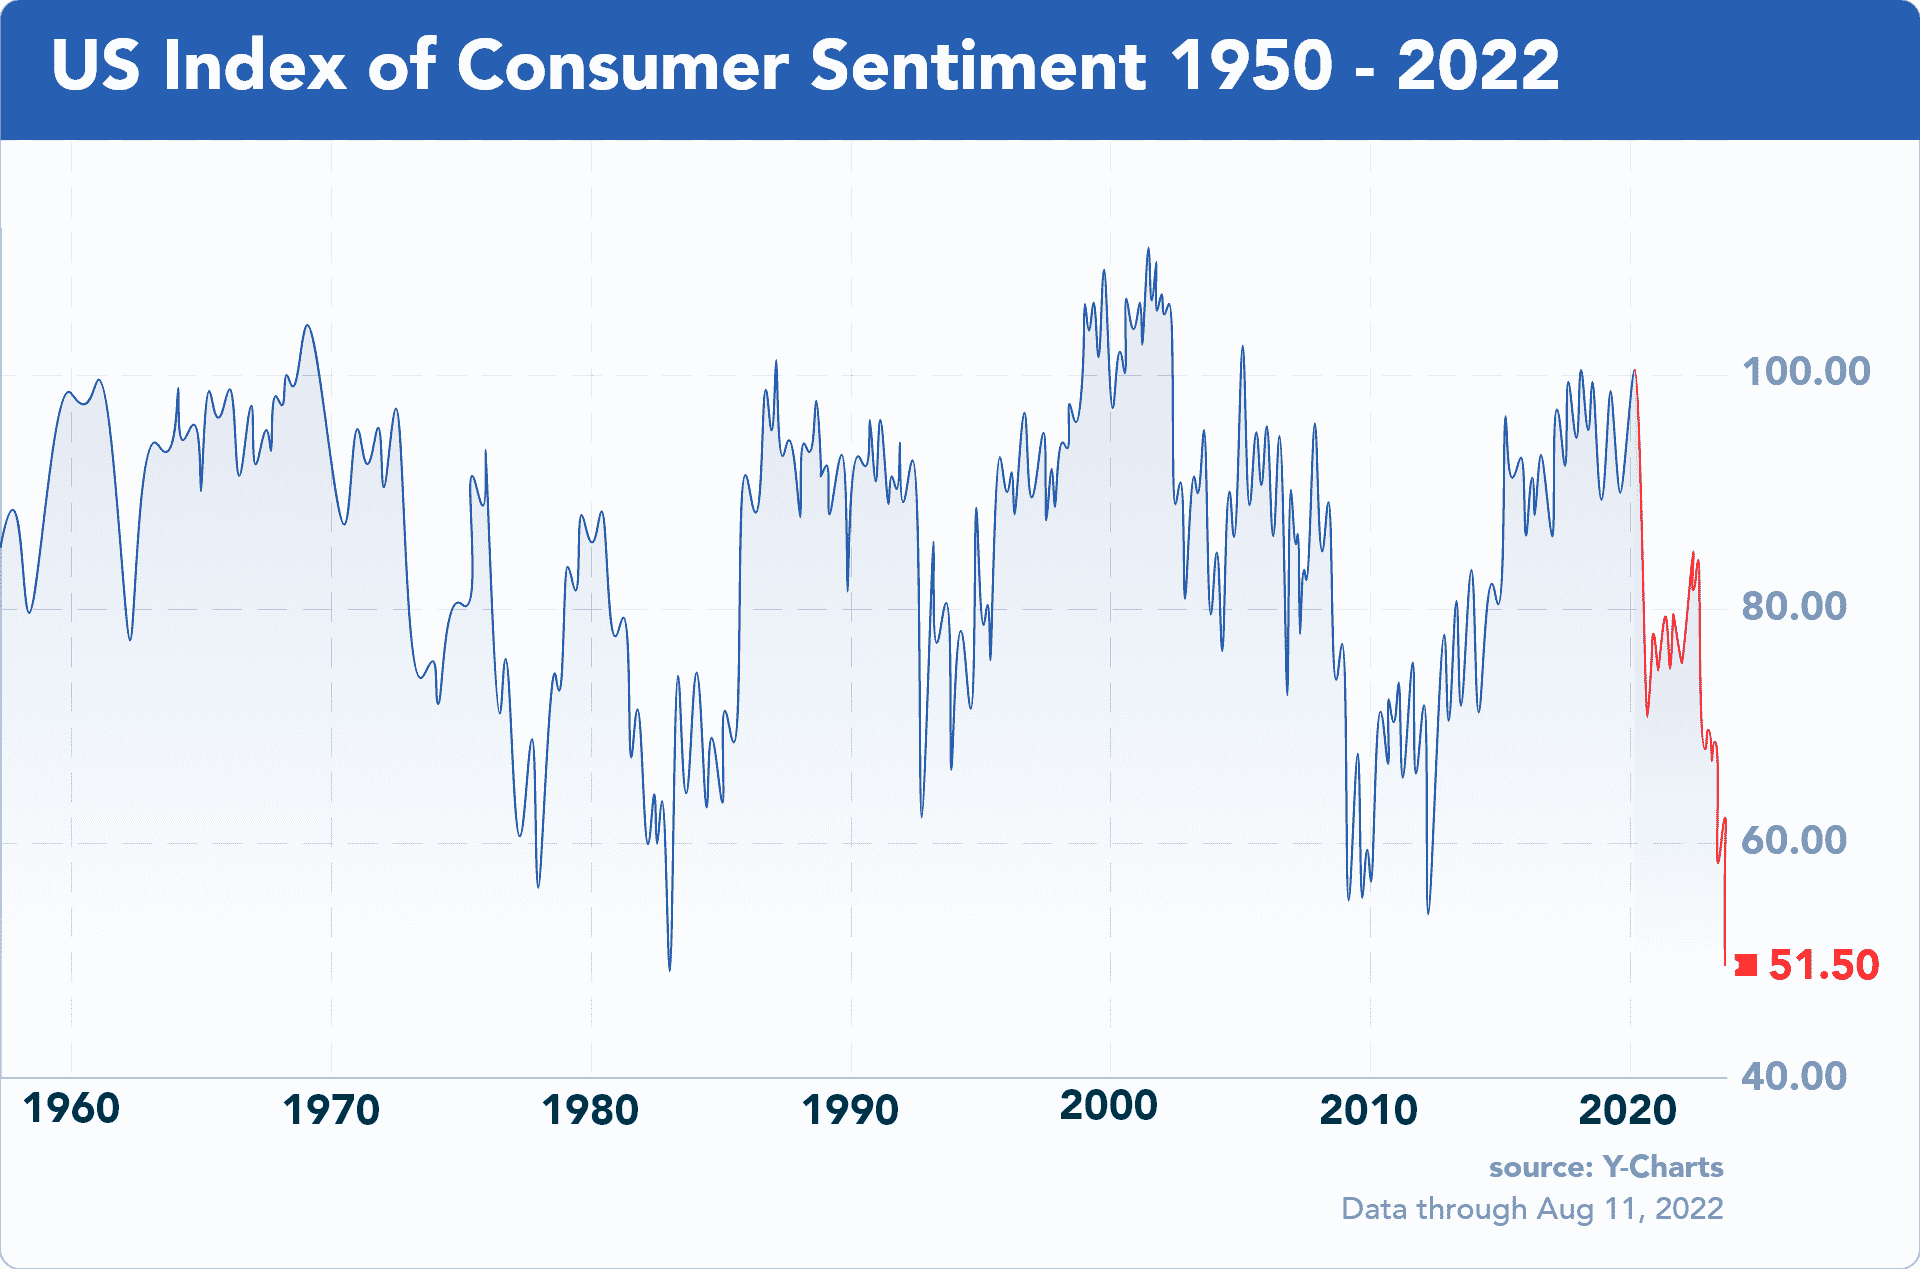
US-Consumer Sentiment as of August 11th, 2022. ©Y-Charts
However, financial markets have responded to this minor reduction in the balance sheet total in recent months with a sharp correction and a bear market. Already, U.S. consumer confidence has fallen to its lowest level since the early 1980s! Likewise, CEO confidence in the U.S. has fallen to its lowest level in 14 years. Many other key data are on the verge of rolling over. A recession has already been confirmed. The only question now is how bad it will actually get.
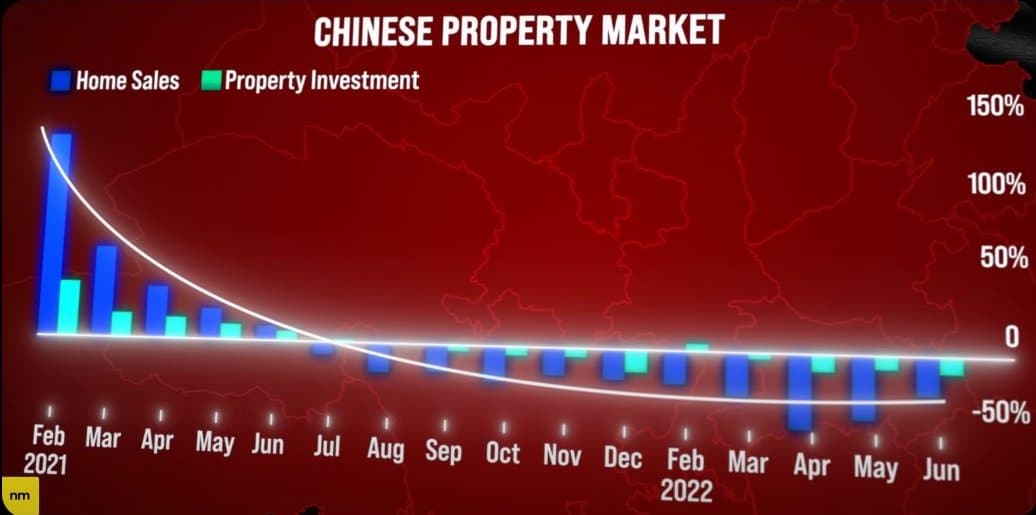
Chinese property market as of August 22nd, 2022. ©Market Sentiment
The already dramatic situation is intensified by the collapsing Chinese real estate market. The world’s largest and thus most important sector has already been under tremendous pressure for over a year and is increasingly collapsing. The total value amounts to more than 60 trillion USD, i.e. more than the entire US stock market and more than twice the US real estate market. S&P recently predicted a further decline of about 30%, which would be about 1.5 times worse than the 2008 financial crash. We had warned in detail and in good time about those consequences in the fall of 2021.
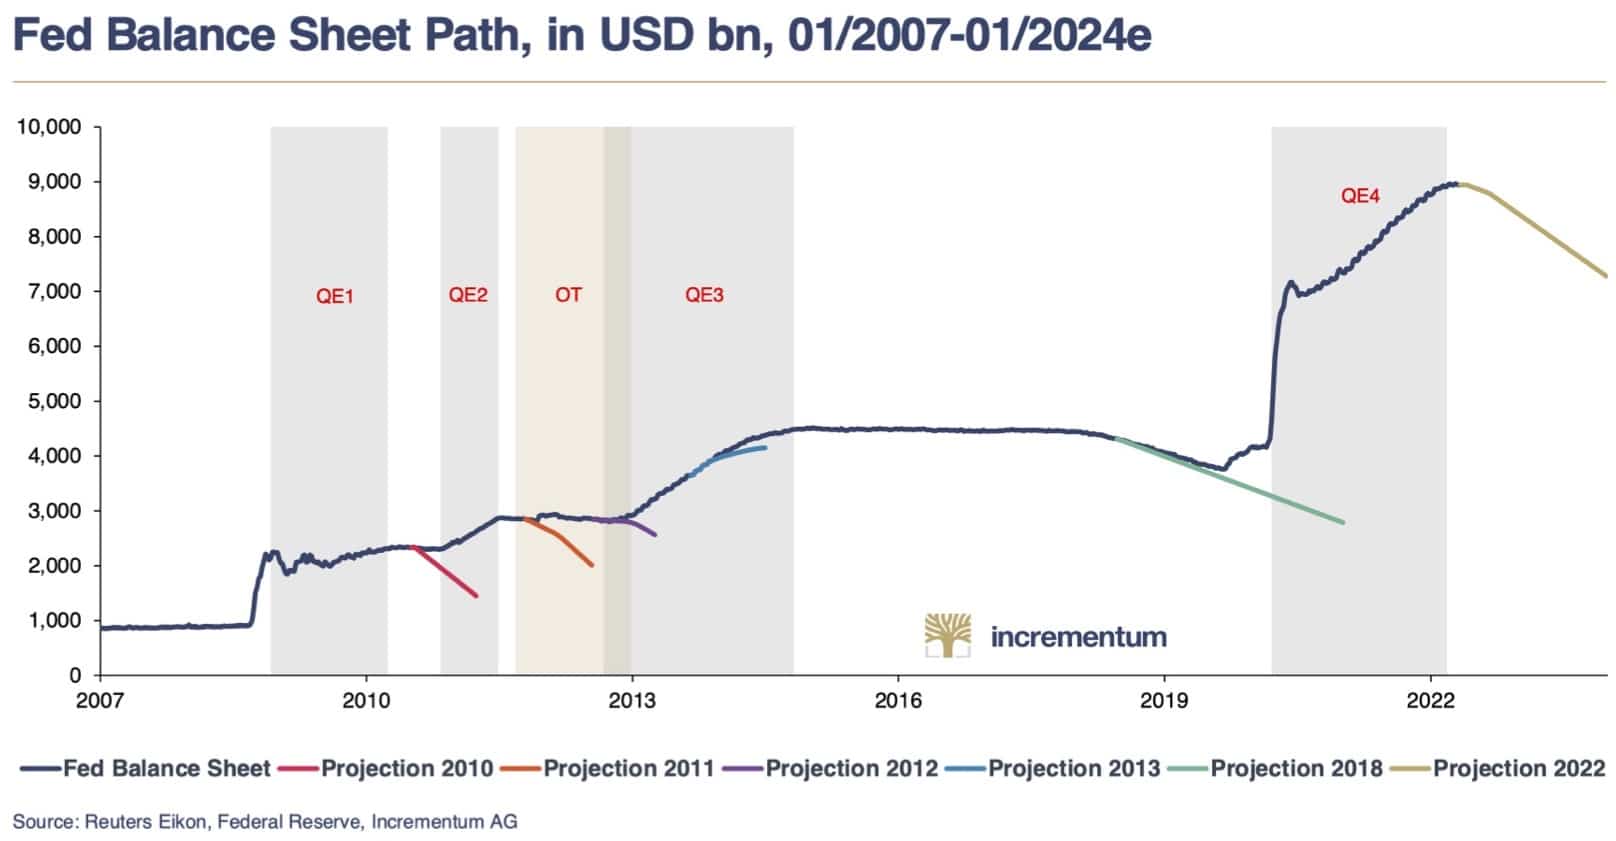
FED balance sheet path, as of August 19, 2022. ©IGWT Gold Compass, August
As a result, the Fed will not be able to follow its announced course, as it has in the past (see 2010, 2011, 2012, 2013 and 2018). Instead, the Fed will have to cut interest rates next year at the latest to prevent a complete collapse. The amount of liquidity that will then be needed to stabilize the global economy will be absolutely overwhelming, dwarfing anything that has been seen until today.
In the short term, however, the Fed will initially pursue its destructive course unflinchingly, thus further exacerbating the stagflationary environment. As a result, all market sectors will remain under considerable pressure in the coming weeks and months. We recommend absolute restraint and a consistent risk-off mentality, as well as a large portion of patience. However, as soon as the Fed will be forced to turn around due to the collapsing markets, gold will quickly bounce back and then also break out to new all-time highs.
Conclusion: Gold – Close to the edge
After a three-week summer rally of more than 125 USD, gold prices quickly fell back by more than 100 USD. Due to the restrictive U.S. Federal Reserve policy and the collapsing financial markets, the way towards south seems to be the most likely road ahead. Technically speaking, the picture is quickly deteriorating, too. Only if gold can defend the last support zone between 1,680 and 1,700 USD on a daily closing price basis, the second part of the summer rally could still start. But currently trading close to 1,705 USD, gold is practically right on the brink of the abyss as last year’s support at 1,680 USD is unlikely to hold for a fifth time! Hence, a further wave down is likely to be unleashed. The scope of a breakdown could quickly assume enormous dimensions due to a then collapsing market technique and the many stops waiting below 1,680 USD.
Overall, gold doesn’t look good here. The chance for another bounce is still there and would be typical for the season. At the same time, however, trading so close to the edge, the danger of falling into the abyss increases with each day. Therefore, the highest caution and restraint are recommended. In this difficult market environment, risk-off is your only choice! Cash is king right now! But don’t sell your physical gold. In fact, if gold were to correct even more sharply lower, it would be a great buying opportunity. Eventually, the Fed will have to turn around and print incredible amounts of new fiat money. But we’re not there yet. Alternatively (probability decreasing by the hour), gold can continue its summer rally. But to do so, it must stage a turnaround rather immediately.
Analysis initially published on August 28th, 2022, by www.celticgold.de. Translated into English and partially updated on September 1st, 2022.
Feel free to join us in our free Telegram channel for daily real time data and a great community. If you like to get regular updates on our gold model, precious metals and cryptocurrencies you can also subscribe to our free newsletter.
Disclosure: This article and the content are for informational purposes only and do not contain investment advice or recommendations. Every investment and trading move involves risk, and readers should conduct their own research when making a decision. The views, thoughts and opinions expressed here are the author’s alone. They do not necessarily reflect or represent the views and opinions of Midas Touch Consulting.

