


The Midas Touch Gold Model™ Update
As an annual routine, our dear friends from Incrementum gave us the opportunity to contribute an update on the current status of our Midas Touch Gold Model™ as well as a short to medium term outlook by Florian Grummes in their upcoming In Gold We Trust report 2023. The Midas Touch Gold Model™ Update as of May 14th, 2023.
The Midas Touch Gold Model illuminates the gold market from many different perspectives with a rational and holistic approach. It convinces with its versatility and its quantitative measurability. While rooted in extensive data, the model excels at distilling a comprehensive in-depths analysis into a succinct and lucid table, ultimately arriving at a decisive and clear conclusion.
The markets are the same now as they were five to ten years ago because they keep changing – just like they did then. – Ed Seykota
Gold – The big picture
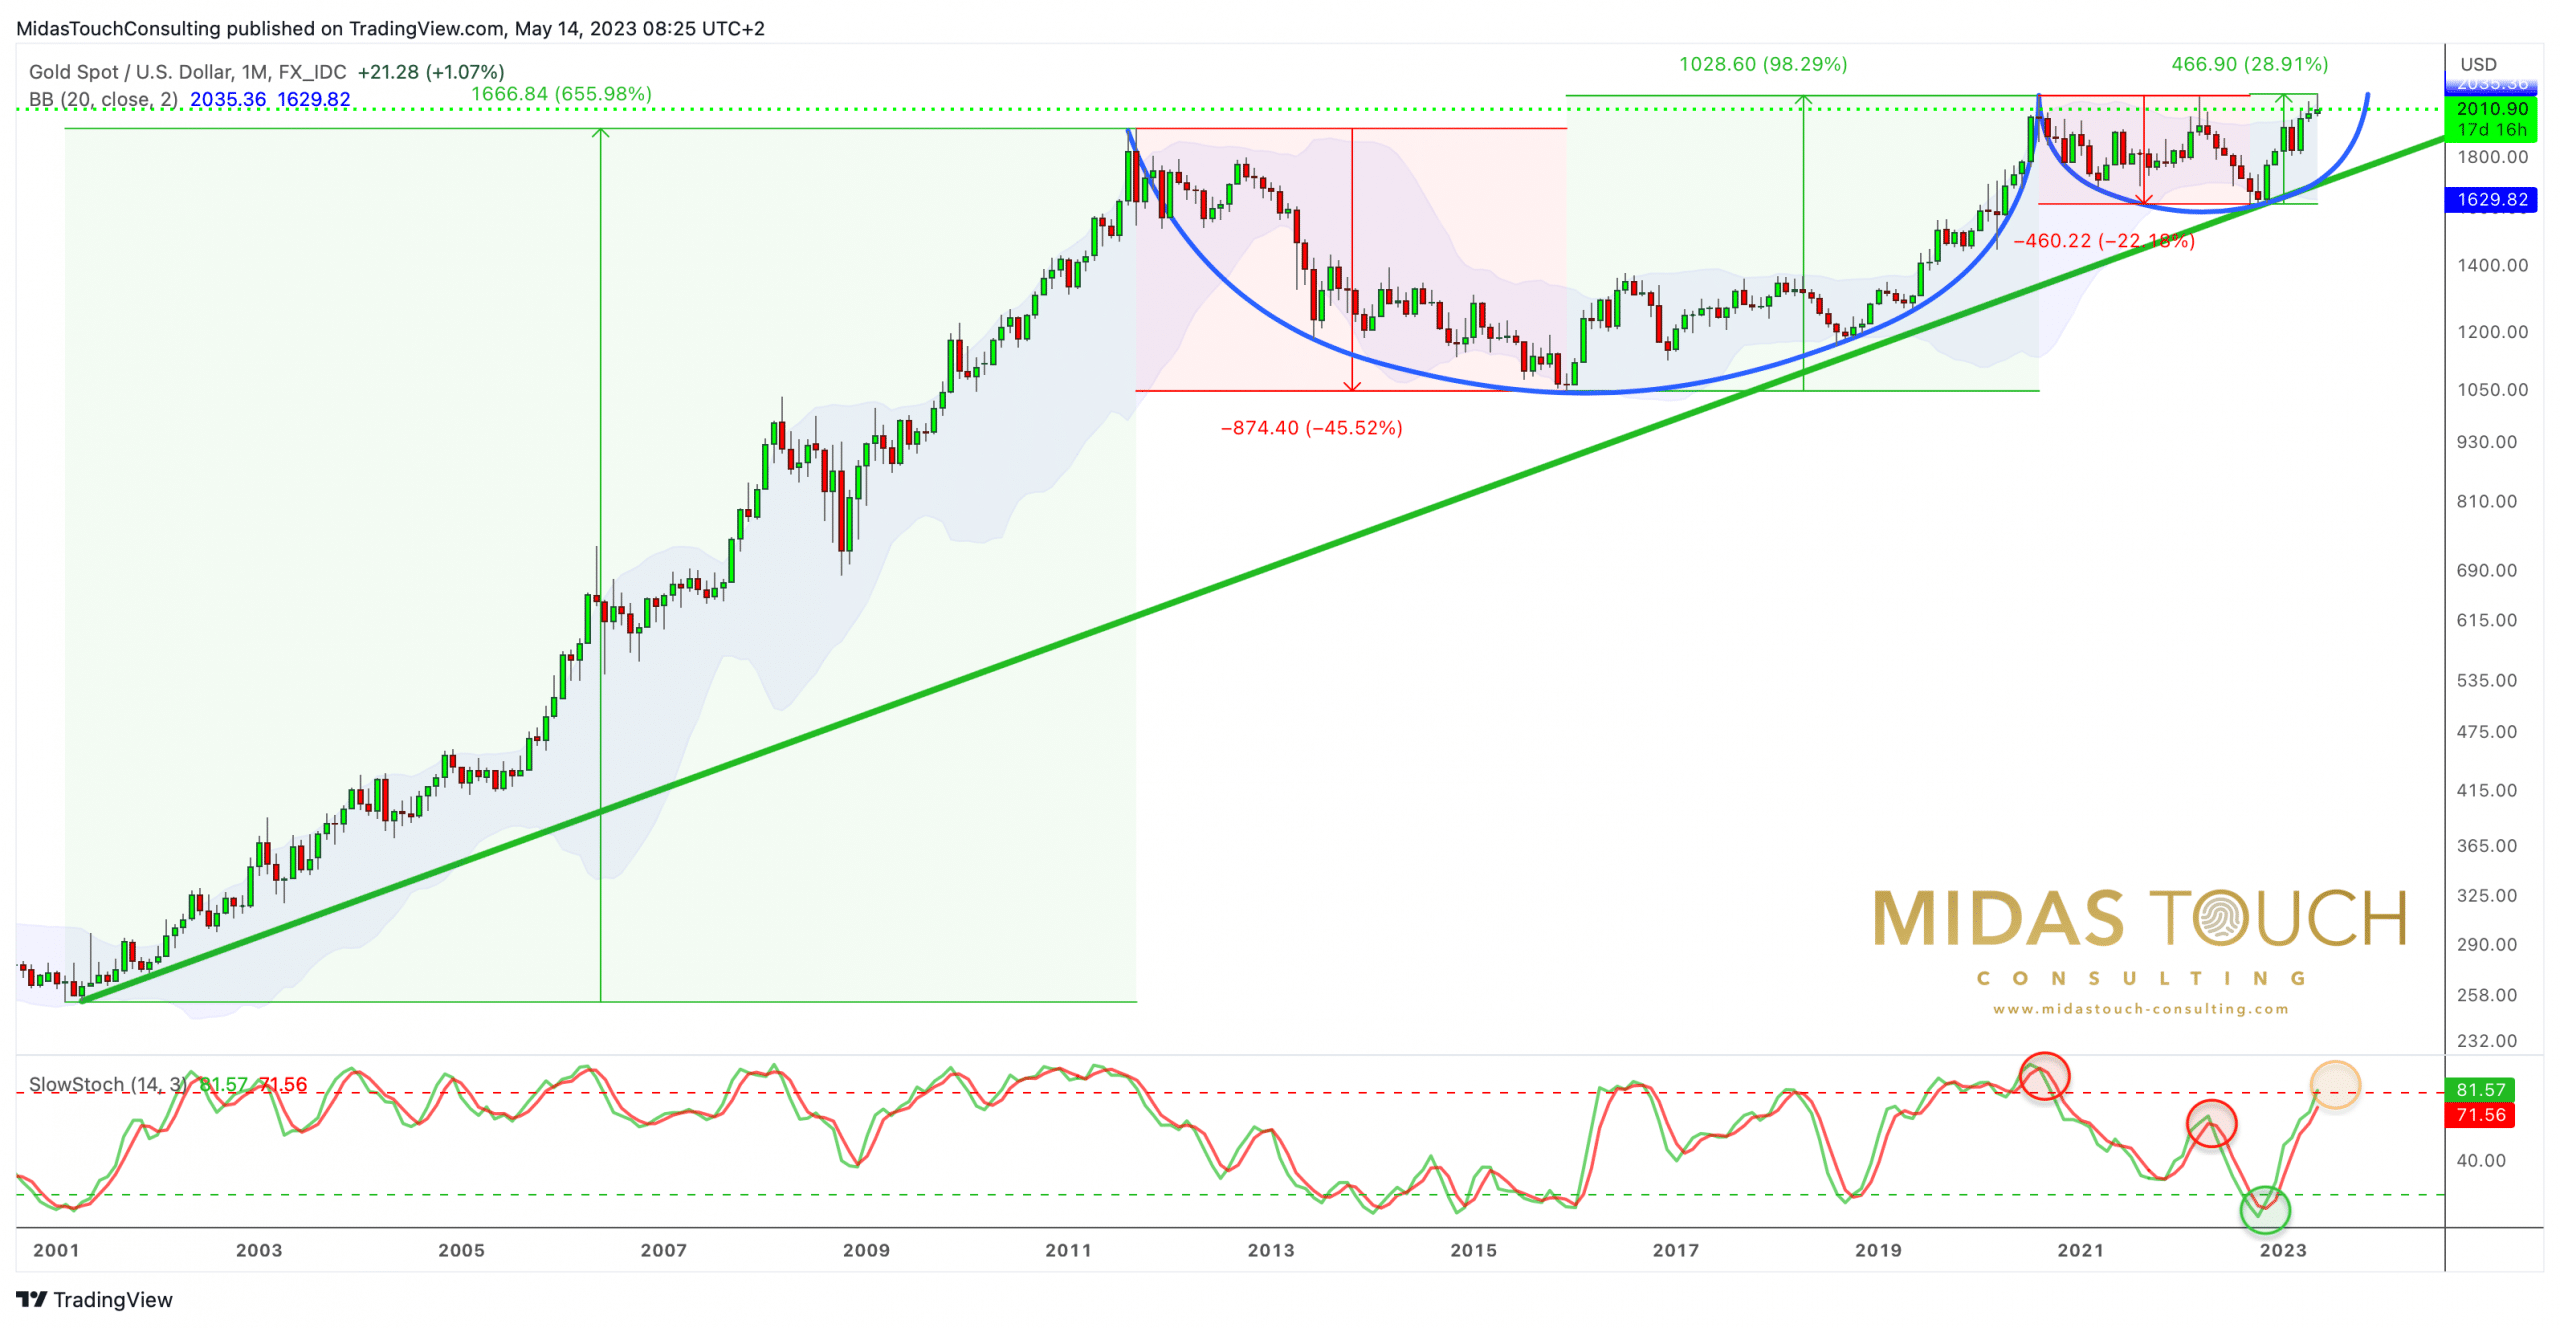
Gold in US-Dollars, monthly chart as of May 13th, 2023. Source: Tradingview
Over the past year and a half, we have consistently advised patience and anticipated that the breakout from the massive Cup & Handle pattern in the gold market would take longer to materialize. After gold failed to surpass its all-time high in March 2022, our Gold Model quickly shifted to a bearish mode by April. However, back then we did not expect a six-month pullback, with prices ultimately dropping to USD 1,615. But the most aggressive rate hiking cycle in history led to a severe and deep correction across all market sectors, including the gold market, of course. Fortunately, the Midas Touch Gold Model, combined with our technical analysis, kept us mostly on the sidelines, aside from a one-month summer rally.
One characteristic of successful traders is that they function flawlessly when they are not trading. When the markets calm down and enter a consolidation or correction phase, these traders engage in various activities, such as exchanging ideas with colleagues or conducting research. Traders who struggle to endure inactivity inevitably feel the urge to trade, even when there is often no real reason to do so. For them, the loss of money is less burdensome than boredom. – Dr. Brett Steenbarger
Triple bottom around USD 1,615
Finally, by mid-October 2022, short-selling and hedging positions among retail investors had skyrocketed to historic highs, creating a dismal sentiment in the markets that hinted at an imminent recovery. Consequently, the clear triple bottom at USD 1,615 marked the starting point for a new uptrend in the gold market.
In the first step, a swift rebound was accomplished, reaching the 200-day moving average as well as the psychological level of USD 1,800. Amid a market environment still characterized by fear and skepticism, gold prices then managed to hold above the USD 1,800 mark throughout December, hence setting the stage for the next phase of the recovery rally at the beginning of January 2023. This next wave up propelled gold prices quickly to USD 1,959, bringing them within sight of the magical threshold of USD 2,000. After a rise of 21.22% or USD 243 in just three months, however, bears temporarily resurfaced in February, pushing gold prices mercilessly down to USD 1,804.
Double bottom around USD 1,805
Following the bank run on Silicon Valley Bank and the ensuing banking crisis in the US, gold prices quickly turned around from here in early March and then sharply surged higher once again, reaching USD 2,009 within a mere three weeks. Since then, gold prices have experienced fluctuations but managed to improve further, reaching as high as USD 2,067. While the spot market has yet to hit an all-time high, the June Future achieved a new record high at USD 2,085.
However, and despite its strong performance, the gold market has gradually lost momentum in recent weeks. The upward movement appears increasingly sluggish, with negative divergences becoming more prominent. It is important to recognize that the rally from USD 1,615 to USD 2,067 (+USD 452 or +27.86%) over the past six months has taken a significant amount of energy, and historically, the months of May, June, and July tend to be relatively weak for gold. Consequently, we have been warning for several weeks about a potential “topping process” in which gold prices could stall out around the USD 2,050 mark, followed by a subsequent pullback. Under normal circumstances, this correction would likely lead prices back to the range of USD 1,900 to USD 1,920. It would not be unusual or unwelcome to witness a reunion with the swiftly rising 200-day moving average (currently at USD 1,820) by mid-summer. In the best-case scenario, we may see a resurgence of buyers outweighing sellers around USD 1,970 already. In this case though, the correction would primarily be resolved over the course of time and not price, extending until mid-summer.
Alternatively, if the bears make a forceful return to the financial markets, gold prices would likely have to endure a significant decline, too. There are sufficient reasons for a deflationary second half of the year, although these factors are already known and priced in. Furthermore, the number of pessimists continues to clearly outweigh the optimists. Therefore, it would not be surprising if the crash that everyone talks about has already occurred in 2022, with the markets being further propelled upwards by the covert implementation of new money-printing measures.
Midas Touch Gold Model™
The Midas Touch Gold Model™ switched from neutral to bullish on March 10th, 2023 and caught an increase of around USD 200 in the past two months in the gold market.
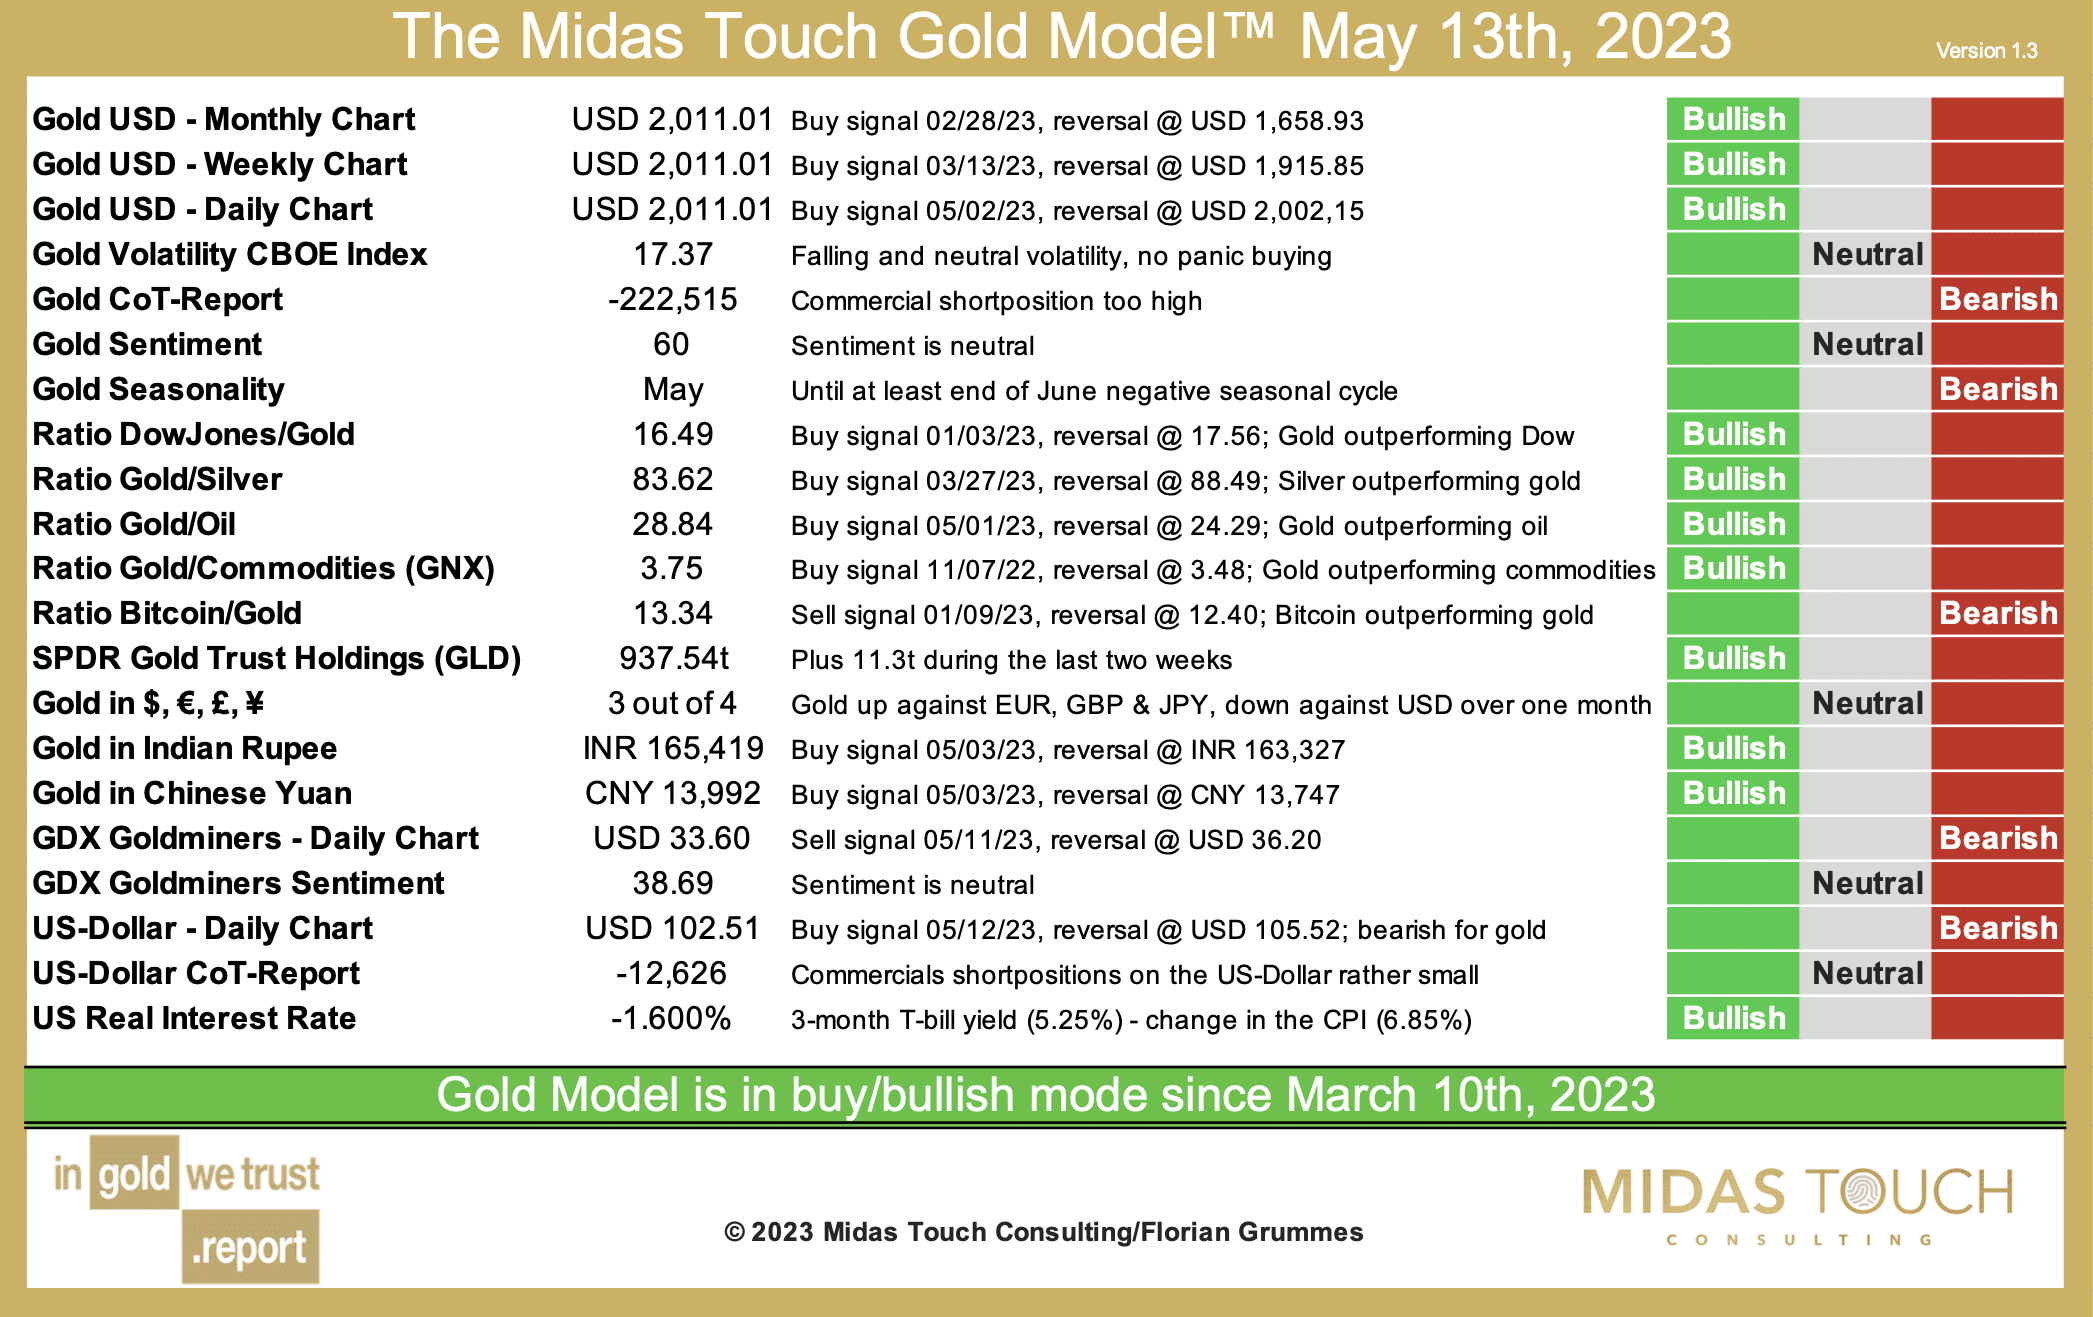
The Midas Touch Gold Model™ as of May 13th, 2023. Source: Midas Touch Consulting
Since May 11th, however, more and more bearish signals starting to appear and it only takes a move below USD 2,002.15 to move the model’s conclusion back to neutral. In fact, the situation has significantly deteriorated in the last trading days with the new sell signal for the GDX Gold Miners ETF and the buy signal for the US dollar. On the daily chart for gold in US dollars, there is not much left until a reversal signal would be reached at USD 2,002.15. At that point, the Midas Touch Gold Model™ would also shift to neutral. Silver appears to have already reversed with a large red daily candle on May 11th, leaving a small double top around the USD 26 mark. However, the gold/silver-ratio has not yet switched from bullish to bearish.
Overall, the following conclusions can currently be drawn from the Midas Touch Gold Model™:
- Both, the monthly and the weekly charts still have active buy signals. In particular, the buy signal on the monthly chart remains strong and would currently only reverse with prices below USD 1,658.93. However, the buy signal on the weekly chart could flip during a multi-week spring correction. Currently, this would occur if gold prices were to reach USD 1,915.85. This threshold increases by approximately USD 15 per week.
- Seasonality clearly advises caution, restraint, and above all patience. Statistically, the precious metals sector does not enter a favorable phase until mid or end of July. June, in particular, is traditionally a weak month for gold prices.
- Despite the strong upward movement over the past six months, sentiment remains neutral. There is (still) no euphoria or greed, and the rally has received little attention in the mainstream. These are ideal conditions in the medium term for a sustained breakout above the major resistance zone around USD 2,050 and a multi-year bull market.
- Since the beginning of the year, gold has clearly outperformed the Dow Jones. In the big picture, compared to the peak in September 2018, the Dow Jones/gold-ratio only reached lower highs in December 2021 and October 2022. A downtrend is slowly but surely taking shape. The next step would be a lower low in the coming year. This means that gold would have to outperform stocks even more strongly, and the Dow Jones/gold-ratio should be heading towards 12:1.
- Since the buy signal on November 7th, 2022, gold has strongly outperformed all other commodities. In the coming weeks, a shift in favor within the commodity sector should be expected as part of a correction in the gold market. In particular, the oversold copper price could now take the lead for a while. Subsequently, it is also possible that the oil price may take over.
- The rally of the past six months was not driven by gold ETFs. For example, the holdings of the largest gold ETF, GLD, only increased by approximately 22 tonnes in the past six and a half months. It is likely that gold ETFs will contribute to additional demand only at higher prices.
- While gold almost reached a new all-time high, mining stocks (GDX) are trading around 20% below their peak from August 2020! The Gold Miners ETF already reversed upwards in September 2022, delivering a 68.47% gain and providing a leverage of 2.4 times the gold price. Despite this clear outperformance over the past six and a half months, the performance over the past three years has been disappointing though and clearly lagging behind the gold price. Since May 11th, the Gold Miners ETF (GDX) has triggered a new sell signal. A healthy minimum correction could easily lead the ETF to the 38.2% retracement level (USD 30.62) of the upward movement over the last six months. This would correspond to a correction potential of at least 8%.
- After a decline of 12.2% within seven months, the US Dollar Index now has some potential for recovery. With a new buy signal on May 11th, 2023, the greenback could at least recover to its slowly declining 200-day moving average (USD 105.85) in the coming weeks. A slightly stronger US dollar is likely to have a negative impact on the gold price.
Gold – Short- to midterm Outlook
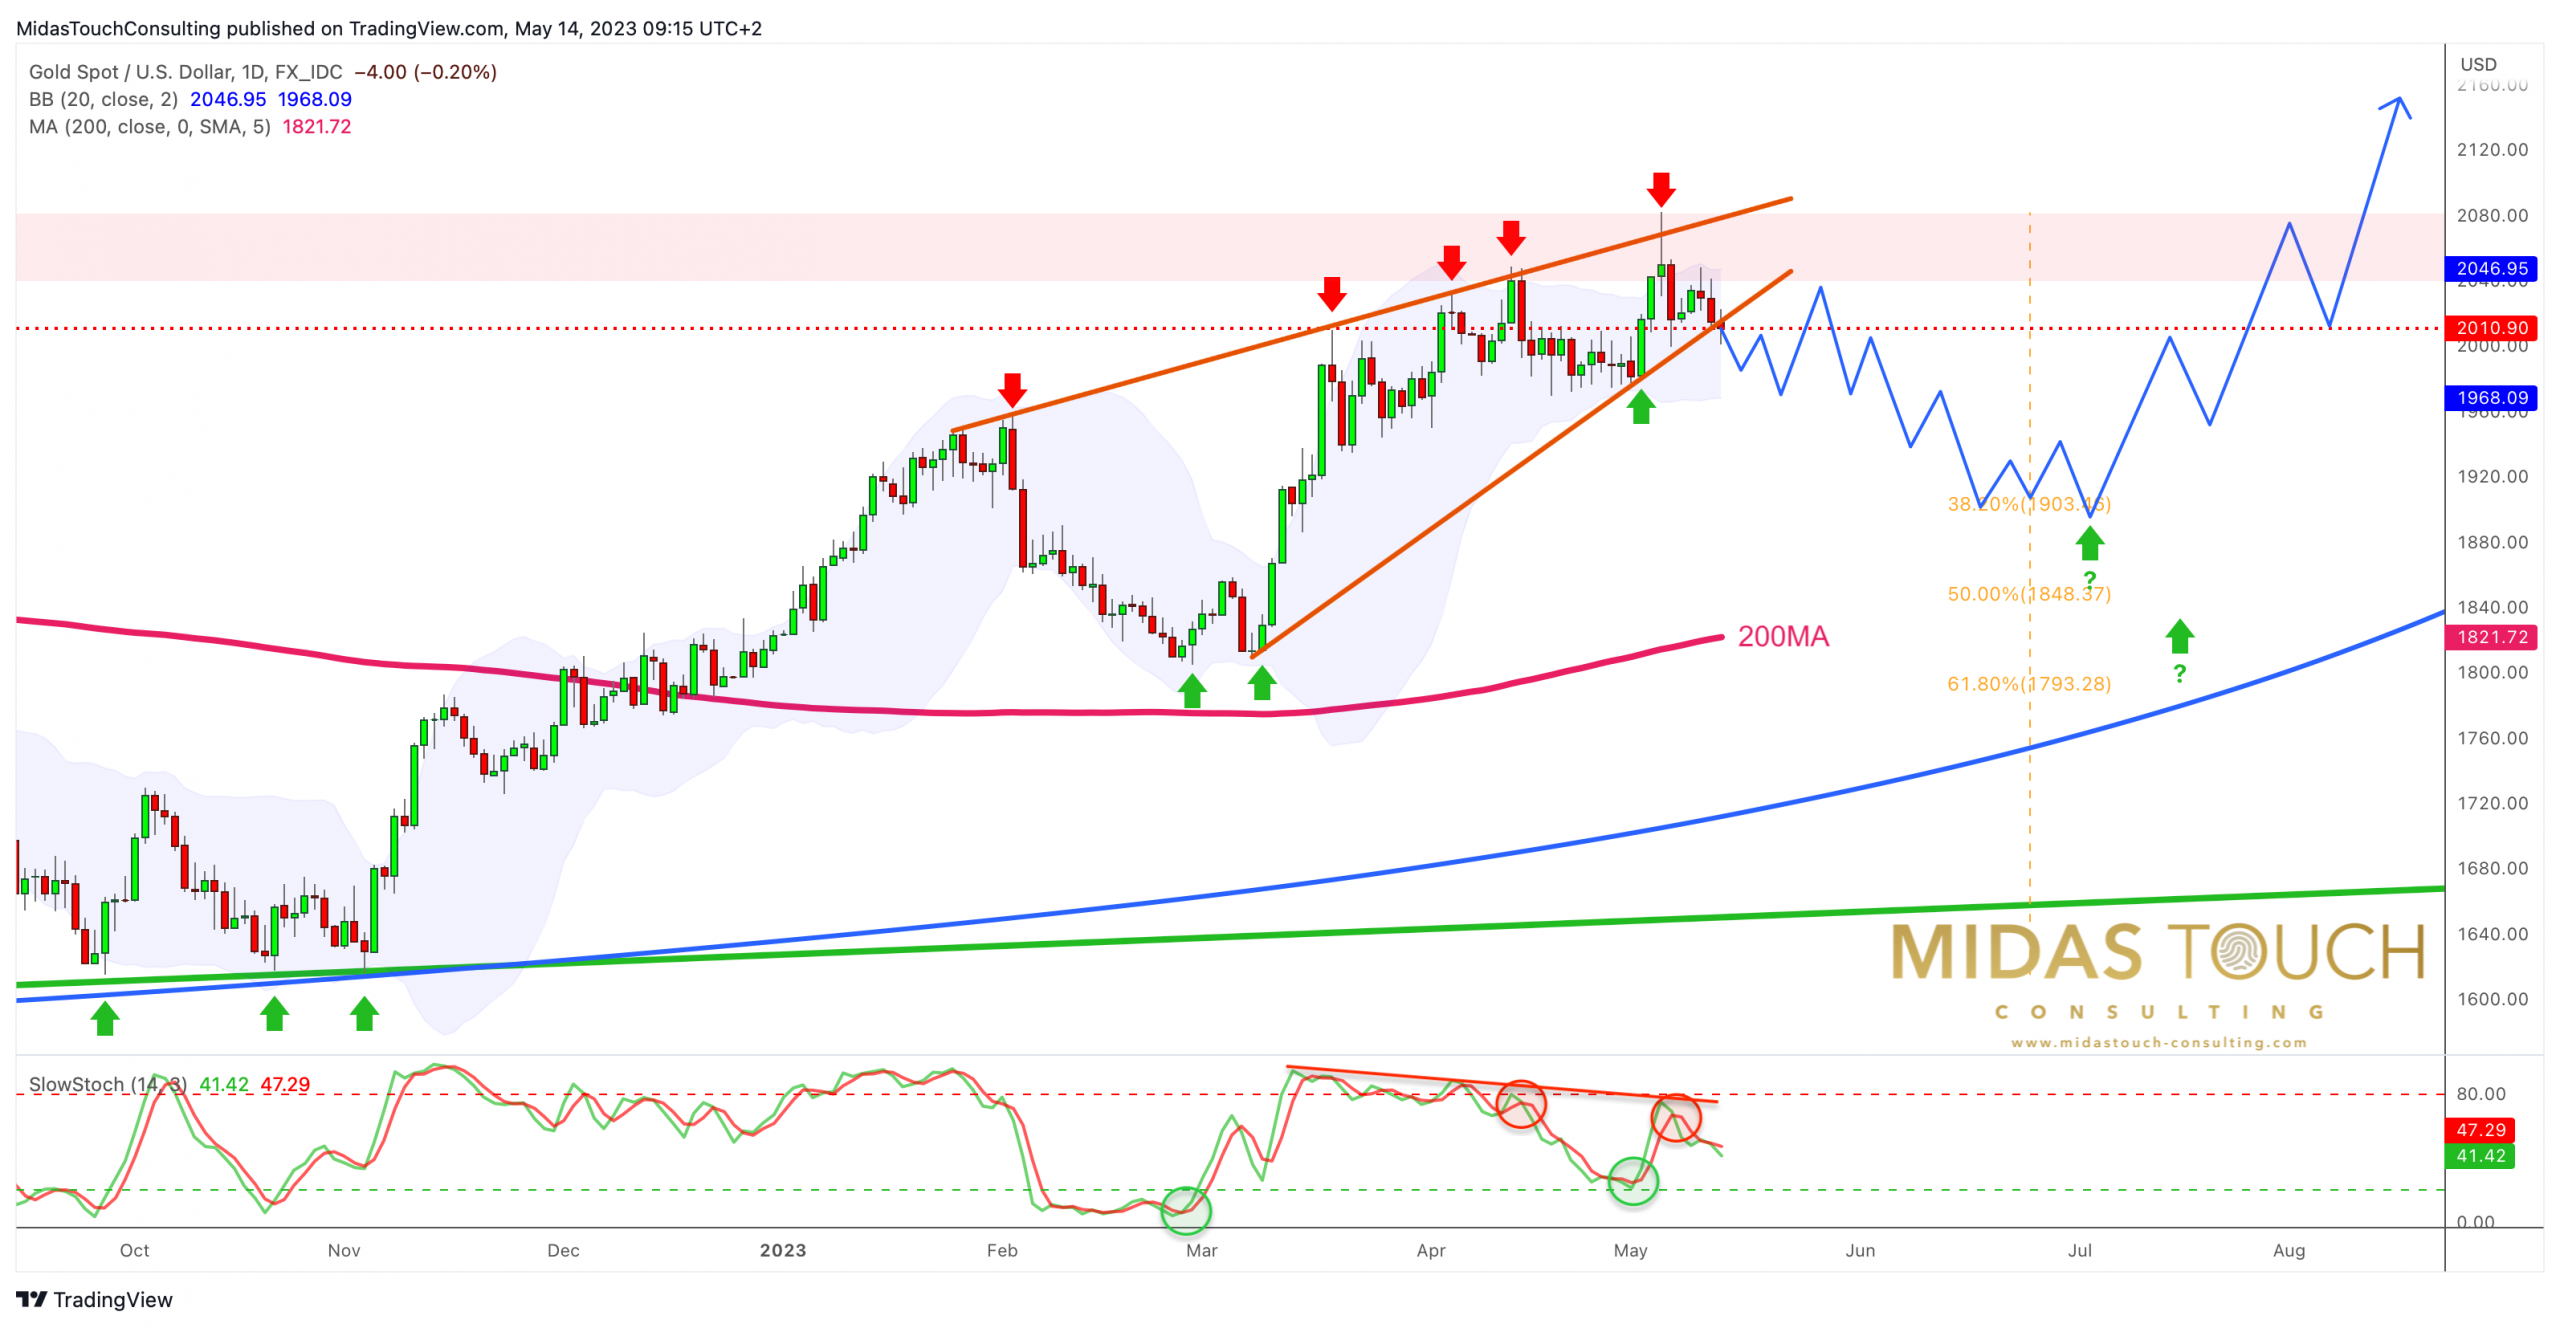
Gold in US-Dollars, daily chart as of May 13th, 2023. Source: Tradingview
On its daily chart, the gold price has been getting more and more stucked around the USD 2,050 mark in recent weeks. At the same time, a bearish wedge has formed, while several indicators such as the Stochastic Oscillator have failed to confirm the new price highs (negative divergence). With a weekly closing price of USD 2,010.90, gold has slightly broken out of the wedge to the downside. The wedge formation suggests a correction target around USD 1,825.
Currently, the rapidly rising 200-day moving average (USD 1,821) is also within this range. By mid-July, however, and towards the end of the negative seasonal phase, this important moving average is likely to have reached approximately USD 1,900. Ideally, the gold price should test its 200-day moving average before the start of the next wave up. Therefore, along with the 38.2% retracement of the entire recovery rally (from USD 1,615 to USD 2,067), the range between USD 1,900 and USD 1,920 appears to be an ideal target zone for the suspected correction. This would represent the middle ground between a major correction that could disrupt the favorable technical chart pattern and a shallow consolidation primarily over time above USD 1,970, which may not sufficiently cleanse the overheated gold market.
GDX sentiment too optimistic
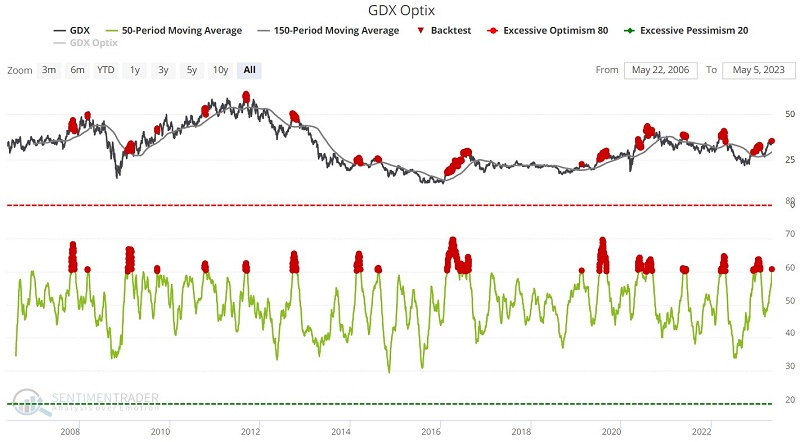
GDX Sentiment as of May 9th, 2023. Source: Sentimentrader
GDX Sentiment has been getting quite extended. The chart highlights with a red dot all dates when the 50-day average for GDX Optix was above 60, and the GDX closing price was below its 150-day moving average.
Seasonality is not favorable for gold
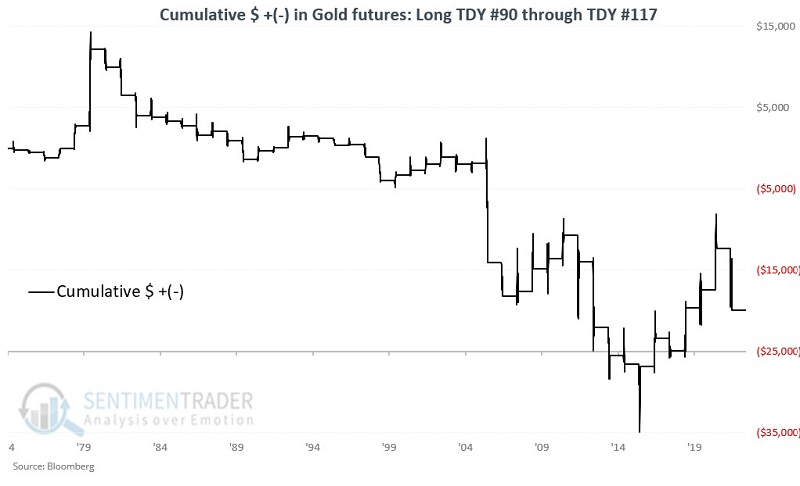
Gold unfavorable seasonal period as of May 10th, 2023. Source: Sentimentrader
Gold is entering a slightly unfavorable seasonal period. The period of weakness extends from Trading Day of Year (TDY) #90 through TDY #117. For 2023, this period extends from the close on 2023-05-09 through the close on 2023-06-15. The chart displays the hypothetical $ +/- achieved by holding a long position in gold futures only during these windows each year since 1975.
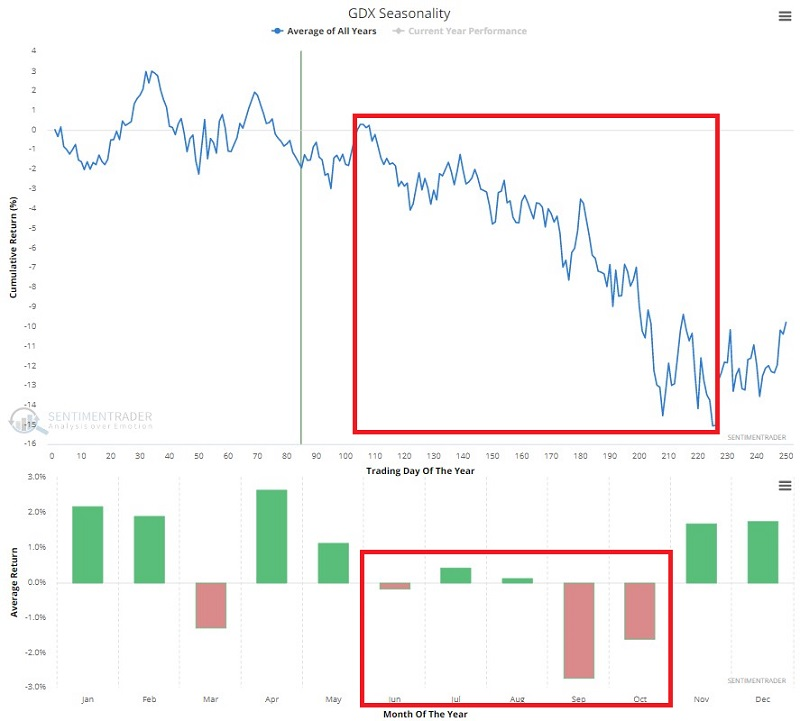
GDX seasonality as of May 9th, 2023. Source: Sentimentrader
While all the momentum was to the upside, several sentiment and breadth indicators are suggesting that caution may be in order. The chart displays the annual seasonal trend for GDX. The cause for concern is obvious, as the June through October period tends to show significant weakness.
Conclusion: Patience, the breakout will come!
Overall, gold is likely to digest or correct its impressive recovery rally in the next one to three months. The pullback does not necessarily have to be very deep. In the best-case scenario, buyers could emerge significantly around USD 1,970. However, it would be better if the pullback ran towards the range of USD 1,900 to USD 1,920 and closed the open mini gap in the gold futures.
Anticipation is the greatest pleasure. – German Proverb
Subsequently, the breakout above the three-year resistance zone around USD 2,050 to USD 2,075 would be on the agenda, triggering the massive cup and handle formation to the upside. This pattern has accumulated a tremendous amount of energy in the gold market since 2011, which could potentially drive gold prices beyond USD 2,500 in the fourth quarter of 2023. For this feat to be accomplished, it is crucial for the gold price to take a healthy breather in the coming weeks via a significant pullback. If this fails, the breakout above USD 2,075 is likely to be less exhilarating.
This article is our contribution to the In Gold We Trust Report 2023. It was initially written in German on May 13th, 2023 and then translated into English and partially updated on May 14th, 2023.
Feel free to join us in our free Telegram channel for daily real time data and a great community. If you like to get regular updates on our gold model, precious metals and cryptocurrencies you can also subscribe to our free newsletter.
Disclosure: This article and the content are for informational purposes only and do not contain investment advice or recommendations. Every investment and trading move involves risk, and readers should conduct their own research when making a decision. The views, thoughts and opinions expressed here are the author’s alone. They do not necessarily reflect or represent the views and opinions of Midas Touch Consulting.

