


Just a few more weeks of patience!
1. Still caught in a consolidation
Looking back to my silver analysis from early march, silver indeed continued to move sideways for the last three months. The precious metal is still caught in a large consolidation. At least, silver was not much affected by gold´s recent plunge below 1,300 USD. Instead prices are barely moving at all.
Seven years since its top at 50 USD, most investors have probably given up on silver or sticking to their positions in pure resignation. But as already pointed out, silver might be one of the last real contrarian investments as it seems to be very undervalued at current price levels. Especially once inflation is picking up, silver should become one of the best performing assets! And with the current extremely low volatility its just logic to believe that sooner or later money will flow back into this tiny and forgotten market.
Let´s take an in depth look at silver from a fundamental (Part 1) and technical point of view to figure out the outlook for the next 6-12 months.
2. Global silver production 2017 down 2.7% – Global silver demand down 5%
Fundamentally speaking, 2017 has been a challenging year for the silver industry. According to the latest data from the US Geological Survey, global silver production decreased in 2017!
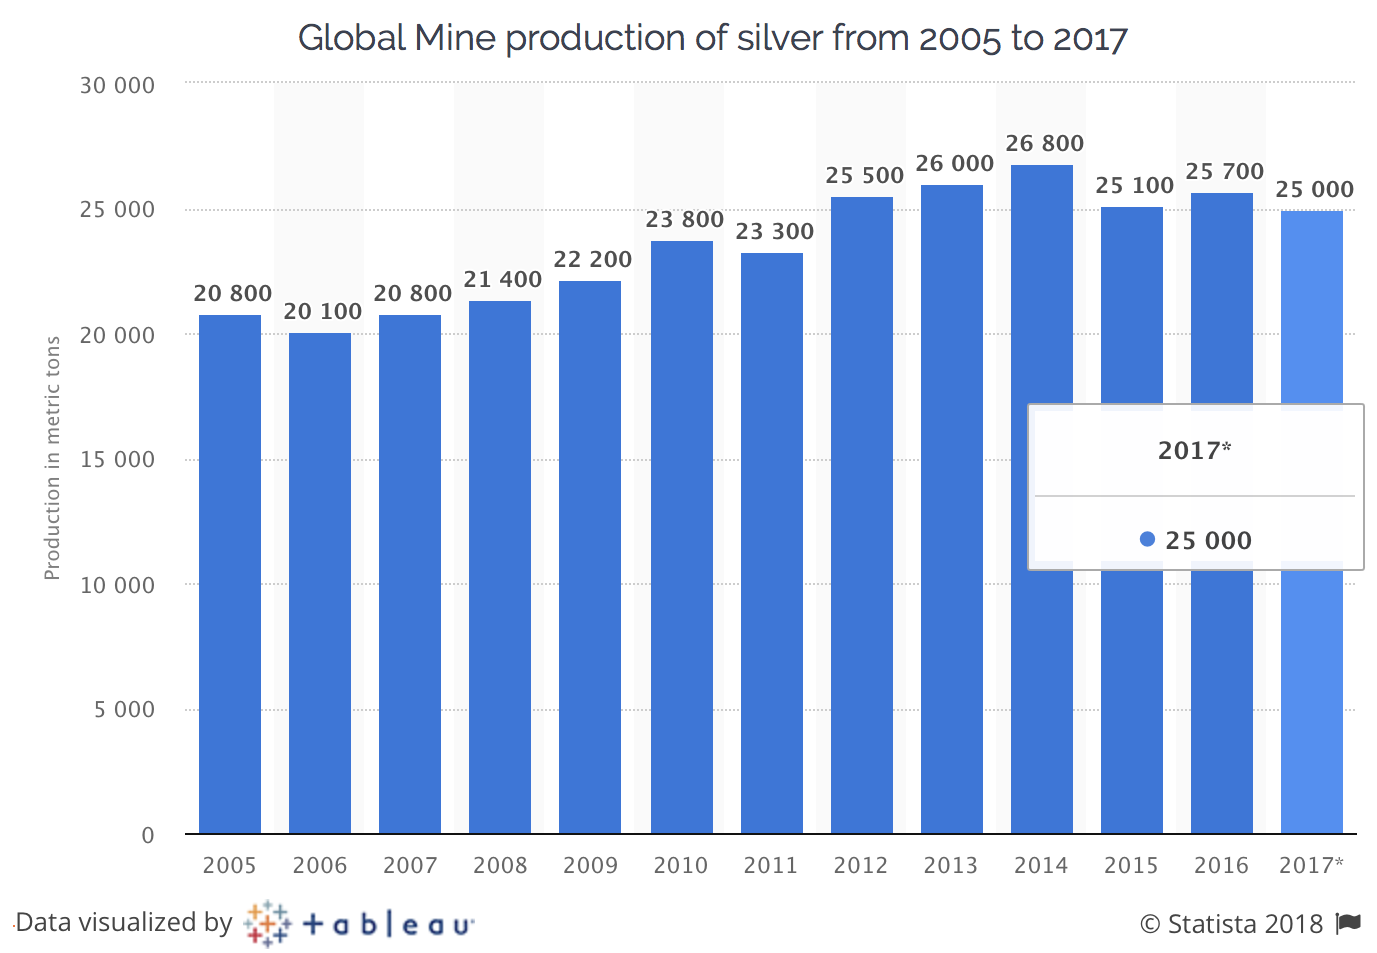
Global mine production of silver from 2005 to 2017 in metric tonnes (MT)
While overall global gold production in 2017 was fairly stable at 3,150 metric tonnes (MT), global silver production fell by 700 MT or 2.7% to 25,000 MT over the same period. Above all, the lower mine production in Argentina, Australia, Bolivia, Chile, Peru and the United States was responsible for this decrease. Mexico, however, remains the leader in silver production and has been the world’s top silver-producing country for eight consecutive years.
At the same time silver consumption fell by ca. 5% in 2017. This might explain the overall weakness in silver prices based on supply and demand. In particular, the sharp decline in silver consumption of coins and bars, which has fallen to a 10-year low following record sales in 2015, contributed to falling demand. At least increased consumption from industrial production, jewelery production and silverware offset an even stronger decline in demand.
3. The largest silver producing countries in 2017
Generally knowing which countries produce the most silver is a helpful and important information for investors. It can give more clarity to a company´s exploration and development decision. It also might indicate mining-friendly laws or high-grade deposits.
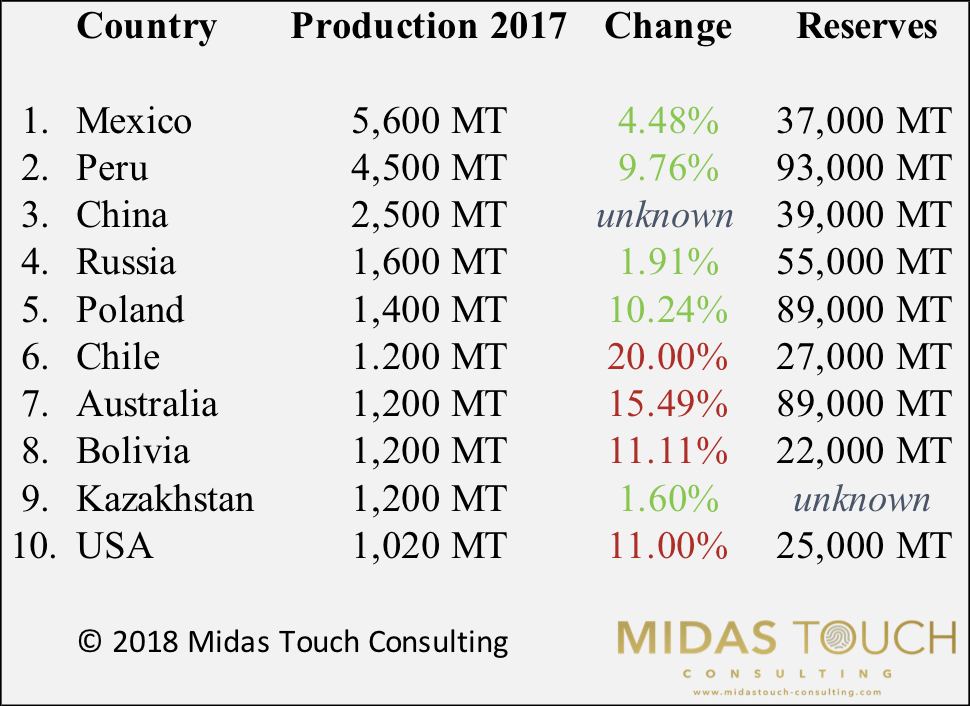
Top 10 silver producing countries 2017
In 2017, Mexico once again was the largest silver producer in the world. According to the US Geological Survey, silver production increased by a total of 240 MT to 5,600 MT. A huge number of companies operate silver mines in Mexico, and many of them are also running silver exploration within the country. Silver mining in Mexico dates back about 500 years and silver accounted for over 70 percent of Mexico’s exports from the late 16th century until the 1870s. Today mining remains an important part of the country’s economy. Some of the main silver players in mining-friendly Mexico are Pan American Silver, First Majestic Silver, Endeavour Silver and of course one of the most prolific silver companies in the world Fresnillo. The company extracts silver and gold in six different mines and has several other projects at various stages of development.

Antamina copper mine in Peru
With 4,500 tonnes of silver produced, Peru was able to significantly increase its output by 9.7% compared to 2016 and to defend its second place. But in terms of silver reserves, Peru´s known 93,000 MT are clearly the number one. With this huge and untapped potential, in the long run Peru could become the world’s largest producer again. Most of the Peruvian silver production comes from the Antamina Mine in the north of the country. The mine is a joint venture between BHP Billiton, Glencore, Teck Resources and Mitsubishi. However, Antamina is primarily a copper mine. Silver is just a by-product. But Fortuna Silver Mines for example operates an active and silver-focused mine in Peru.
China produced 2,500 MT of silver and is therefore the 3rd largest silver producer. Almost 95% of the silver production is likely to be a by-product of other mining projects in China. The largest purebred silver producer is probably Silvercorp Metals, which has a diversified portfolio of silver-lead-zinc mines in China.
Russia’s silver production only increased by 30 tonnes or 1.91% last year, but with Chile and Australia producing far less than in 2016, Russia became the fourth largest silver producing country in the world. The largest silver producing company within the country is Polymetal International. Polymetal operates four of the country’s five largest silver mines. Last year, Polymetal produced 26.8 million ounces of silver, down 8% from the previous year.
Poland was able to climb one place up in 2017. Its silver production of 1,400 tonnes now exceeds that of Australia. Of course, Poland-based KGHM Polska Miedsz is one of the world’s leading silver-producing companies. With nearly 89,000 tonnes of silver reserves, Poland will continue to play a very important role in the future.
Chile, meanwhile, had to record a significant decline in its silver production. Production fell by more than 300 tonnes or 20% compared to 2016. The main reason was likely the 44-day labor dispute in the world’s largest copper mine “Escondida” operated by BHP Billiton. In addition, the Chilean ministry responsible for mining acknowledged that the decline in silver production was also due to the sheer lack of silver.
Australian silver production declined quite significantly last year, too. Only 1,200 tonnes of silver were produced, which is a minus of more than 15% compared to 2016. Nevertheless, operator South32, with its Cannington mine in Queensland, contributes nearly 6% of the world’s silver.
Number eight is Bolivia. Another country that had to cope with a significant decline in its silver production in 2017. Although the Bolivian silver industry was able to expand slightly, production fell by 150 MT to 1,200 MT. But as Sumitomo‘s San Cristobal mine has the world’s third-largest silver reserves, the weak numbers for 2017 are likely to have been a temporary slip-up. And with Pan American Silver, which operates the underground silver-zinc mine called San Vicente, another top player is very active in Bolivia.
A country that not too many people connect with silver is Kazakhstan. As a newcomer to the top 10 it made it to the ninth place in 2017. With almost 1,200 tonnes of silver, Kazakhstan is already on par with long-standing and well-established producers such as Chile and Australia. The mining company Kazzinc, based in Öskemen, was certainly responsible for the vast majority of production. With more than 22,000 employees, Kazzinc mainly produces zinc, lead and copper and, as a by-product, the precious metals gold and silver. Unfortunately, the US Geological Survey did not provide any information on the silver reserves in Kazakhstan.
In tenth place, and thus at the bottom of the top 10, are the USA. With a total production of 1,020 MT of silver (-11%) miners created an estimated value of 564 Mio. USD. American silver production mainly came from three dedicated silver mines and from 36 other base and precious metal mining operations across the country as a by-product. The two most important “silver states” remain Alaska and Nevada. Similar to Chile, the decreased output can be attributed to a month-long strike in Hecla Mining´s primary silver mine “Lucky Friday”. Interestingly remains the fact, that the US needs to import around 20% of the world’s silver production to meet the demand for silver in its own country.
2. Silver technical analysis

Silver monthly chart as of June 6th 2018. Bollinger Band Squeeze in the making?
On the monthly chart the Bollinger Bands are getting tighter. Actually the Bollinger Band width is as small as in 2002. Since then they never have been this tight. Arguably this means that sooner or later volatility will come back into the silver market and we will likely witness a strong move.
As well silver is currently sitting right above an important trend-line whose starting point goes all the way back to 2008. It would be a surprise, if silver bulls will not defend this trend line and use it as a launching pad for a new rally.

Silver daily chart as of June 6th 2018. Triangle breakout expected within the next four to eight weeks..
The daily chart shows the large triangle into which silver is moving since last autumn. Silver might need another one or two month before it will break out of the apex of this multi-month triangle. Both moving averages (50 MA and 200MA) have been flattening out and the recent daily trading range is less than 0.30 USD!
During the remaining usually weak month of June, it will critical, that silver can hold above its support zone between 16,05 and 16,25 USD. But with a renewed stochastic buy signal the probability for rising prices is slightly higher. Most likely silver will simply dance around its 200MA (16,73 USD) in a slow and muted fashion. Any move above 17,00 USD indicates that the breakout is already underway.
Technically it looks as it makes sense to start buying into silver on any weakness over the next couple of weeks. We might not get a big sell off anymore. Instead this year’s summer rally could start without any noise somewhere in July….
3. Silver CoT-Report
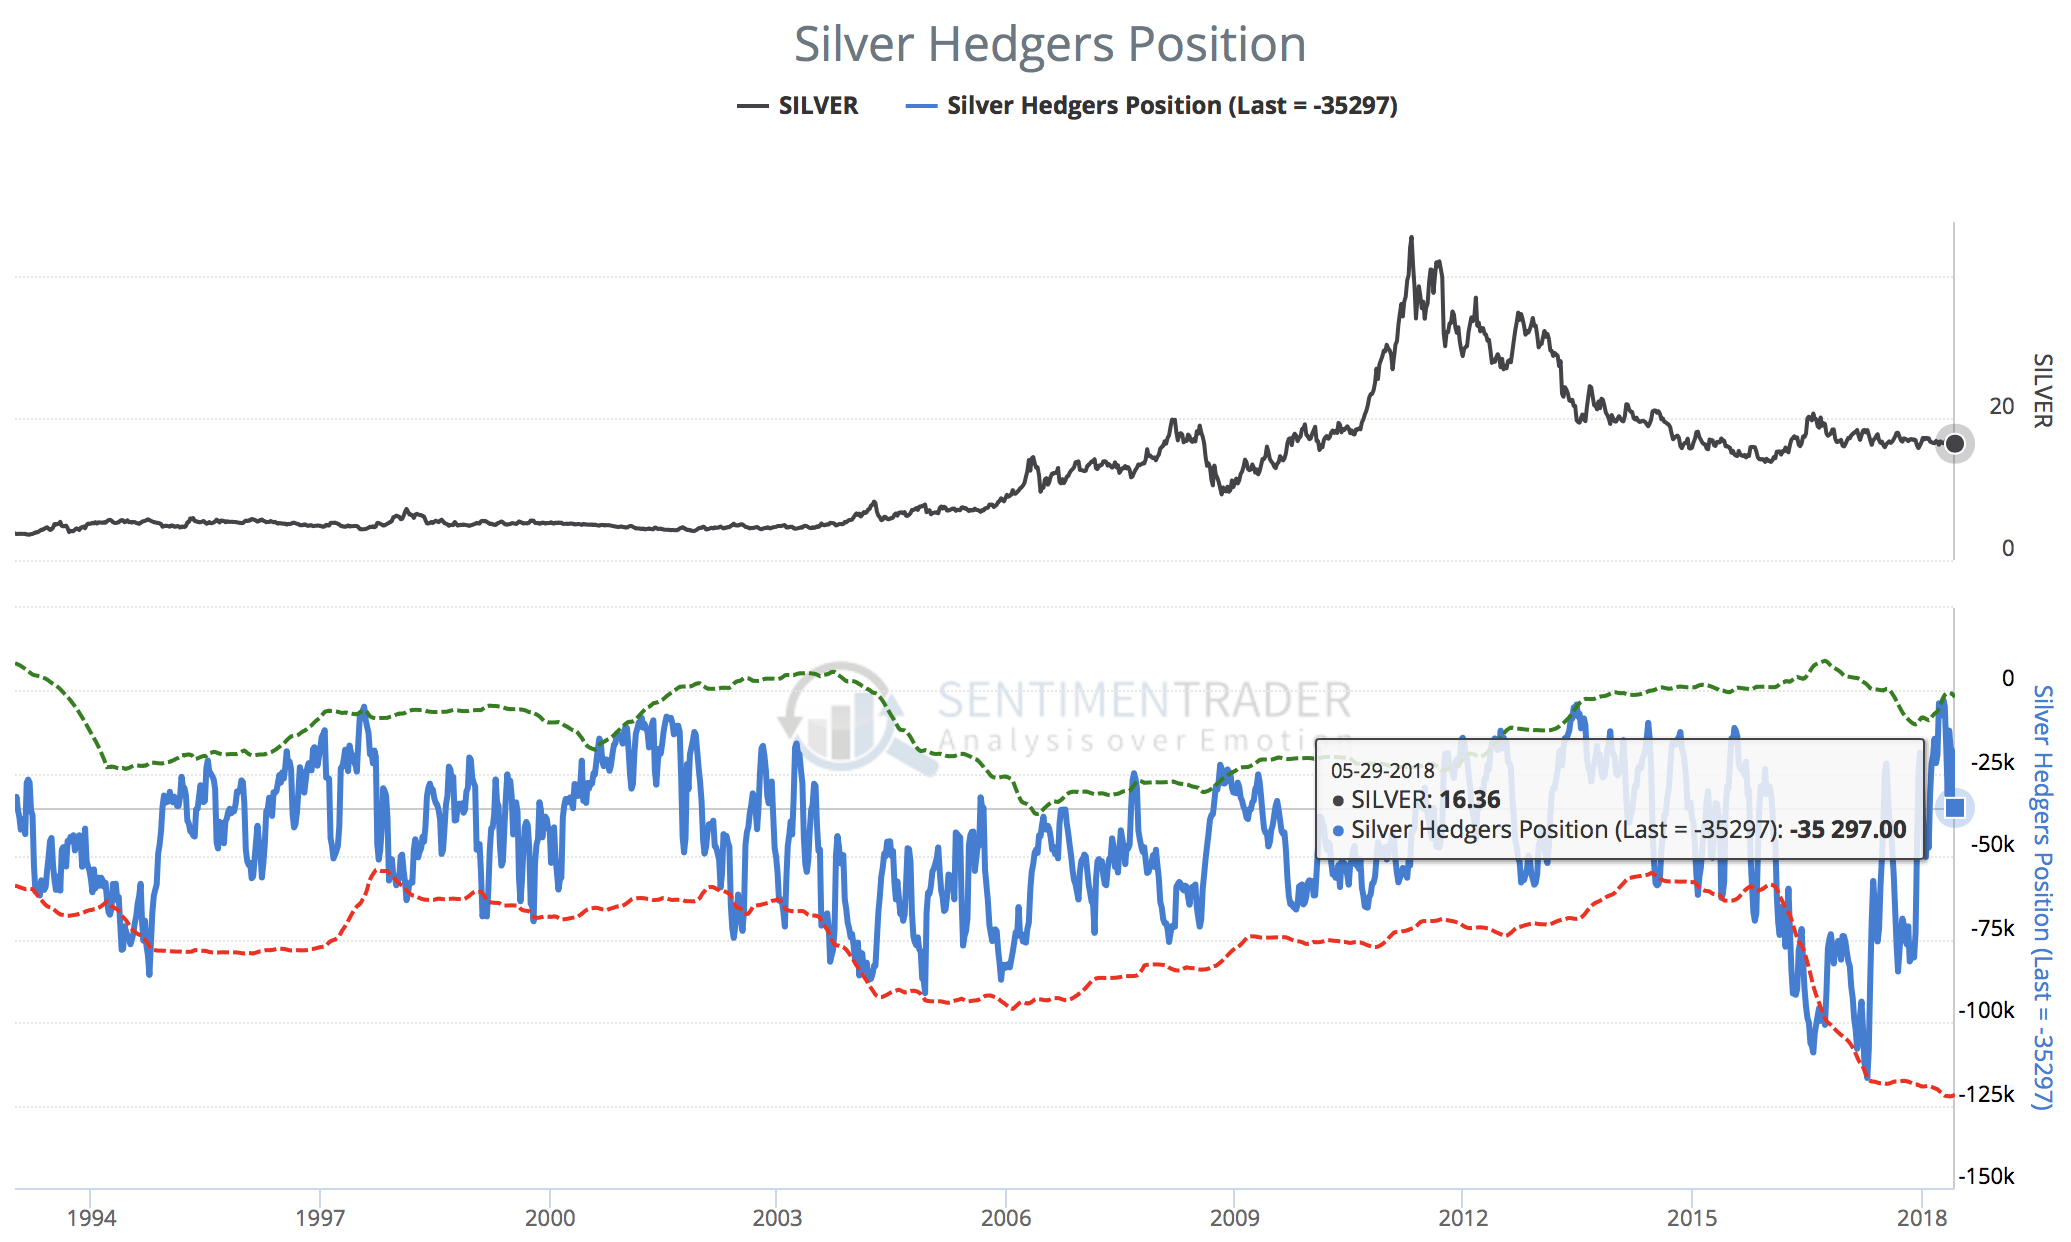
Silver hedgers position as of May 29th 2018
According to the latest CoT-Report the cumulated commercial short-position was 35,297 contracts last Tuesday, when silver closed at 16,36 USD. In comparison to the extremely low numbers in early spring, this is certainly a small deterioration. But at the same time there is no reason to worry at all.
Usually a perfect contrarian setup is found when commercial hedgers hold less than 10,000 short contracts in the silver futures market. With the current 35,297 short contracts, a final sell off in silver is still possible in the coming weeks. But generally the silver CoT numbers are bullish.
4. Silver Sentiment

Silver optimism index as of June 1st 2018
The latest sentiment numbers are more or less neutral for the whole precious metals sector. My personal perception is that many investor and traders have left gold and silver in resignation. As well, the largest gold ETF “GLD” has seen more than 30 tonnes of gold leaving its vault over the last four weeks. Certainly many paper gold investors have given up during gold recent down wave. Overall sentiment is neutral.
5. Silver Seasonality
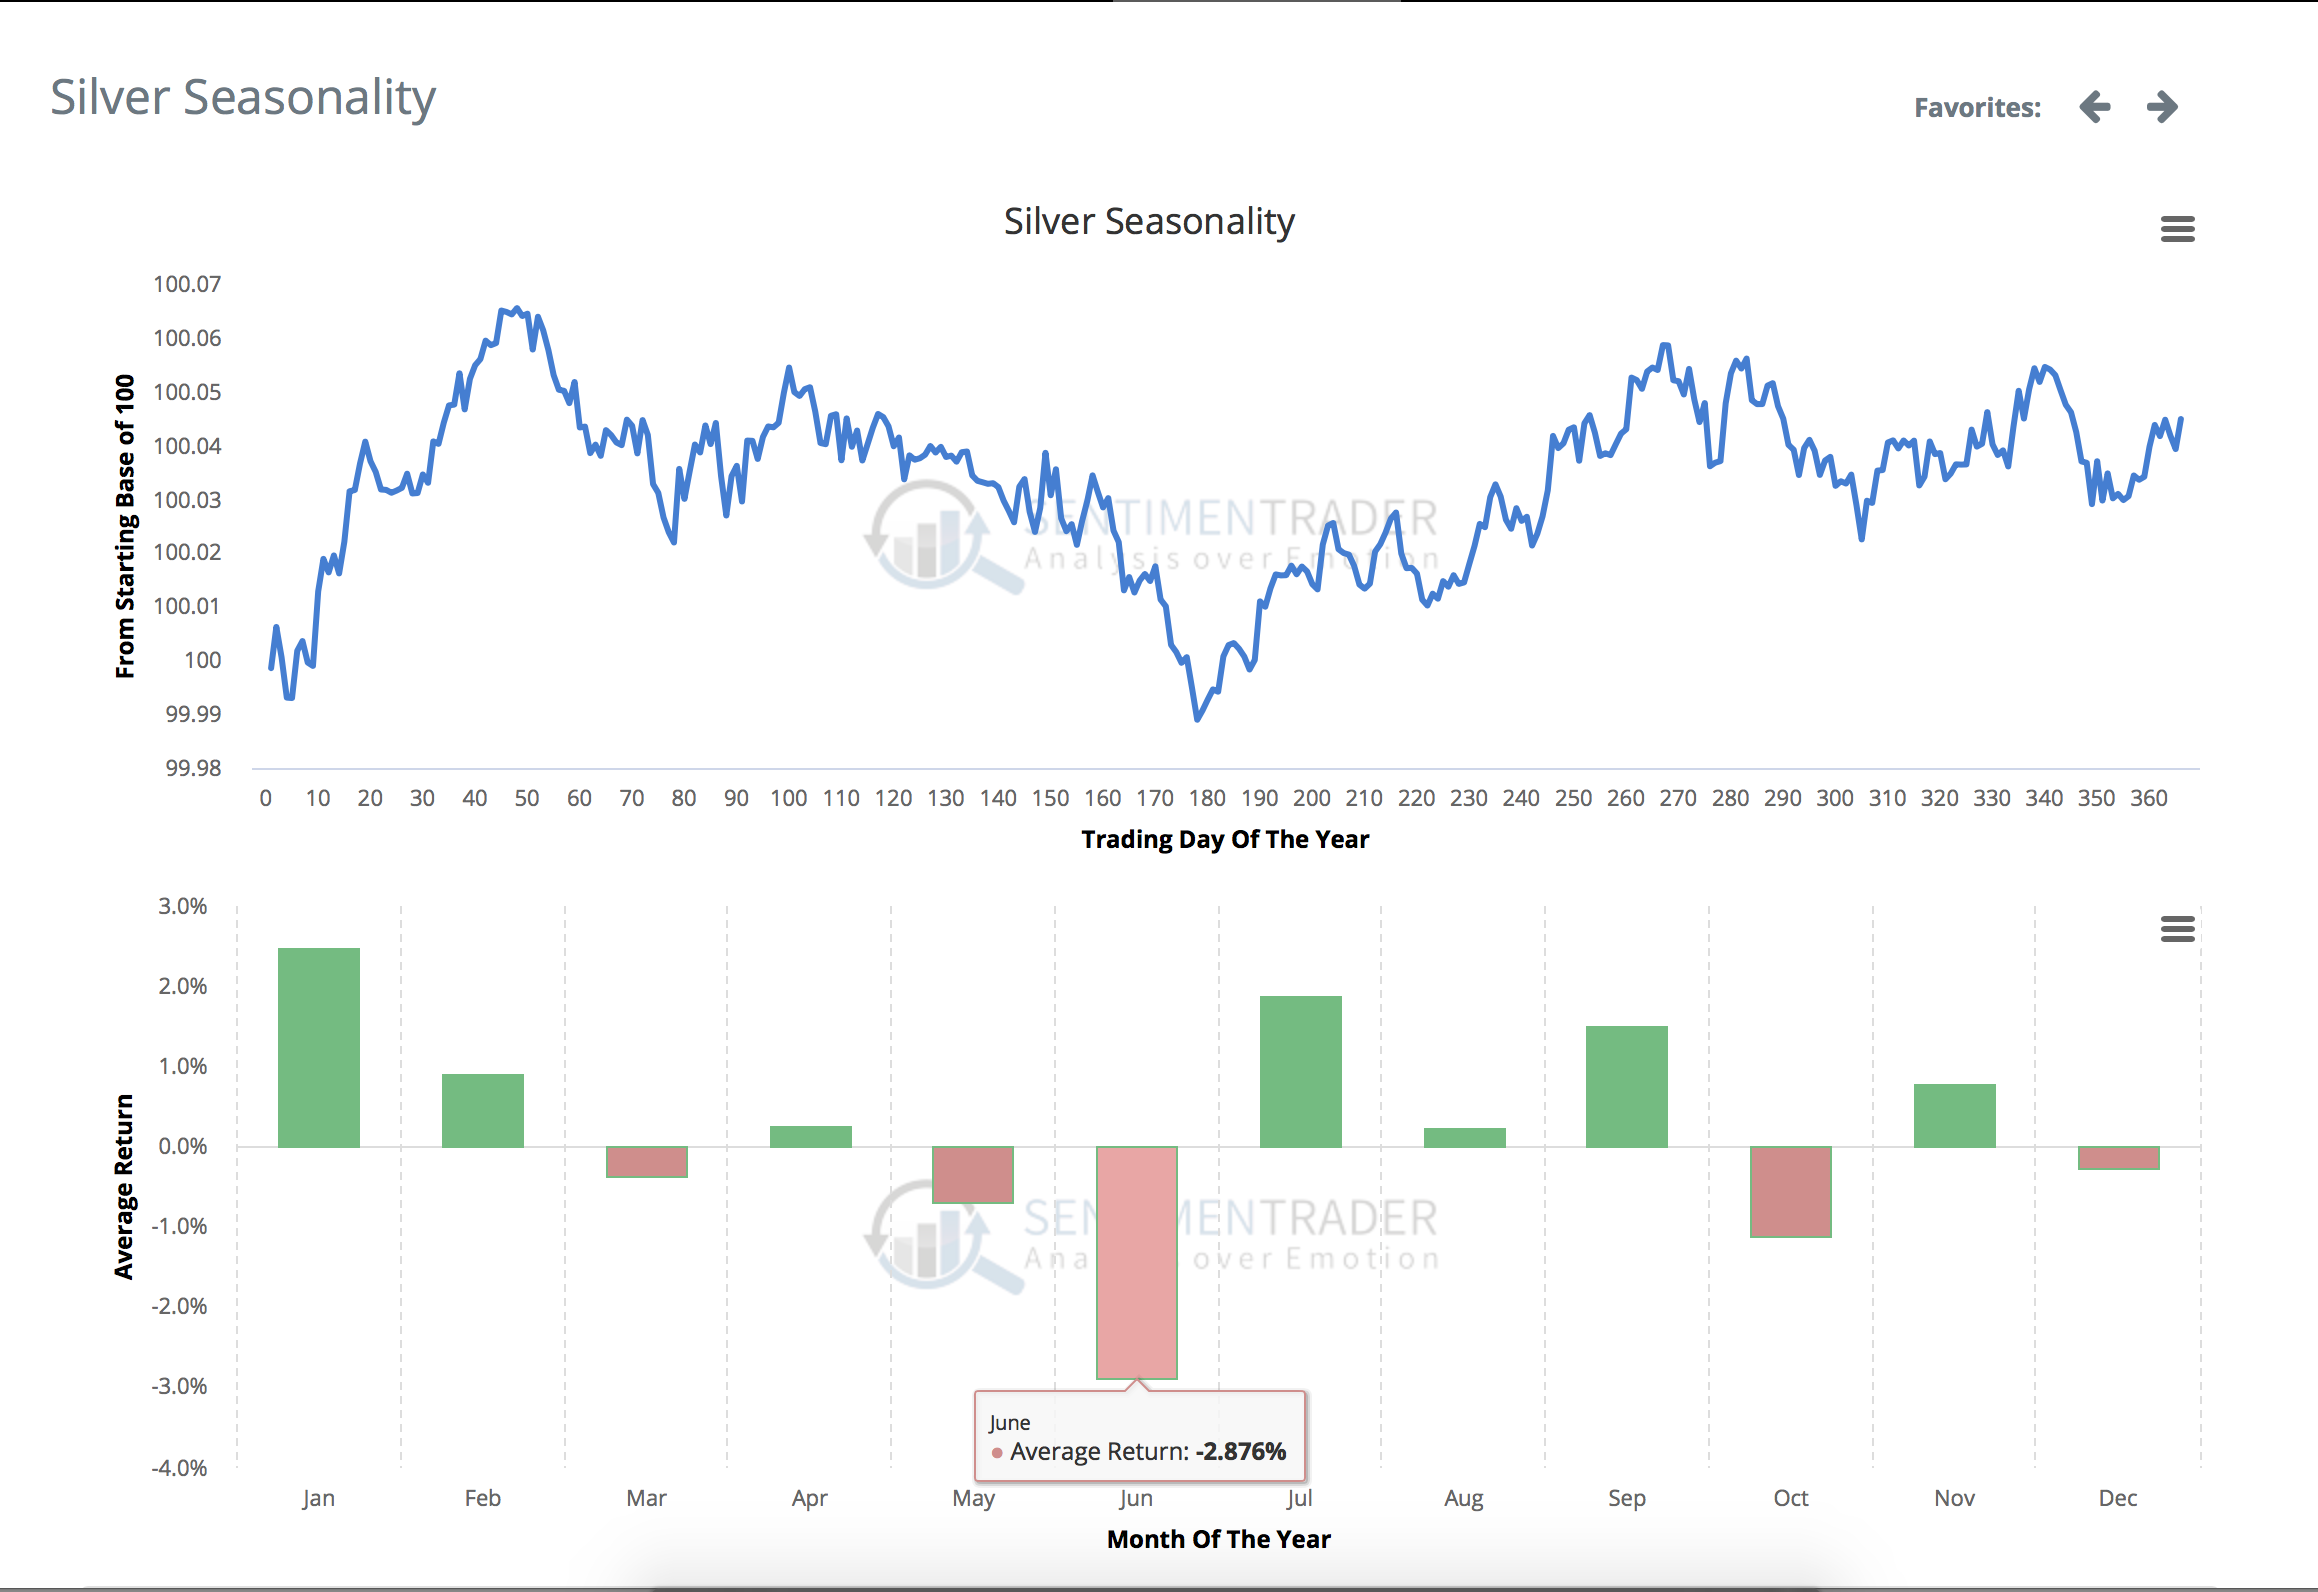
Silver seasonality over the last 40 years
According to its seasonal cycle Silver might be just four weeks away from a significant trend change and the start of a strong summer rally. Usually during the extremely weak month of June silver often experiences dramatic sell-offs followed by a powerful surge into the summer months between July and September. So far the typical pattern seems to play out this year as well. From this perspective buying into silver towards end of June/early July makes sense.
6. Conclusion
Despite gold´s recent plunge silver has been holding up well. The extremely low volatility indicates a market where neither speculation nor mainstream interest is apparent. This of course is a typical set up for a great contrarian investment. And as we are approaching summer the strong seasonal pattern for gold and silver should kick in.
Especially as I expect a breakout in gold above 1,350 USD, silver has a lot of room to catch up with gold. The gold/silver-ratio still trades just shy below 80 and remains far away from its long-term mean of around 65-67. Technically the triangle pattern should bring a breakout and spark a big move. Judging from the combination of fundamental, seasonal, sentiment and technical analysis the breakout will come on the upside. In that case, silver will likely rush towards 18,50 USD in the 3rd quarter and might even reach its high from summer 2016 at around 21,15 USD in the 4th quarter.

