


Bitcoin – First contrarian buy opportunity
In view of the sharp price declines, crypto investors are asking themselves these days whether the sector is already being stuck in a new “crypto winter” since almost seven weeks or whether the brutal pullback may have been just a healthy shakeout after all, laying the foundation for significantly higher prices in the medium term. Bitcoin – First contrarian buy opportunity.
Review
Since the new all-time high at US$64,895 on April 14th, prices for Bitcoin have come under tremendous pressure. Currently, Bitcoin is “only” trading around US$33,000 USD and thus almost 50% lower than in early April! While Ethereum and numerous small altcoins were just getting ready for the grand finale, Bitcoin´s increasing fatigue was gradually becoming more and more obvious. Finally, the spectacular crypto bull run ended on May 12th with Ethereum´s parabolic new all-time high at US$4,375.
Consequently, the entire sector topped, and a merciless wave of liquidation followed, taking pretty much everything down with it. Bitcoin only temporarily found a low at US$29,500, as this low was slightly undercut again on Monday 24th of June at US$29,250. Ethereum, on the other hand, did not find any support at all in recent weeks and kept falling towards a new low at US$1,711 this week. This low was well below the panic low of June 21st at US$1,896. In the last 4 days, however, crypto bulls are trying to get back on their feet posting a nice transitory bounce from extremely oversold levels (Bitcoin +17.91%, Ethereum +19.5%).
You have been warned
Six weeks ago, we had warned of an imminent pullback in a timely and pretty aggressive manner. However, the fact that the crypto sector then took such a heavy beating just a few days later surprised us, too. The enormous volatility in May was mainly due to the preceding excessive speculation with leverage and borrowed money. For example, positions worth more than US$8 billion were closed on numerous exchanges within a few minutes on May 19th through forced liquidations. Also, in the last week falling prices have yet created another wave of liquidations.
Overall, bitcoin has at least managed to trade sideways between roughly speaking US$29,000 and US$41,000 in the last five weeks. However, things have not calmed down (yet). The bottom line is that since the beginning of the year, Bitcoin has experienced turbulent ups and downs and a small gain of about 20%.
Technical Analysis For Bitcoin in US-Dollar
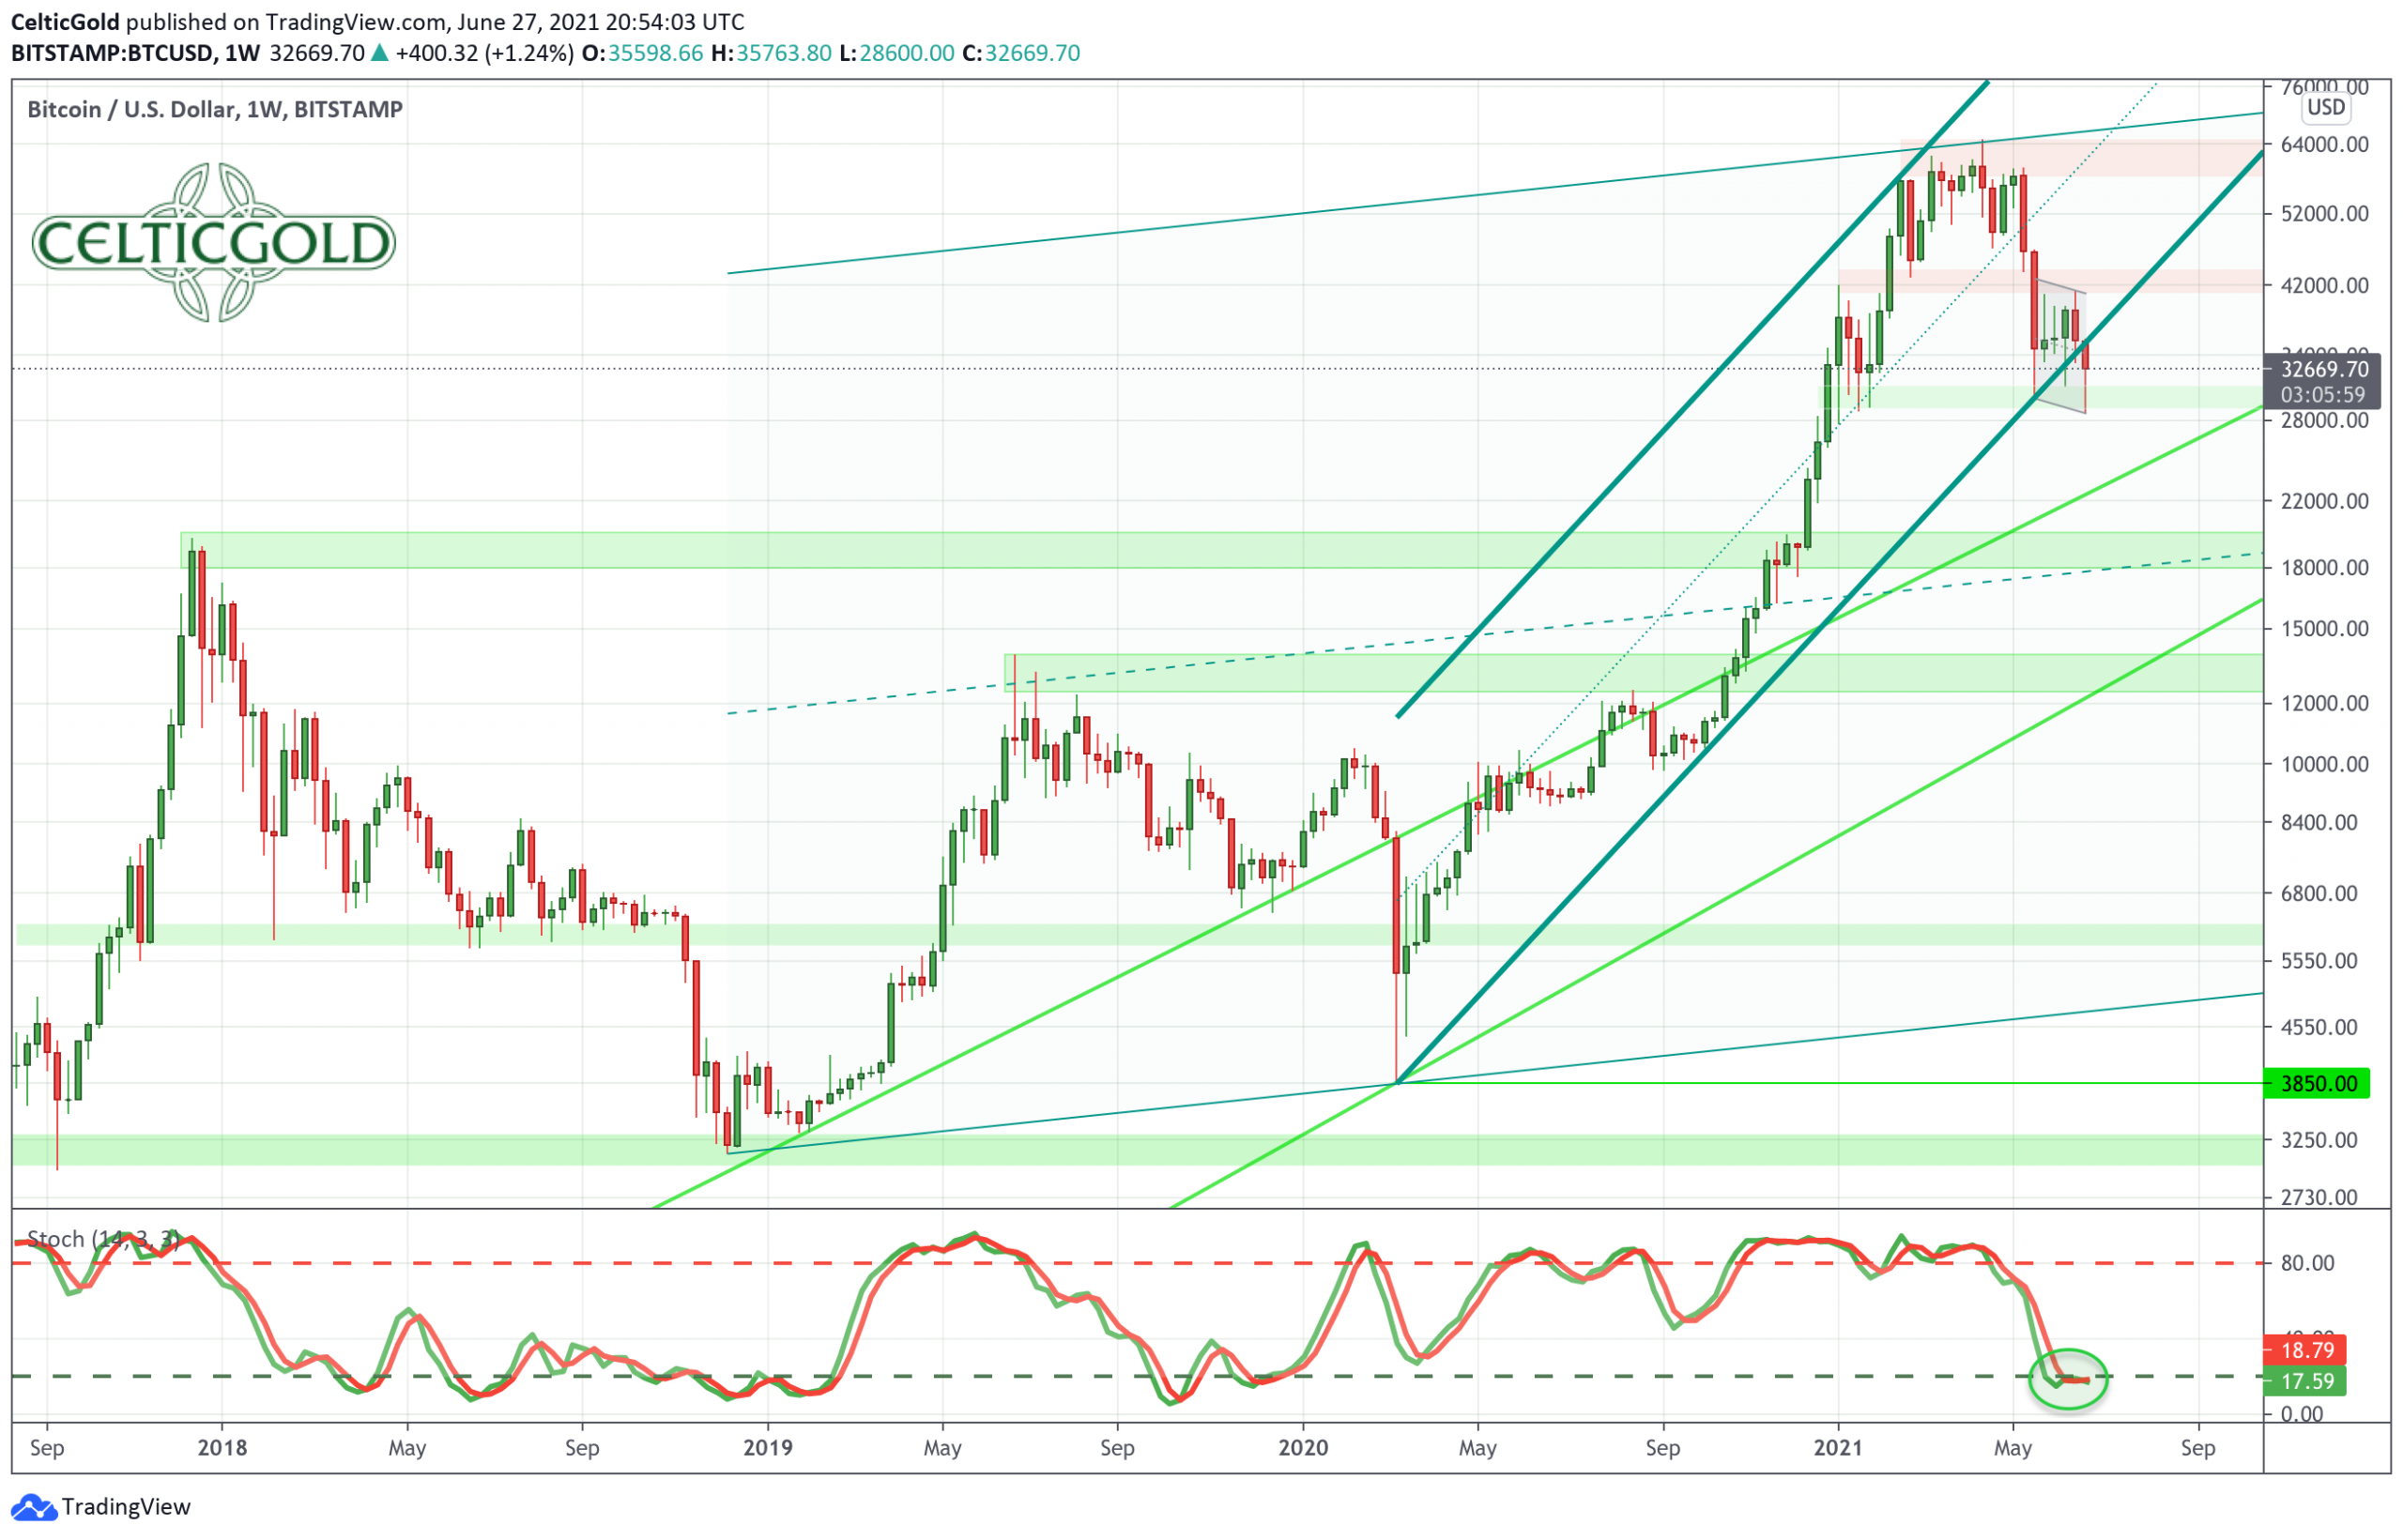
Bitcoin in USD, weekly Chart as of June 27th, 2021. Source: Tradingview.
On the weekly chart, bitcoin temporarily slipped out of its major uptrend channel to the downside. However, with a strong bounce it managed to return to this trend channel. If the bulls can actually defend this steep trend channel, prices below US$30,000 would not be seen in the future. Due to the violent correction in recent weeks, the stochastic oscillator is clearly oversold and would now offer more than enough room for a significant recovery.
Overall, bitcoin has been running sideways between US$29,000 and US$41,000 on its weekly chart for several weeks in a very volatile fashion. However, the up-trend is still intact. Hence in case of doubt, the bulls will now at least rehearse a larger recovery.
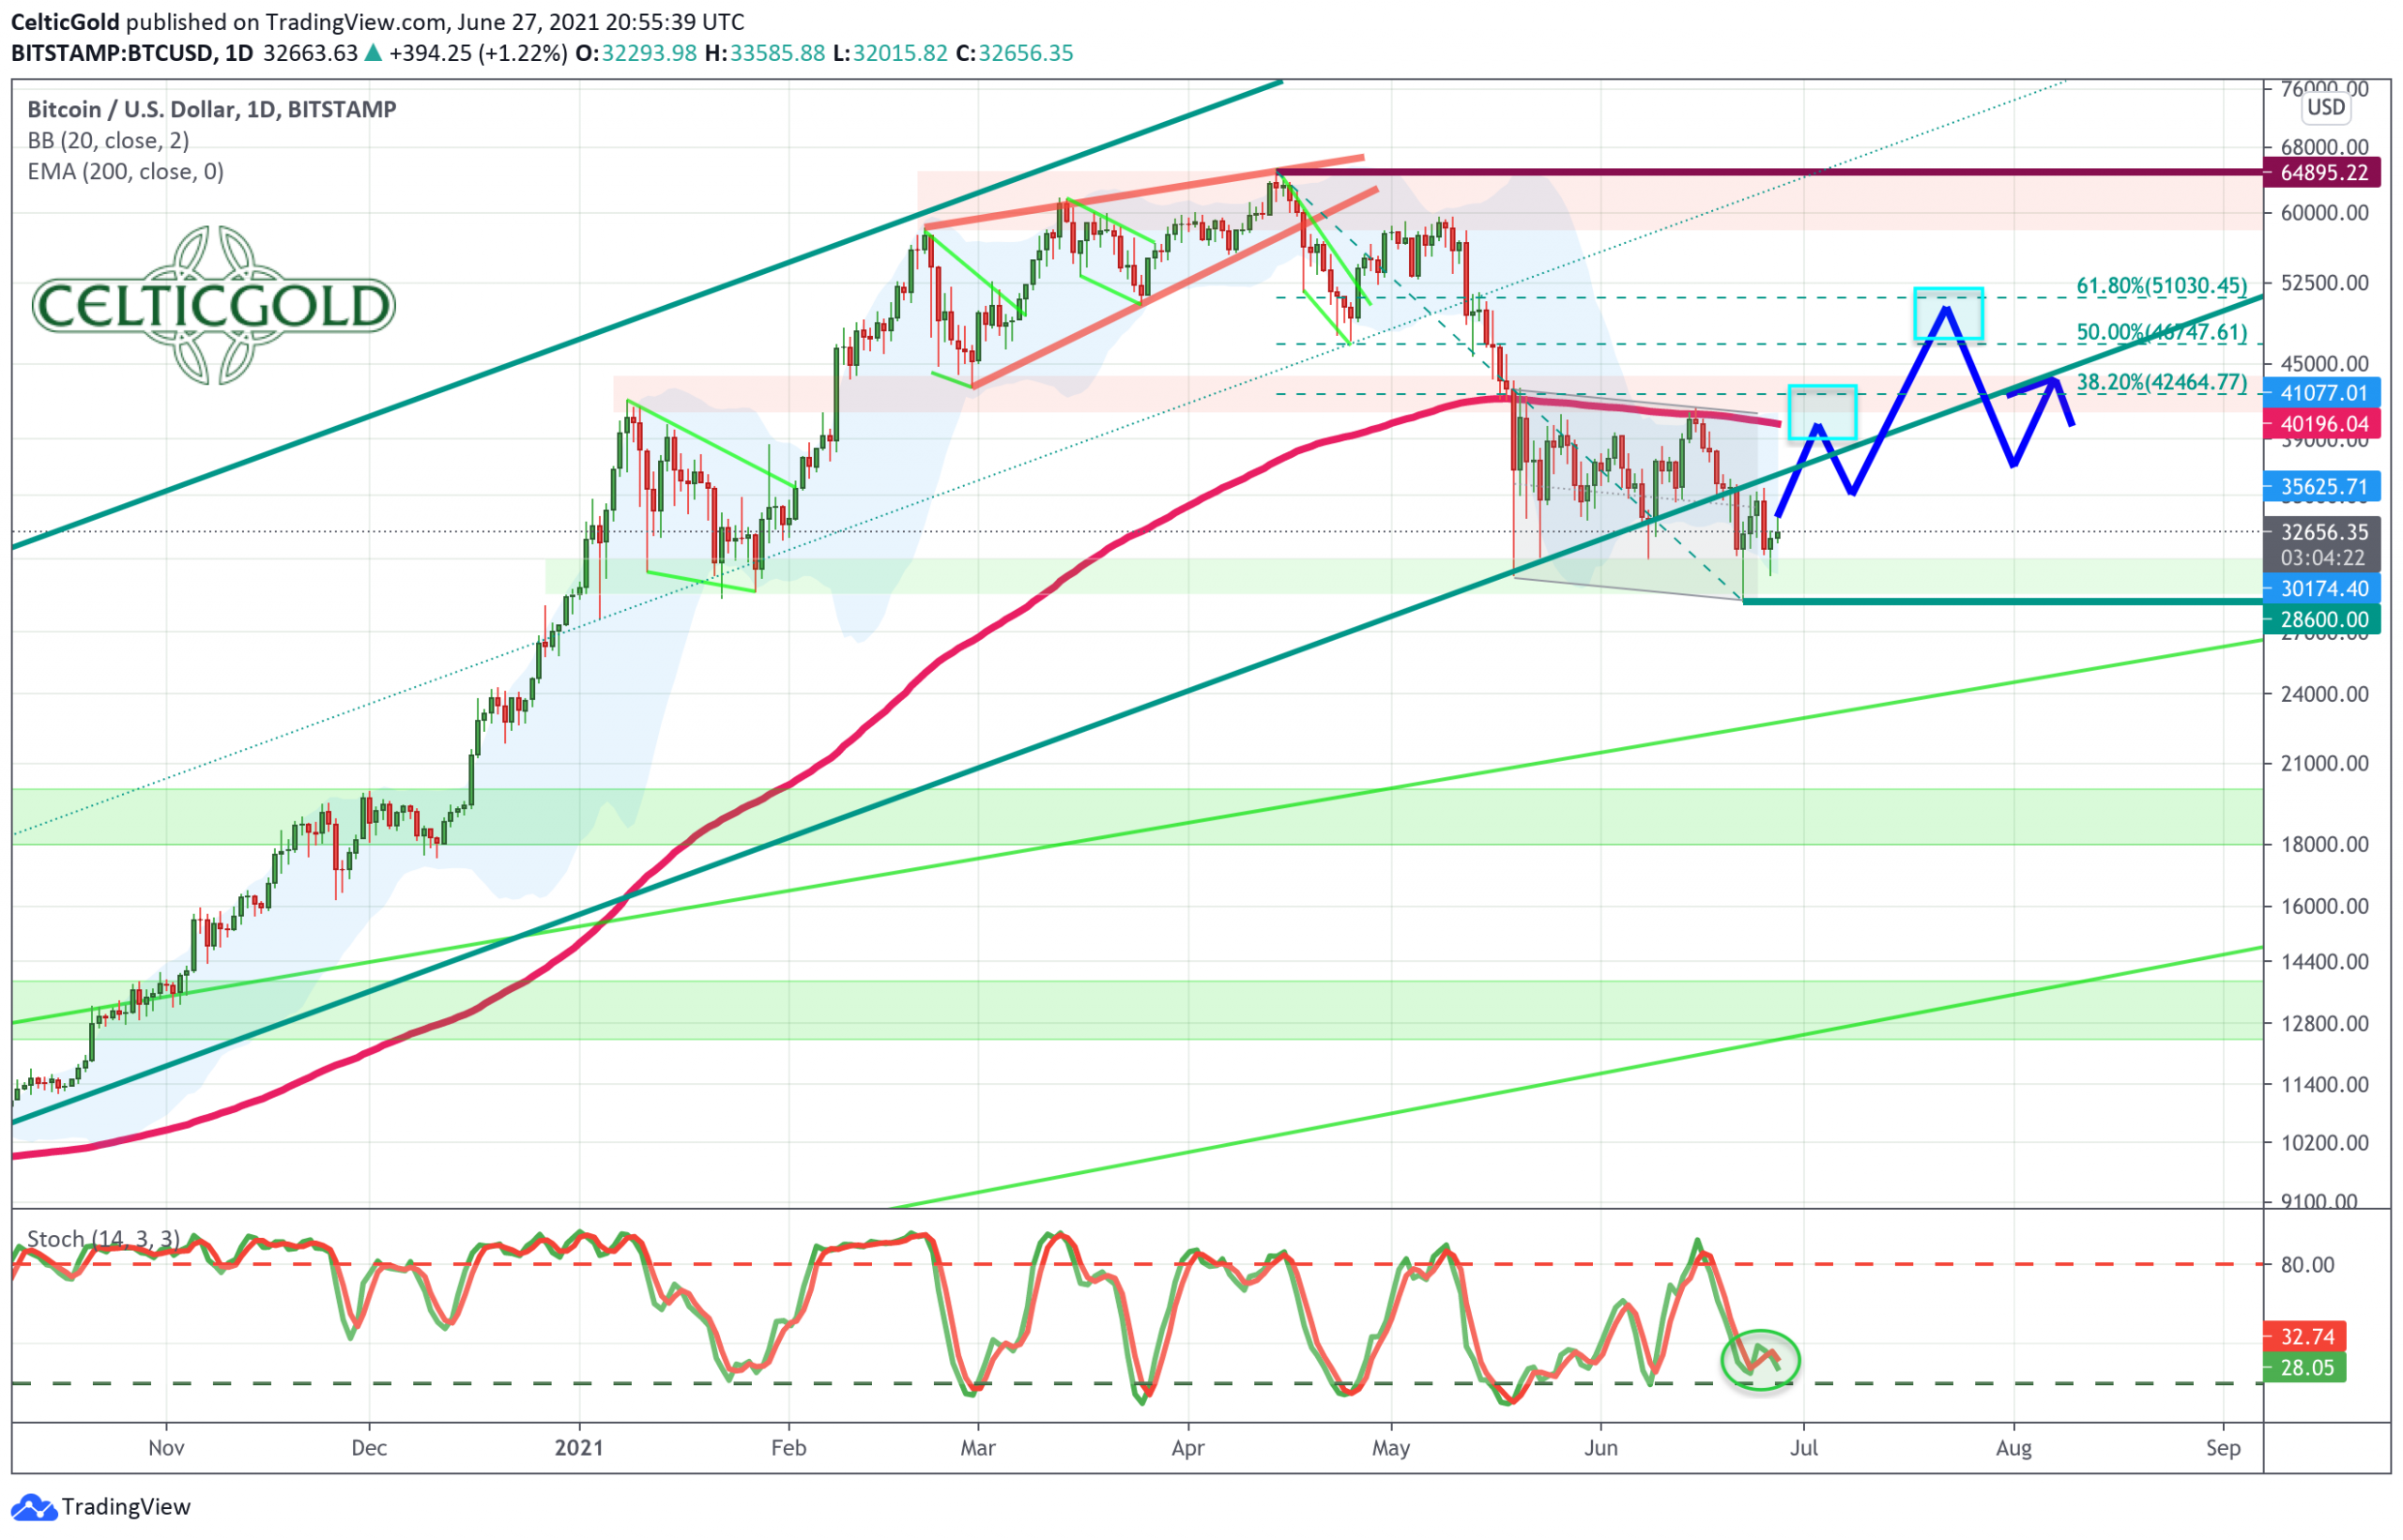
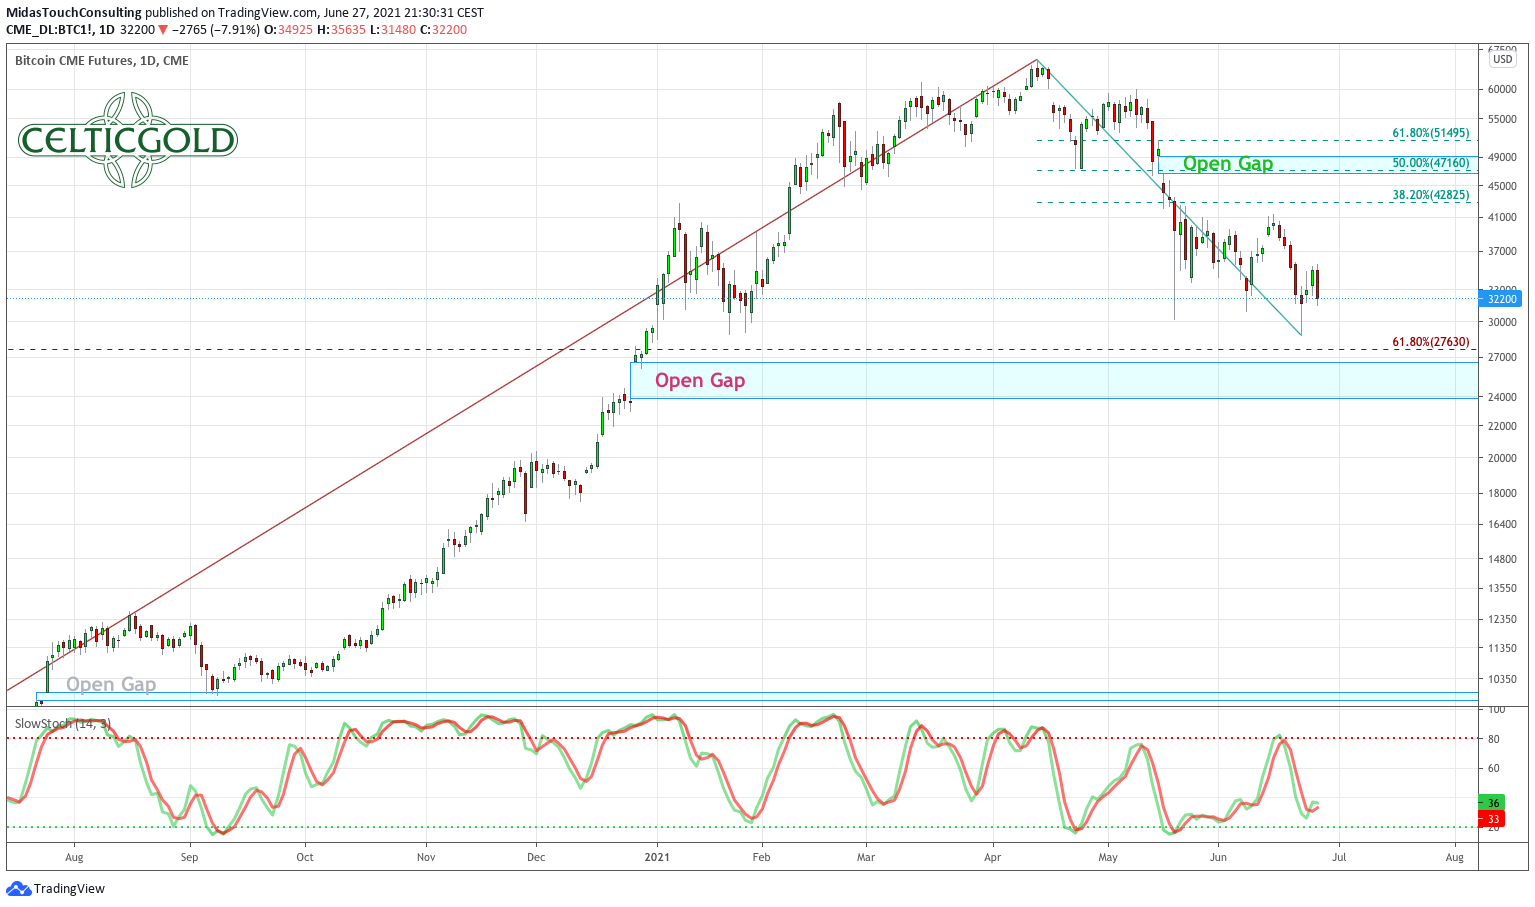
Bitcoin in USD, daily Chart as of June 27th, 2021. Source: Tradingview.
On the daily chart, bitcoin failed to regain the lost exponential 200-day moving average (US$40,200) in recent weeks. As the last attempt failed on June 15th, the bears directly counterattacked. Due to this violent price slide in the order of US$11,000 within only eight days and the resulting extreme oversoldness, the balance of power may now have shifted again in favor of the bulls. The stochastic oscillator for example is not oversold but showing diverging higher lows. Nevertheless, the long wick of Tuesday’s daily candle suggests a trend reversal.
In summary, the daily chart is still in the short-term downtrend and thus actually bearish. However, the rapid recovery back to US$35,500 within three days allows us to rate the daily chart as slightly bullish. With the Fibonacci retracements, two realistic recovery targets between US$40,000 and US$42,000 as well as between US$49,000 and US$51,000 can be defined. Whether the strength of the bulls will be sufficient towards the second target, however, cannot be said at the moment. If Bitcoin drops below US$30,000 once again, we must assume that lower lows are still to come.
Sentiment Bitcoin – First contrarian buy opportunity
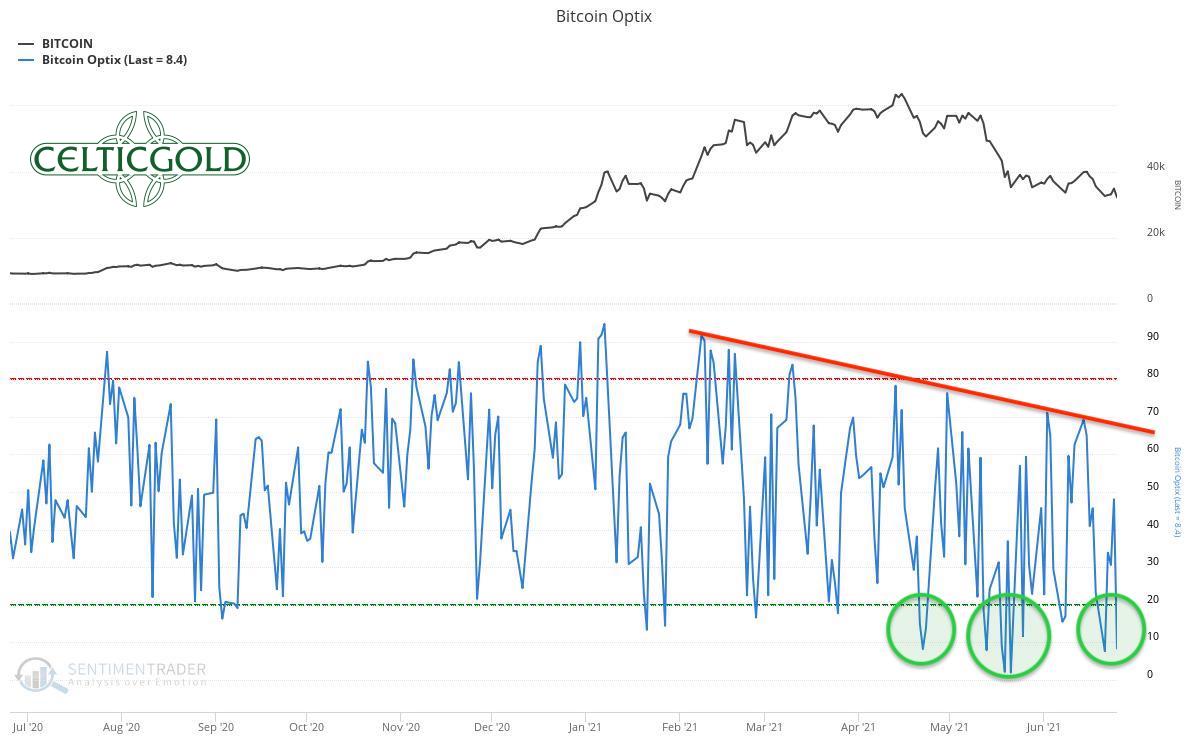
Bitcoin Optix as of June 27th, 2021. Source: Sentimentrader
The short-term sentiment data for the Bitcoin reached the panic zone again.
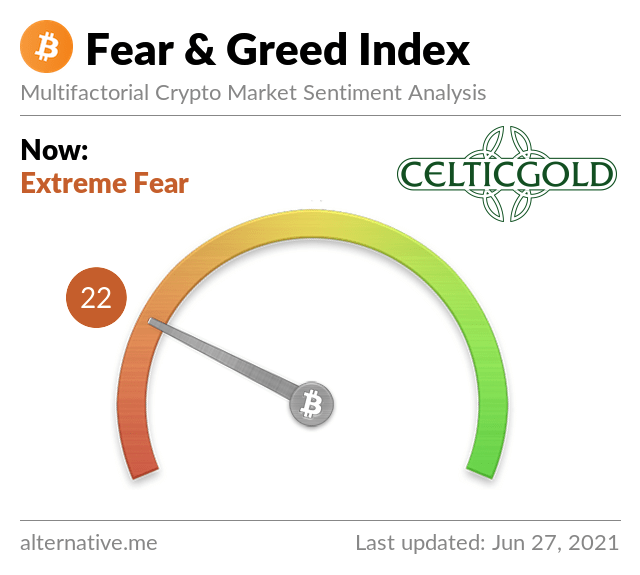
Crypto Fear & Greed Index as of June 27th, 2021. Source: Crypto Fear & Greed Index
Alternative.me’s much more complex and rather long-term sentiment model has been reporting extreme levels of fear in the crypto sector for weeks now. At the start of the week, the model recorded rarely seen lows around 10. Currently its sitting at 22. The panic in the sector might thus have reached an absolute extreme and short-term top.

Crypto Fear & Greed Index long-term as of June 27th, 2021. Source: Sentimentrader
In the big picture, the mood is beaten down and depressive.
Overall, the quantitative sentiment analysis thus provides clear contrarian buy signals. Of course, the mood can still fall further, but a contrarian entry opportunity looks just exactly like this!
Seasonality Bitcoin – First contrarian buy opportunity
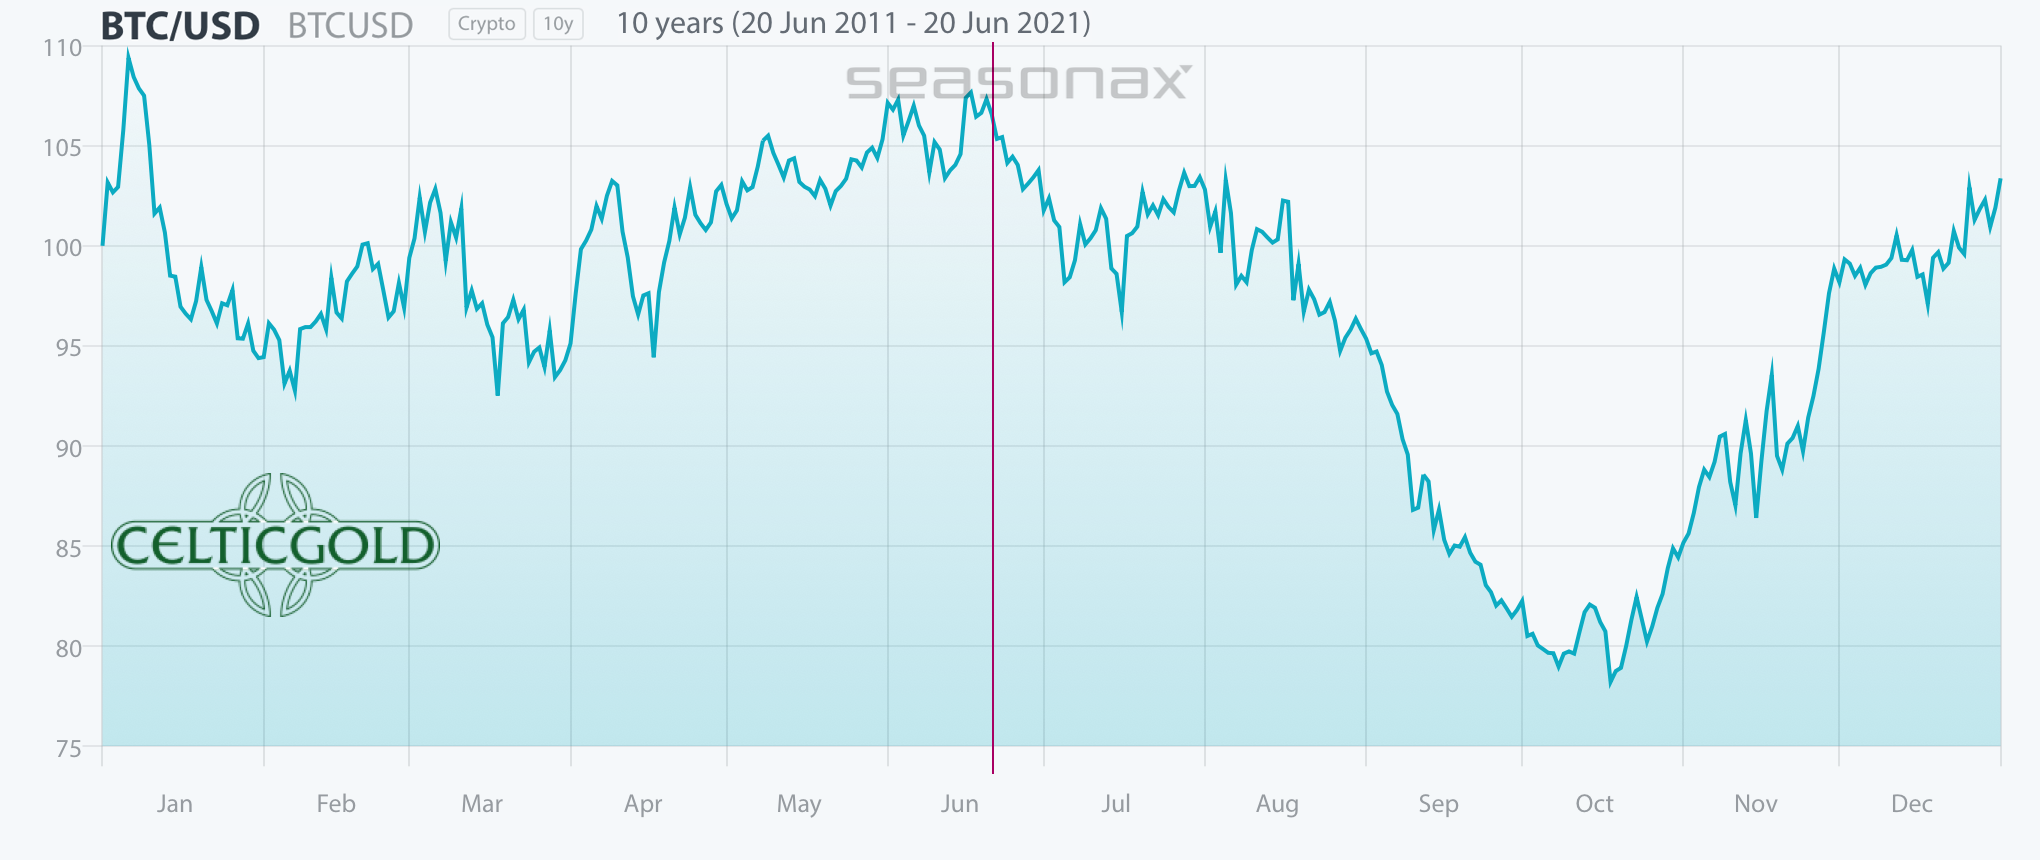
Bitcoin Seasonality. Source: Seasonax
Statistically, the typical sideways phase for bitcoin during spring ends at the beginning of May. This is often followed by a sharp rally into June and then a sell-off towards October. However, this year bitcoin only reached an important high on April 14th and has been sharply correcting since then. Obviously, the seasonal pattern doesn’t really match up with the price action so far this year.
In conclusion, seasonality is basically changing from neutral to red these days. However, the course of the year so far has not been in line with the seasonal pattern.
Sound Money: Bitcoin vs. Gold
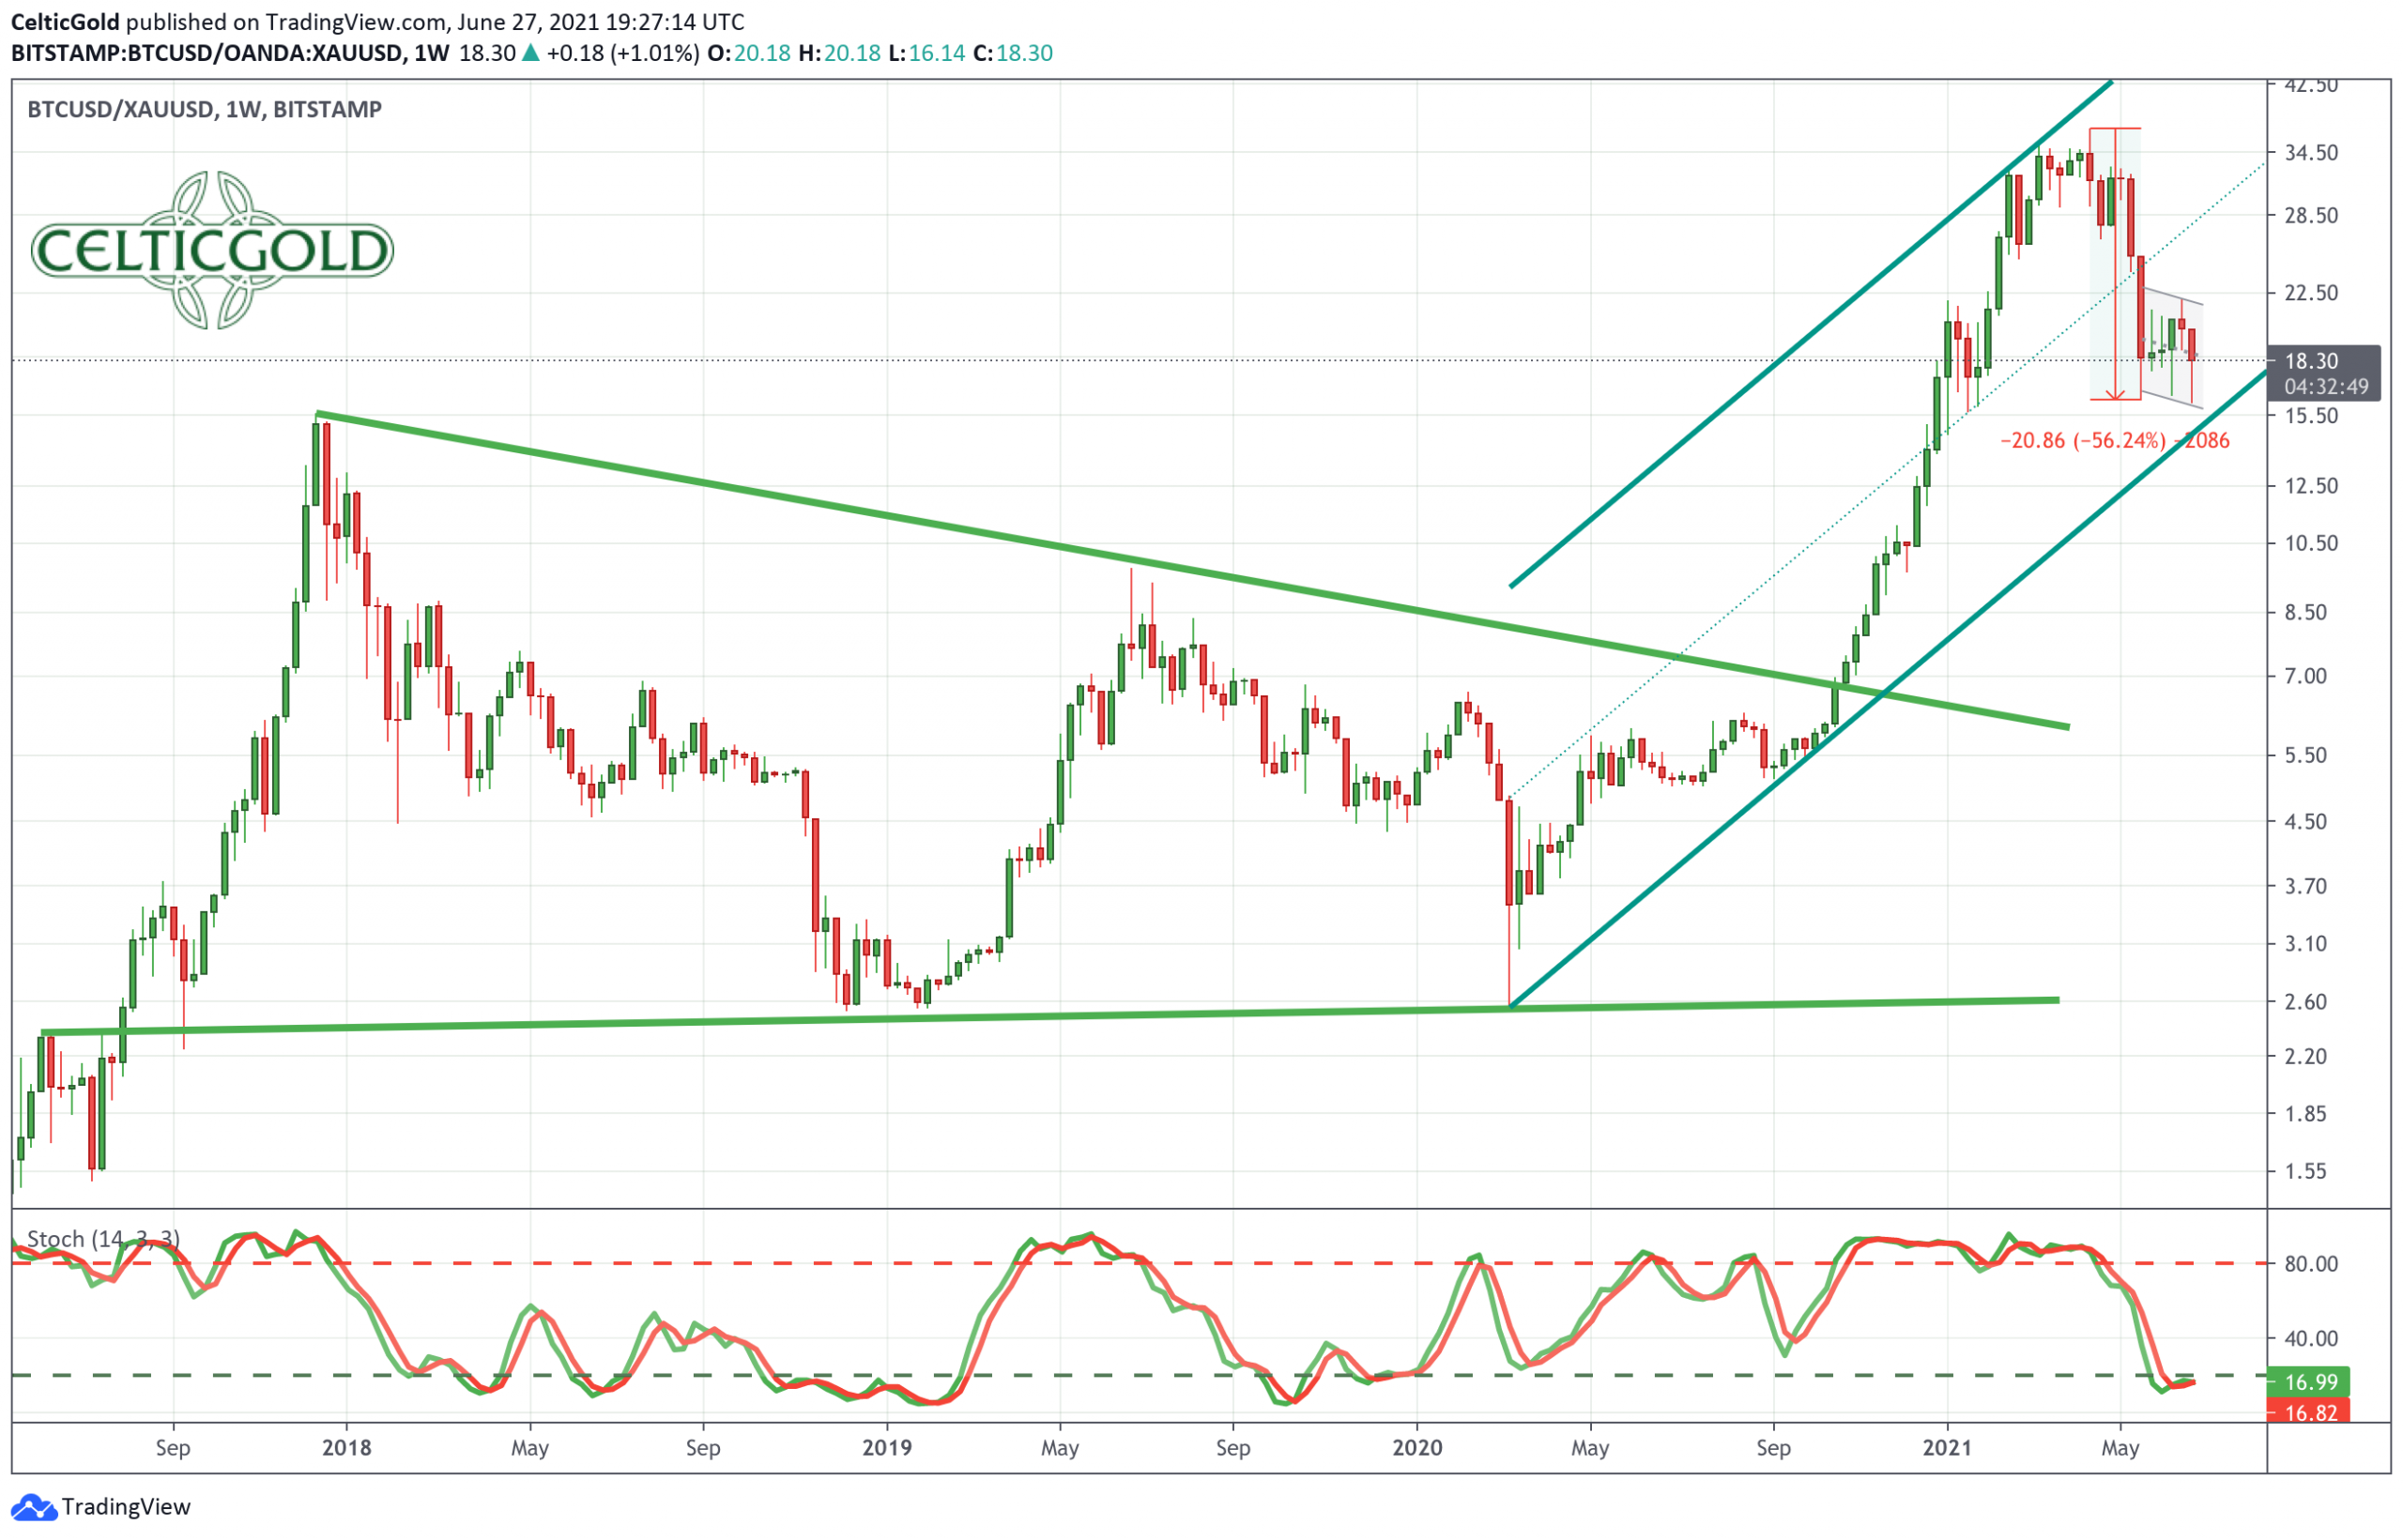
Bitcoin/Gold-Ratio as of June 27th, 2021.Source: Tradingview
At prices of approx. 33,000 USD for a Bitcoin and 1,780 USD for a fine ounce of gold, the Bitcoin/Gold-Ratio is currently trading at around 18.5. This means you currently have to pay slightly more than 18 ounces of gold for one Bitcoin. Put the other way, one troy ounce of gold currently costs about 0.053 bitcoin. Compared to the highs in March and April, bitcoin had initially lost over 56% against gold. However, in recent weeks, the Bitcoin/Gold-Ratio has been consolidating sideways. Looking at the heavily oversold stochastic, a recovery in favor of bitcoin is actually more likely on the short- to medium time horizon. The difficulty, however, is that any movement in bitcoin has a much stronger impact than the other way around due to the larger numbers.
You want to own Bitcoin and gold!
Generally, buying and selling Bitcoin against gold only makes sense to the extent that one balances the allocation in those two asset classes! At least 10% but better 25% of one’s total assets should be invested in precious metals physically, while in cryptos and especially in bitcoin one should hold at least between 1% and 5%. If you are very familiar with cryptocurrencies and bitcoin, you can certainly allocate much higher percentages to bitcoin on an individual basis. For the average investor, who is primarily invested in equities and real estate, a maximum of 5% in the still highly speculative and highly volatile bitcoin is a good guideline!
Overall, you want to own gold and bitcoin, since opposites complement each other. In our dualistic world of Yin and Yang, body and mind, up and down, warm and cold, we are bound by the necessary attraction of opposites. In this sense, you can view gold and bitcoin as such a pair of strength. With the physical component of gold and the pristine digital features of bitcoin you have a complementary unit of a true safe haven for the 21st century. You want to own both! – Florian Grummes
Macro Outlook and Crack-Up-Boom Update
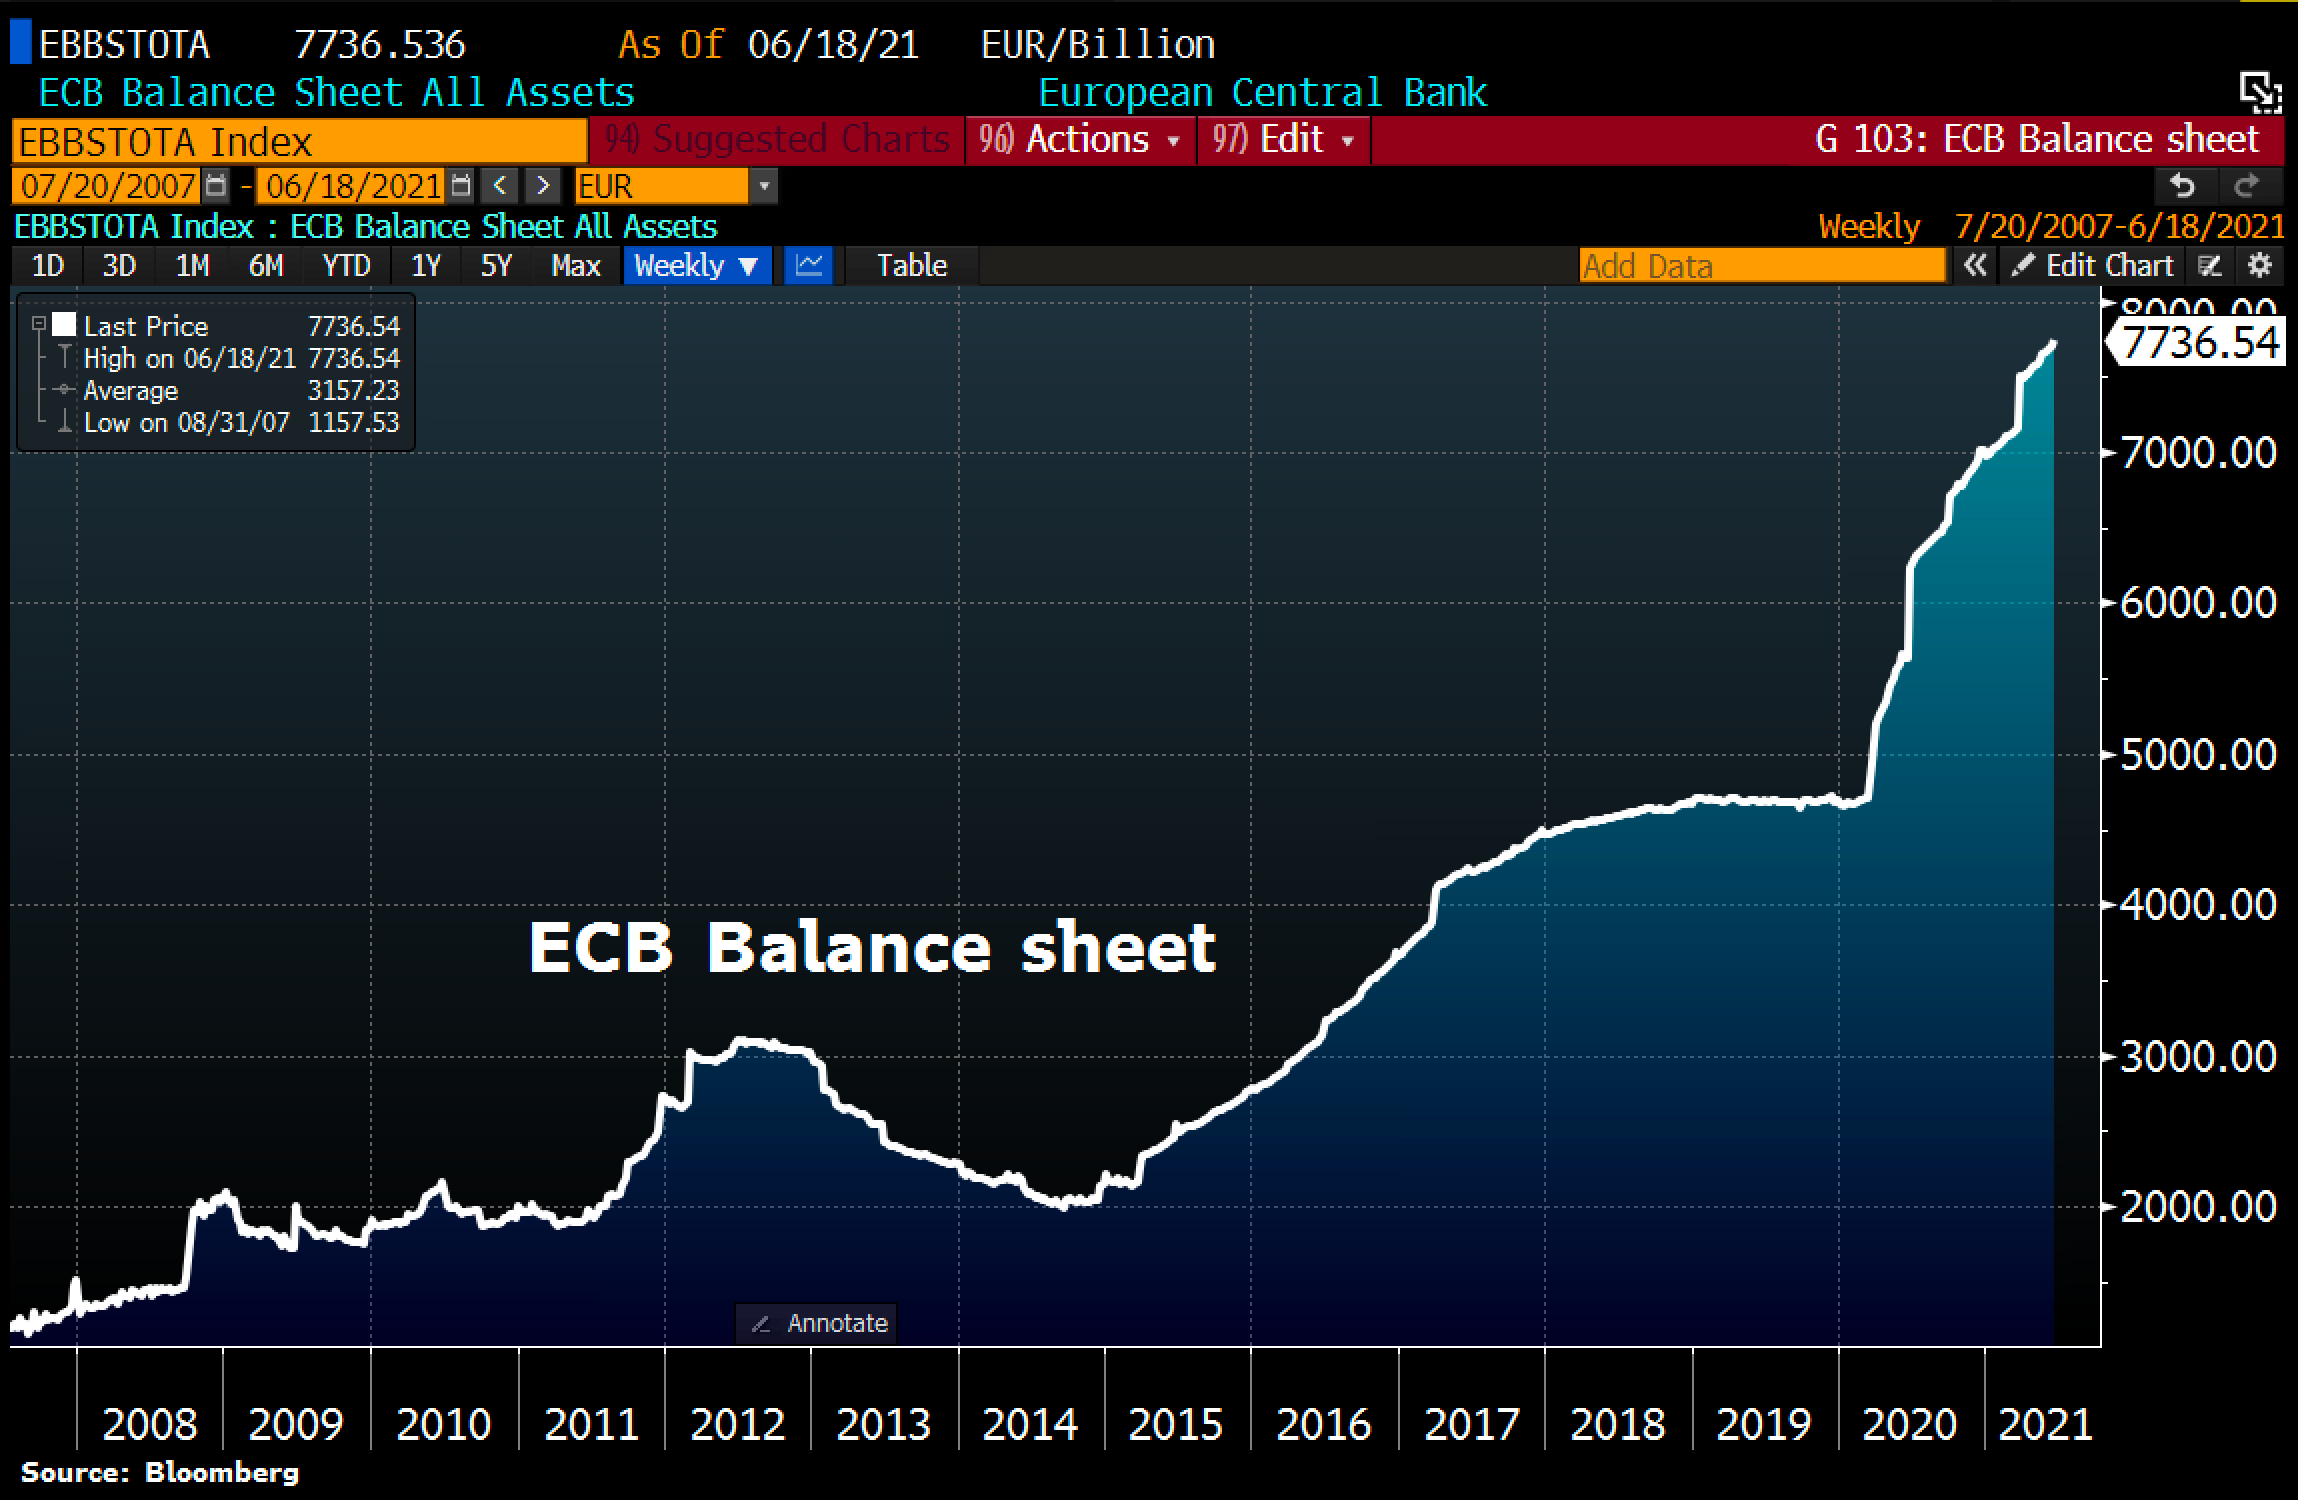
ECB Balance sheet as of June 22nd, 2021. Source Holger Zschaepitz
The ECB expanded its balance sheet again by EUR 35.6 billion, so that total assets once again jumped to a new all-time high of EUR 7,736.5 billion last week. The ECB’s balance sheet total is now equivalent to 77.7% of the eurozone GDP.
However, after the FED on the other side of the Atlantic mentioned 10 days ago that they plan to raise interest rates in two years, there was a significant pullback, especially in the commodity and precious metals markets due to a stronger U.S. Dollar. The crypto markets also sold off significantly again as a result.
Actually, it is a bad joke that financial markets are trembling before a possible US interest rate hike in 2023. However, the global financial drama is now completely dependent on the central banks. They use their unprecedented power to play their mass psychological games. So far, this has always worked out well somehow in the past decades. The fact that the required rescue sums have steadily increased over the past 23 years since the first hard intervention in 1998 (long-term capital management crisis) receives only a marginal note in the mainstream media. Even though, it is no longer millions and billions that are needed for rescue, but trillions and soon probably even quadrillions.
Imagine a free market
A truly free financial market, on the other hand, would have long since buried numerous unprofitable business models and probably driven interest rates worldwide to double-digit heights. But this must not and cannot be allowed to happen under any circumstances, as the drop height has become too high and public order could quickly be jeopardized during the overdue cleanup. Therefore, politicians and central bankers simply carry on doing what they are doing. As long as it just somehow works….

FED Balance sheet & US Home Prices as of June 23rd, 2021. Source: Holger Zschaepitz
The result is a rampant crack-up-boom in which everything becomes more expensive due to the expansion of the money supply. For example, U.S. house prices have been rising for years in tandem with the expansion of the U.S. money supply. Recently, a new all-time high was reached in tandem.

Commodities/Equities-Ratio as of June 21st, 2021. Source: Incrementum AG 2021 and Crescant Capital
In the big picture, the current pullback in commodities, precious metals and cryptocurrencies should therefore only represent a small dent. Soon, the Fed will have to row back its interest rate statements. Otherwise, the real estate market in the US will quickly get cold feet. A departure from the constant expansion of the currency supply had not been announced anyway.
Since global economic growth is on extremely shaky ground and was only artificially generated with the help of global central bank acrobatics, there is no escape from the devaluation policy. All central banks are competing with each other, forcing millions of investors in all countries of the world to flee into real assets (even outside the fiat system). This flight movement will only accelerate. In the short term, however, one is quite well advised to act cautiously and wait and see, because there are still no clear signs of an end to the temporary “risk-off mode”.
Conclusion: Bitcoin – First contrarian buy opportunity
The negative coverage of Bitcoin and Ethereum reached an absurd peak at the start of the week. Of course, the pullback in recent weeks has been hard and deep. But then, that has always been the case in the highly volatile crypto sector. Most weak hands may have been thrown off initially during the 56% setback. The extremely high level of panic (as seen in the sentiment data) now clearly point to a fast approaching turning point.
Presumably, the recovery might has already started on Monday afternoon with the low at US$29,250. Possible recovery targets in the coming months are initially sitting around US$40,000 to US$42,000 and US$49,000 to US$51,000.
Bitcoin-Future in USD, weekly chart as of June 25th, 2021. Source: Tradingview
Depending on how the bitcoin will behave at these marks, it will be easier to assess whether the correction is already over or whether there will have to be another downward wave. In the worst case, there is still an open gap in the bitcoin future between US$24,000 and US$26,500. However, as the situation currently stands, the open gap in the Bitcoin Future on the upside in the range of US$46,650 to US$49,100 might be closed first.
Analysis sponsored and initially published on June 23rd, 2021, by www.celticgold.eu. Translated into English and partially updated on June 27th, 2021.
Feel free to join us in our free Telegram channel for daily real time data and a great community.
If you like to get regular updates on our gold model, precious metals and cryptocurrencies you can subscribe to our free newsletter.

