


Bitcoin – Crack-Up Boom Will Force The Breakout
Bitcoin prices have recovered quickly from the corona crash and are now poised to breakout and above the resistance zone around US$10,000. Slowly but surely Bitcoin is moving into the mainstream with Paul Tudor Jones publicly announcing that he holds nearly 2% of his assets in Bitcoin. The reason is simple: While central bankers around the world are quantitatively easing their fiat Ponzi schemes, Bitcoin has just recently experienced its third quantitative hardening (halving)! Looking at macro data as well as technical charts, it is obvious: Bitcoin – Crack-Up Boom Will Force The Breakout.
Review
In the last four weeks, Bitcoin repeatedly bounced off the resistance zone around the psychological level of US$10,000. At the same time, a series of higher lows has formed, as the respective pullbacks have been bought back at higher levels. Overall, prices for one Bitcoin have just been consolidating around the US$10,000 mark since the end of April. Basically, this consolidation is bullish. The overbought situation due to the V-shaped recovery following the corona crash has so far been worked off with a sideways consolidation on high levels. A breakout above US$10,000 still has a significantly increased probability.
Technical Analysis For Bitcoin – Crack-Up Boom Will Force The Breakout
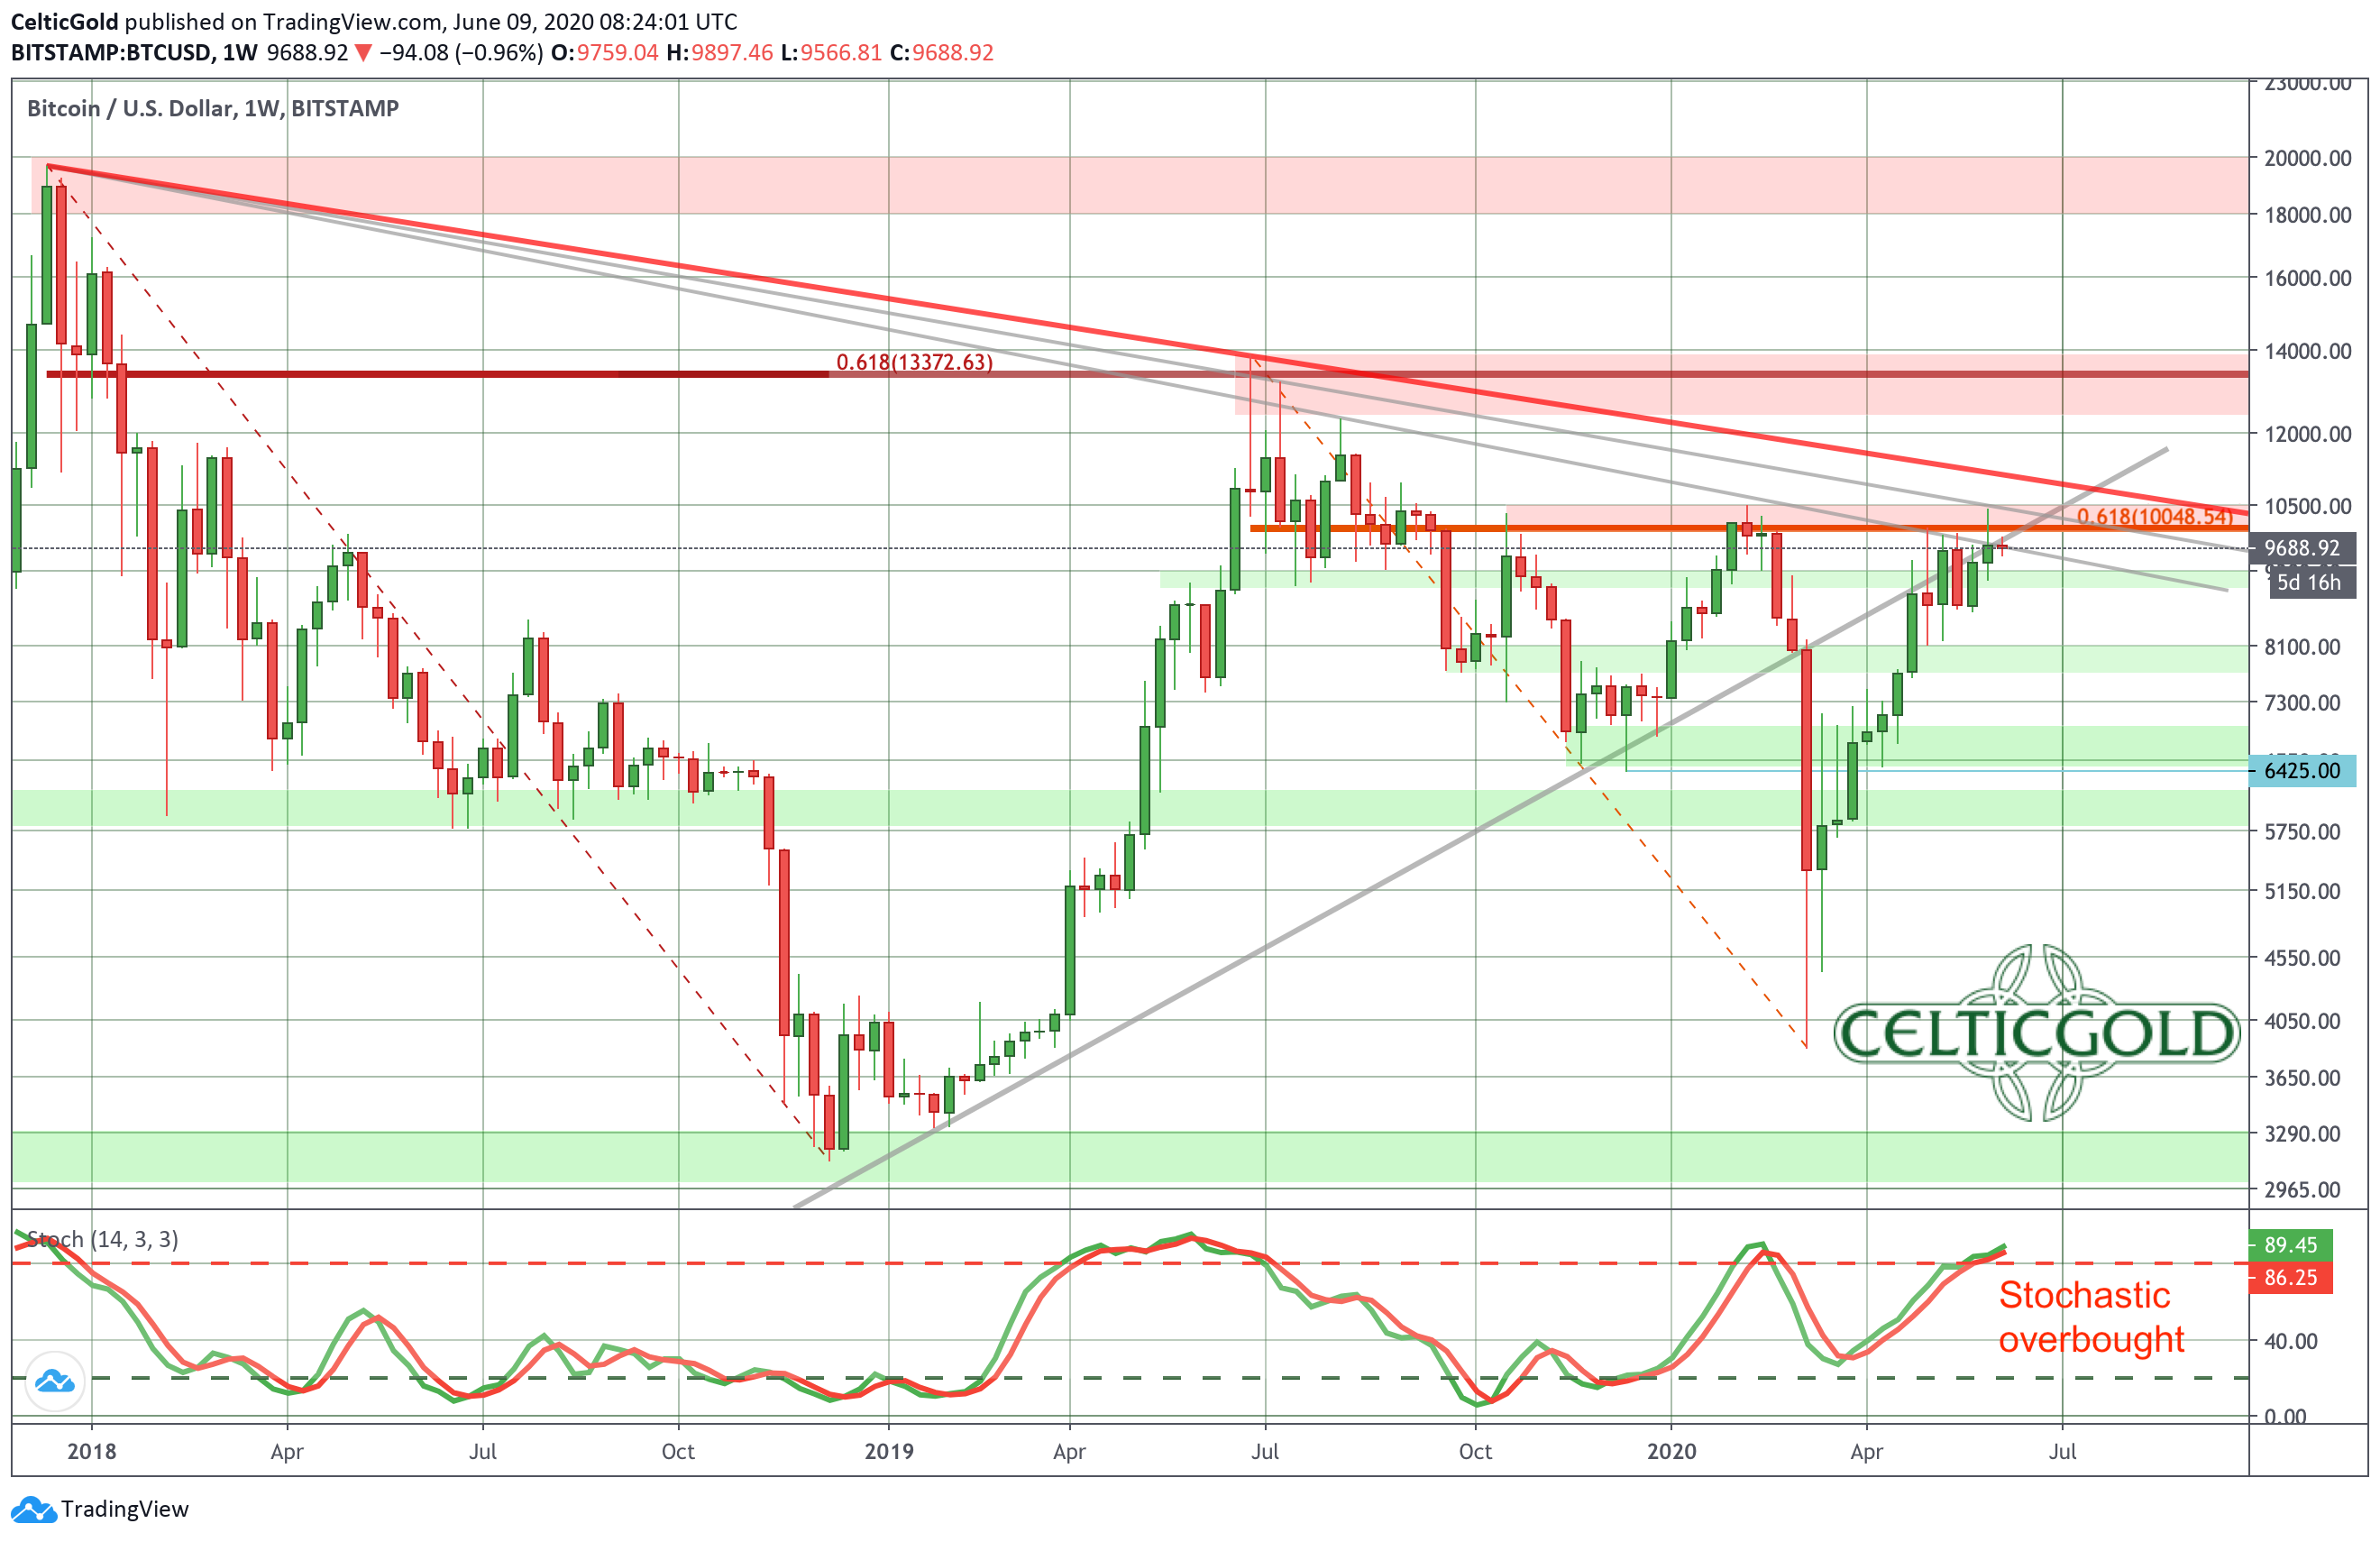
Bitcoin Weekly Chart as of June 9th 2020, Source: Tradingview
After the sharp drop at the beginning of the Corona crisis, Bitcoin quickly recovered to pre-crisis levels and regained its long-term upward trend-line. However, between US$10,000 and US$10,500, the bulls hit a strong resistance zone. For example, the 61.8% retracement of the entire downtrend since last summer sits around US$10,048. Also, and probably even more importantly, the downtrend line since the all-time high in December 2017 is waiting in this zone too! Depending on which highs you connect, Bitcoin has either already crossed this downtrend line or is about to do so or still has to clear the US$11,000 mark.
At the same time, the slow stochastic oscillator on the weekly chart is somewhat unfavorable. It has reached its overbought zone and has little room left to run up further. The weekly chart is therefore rather overbought and from a risk/reward perspective not a buy. However, in the past the Bitcoin has often been able to transform into and even stronger and embedded uptrend from such an overbought situation. Overall, the stochastic oscillator has not yet turned down and therefore confirms the overall bullish momentum.
In summary, Bitcoin has been consolidating on the weekly chart since the beginning of May without any significant pullbacks. The stochastic is still bullish and a full breakout above all three variants of the downtrend line seems to be only a matter of time.
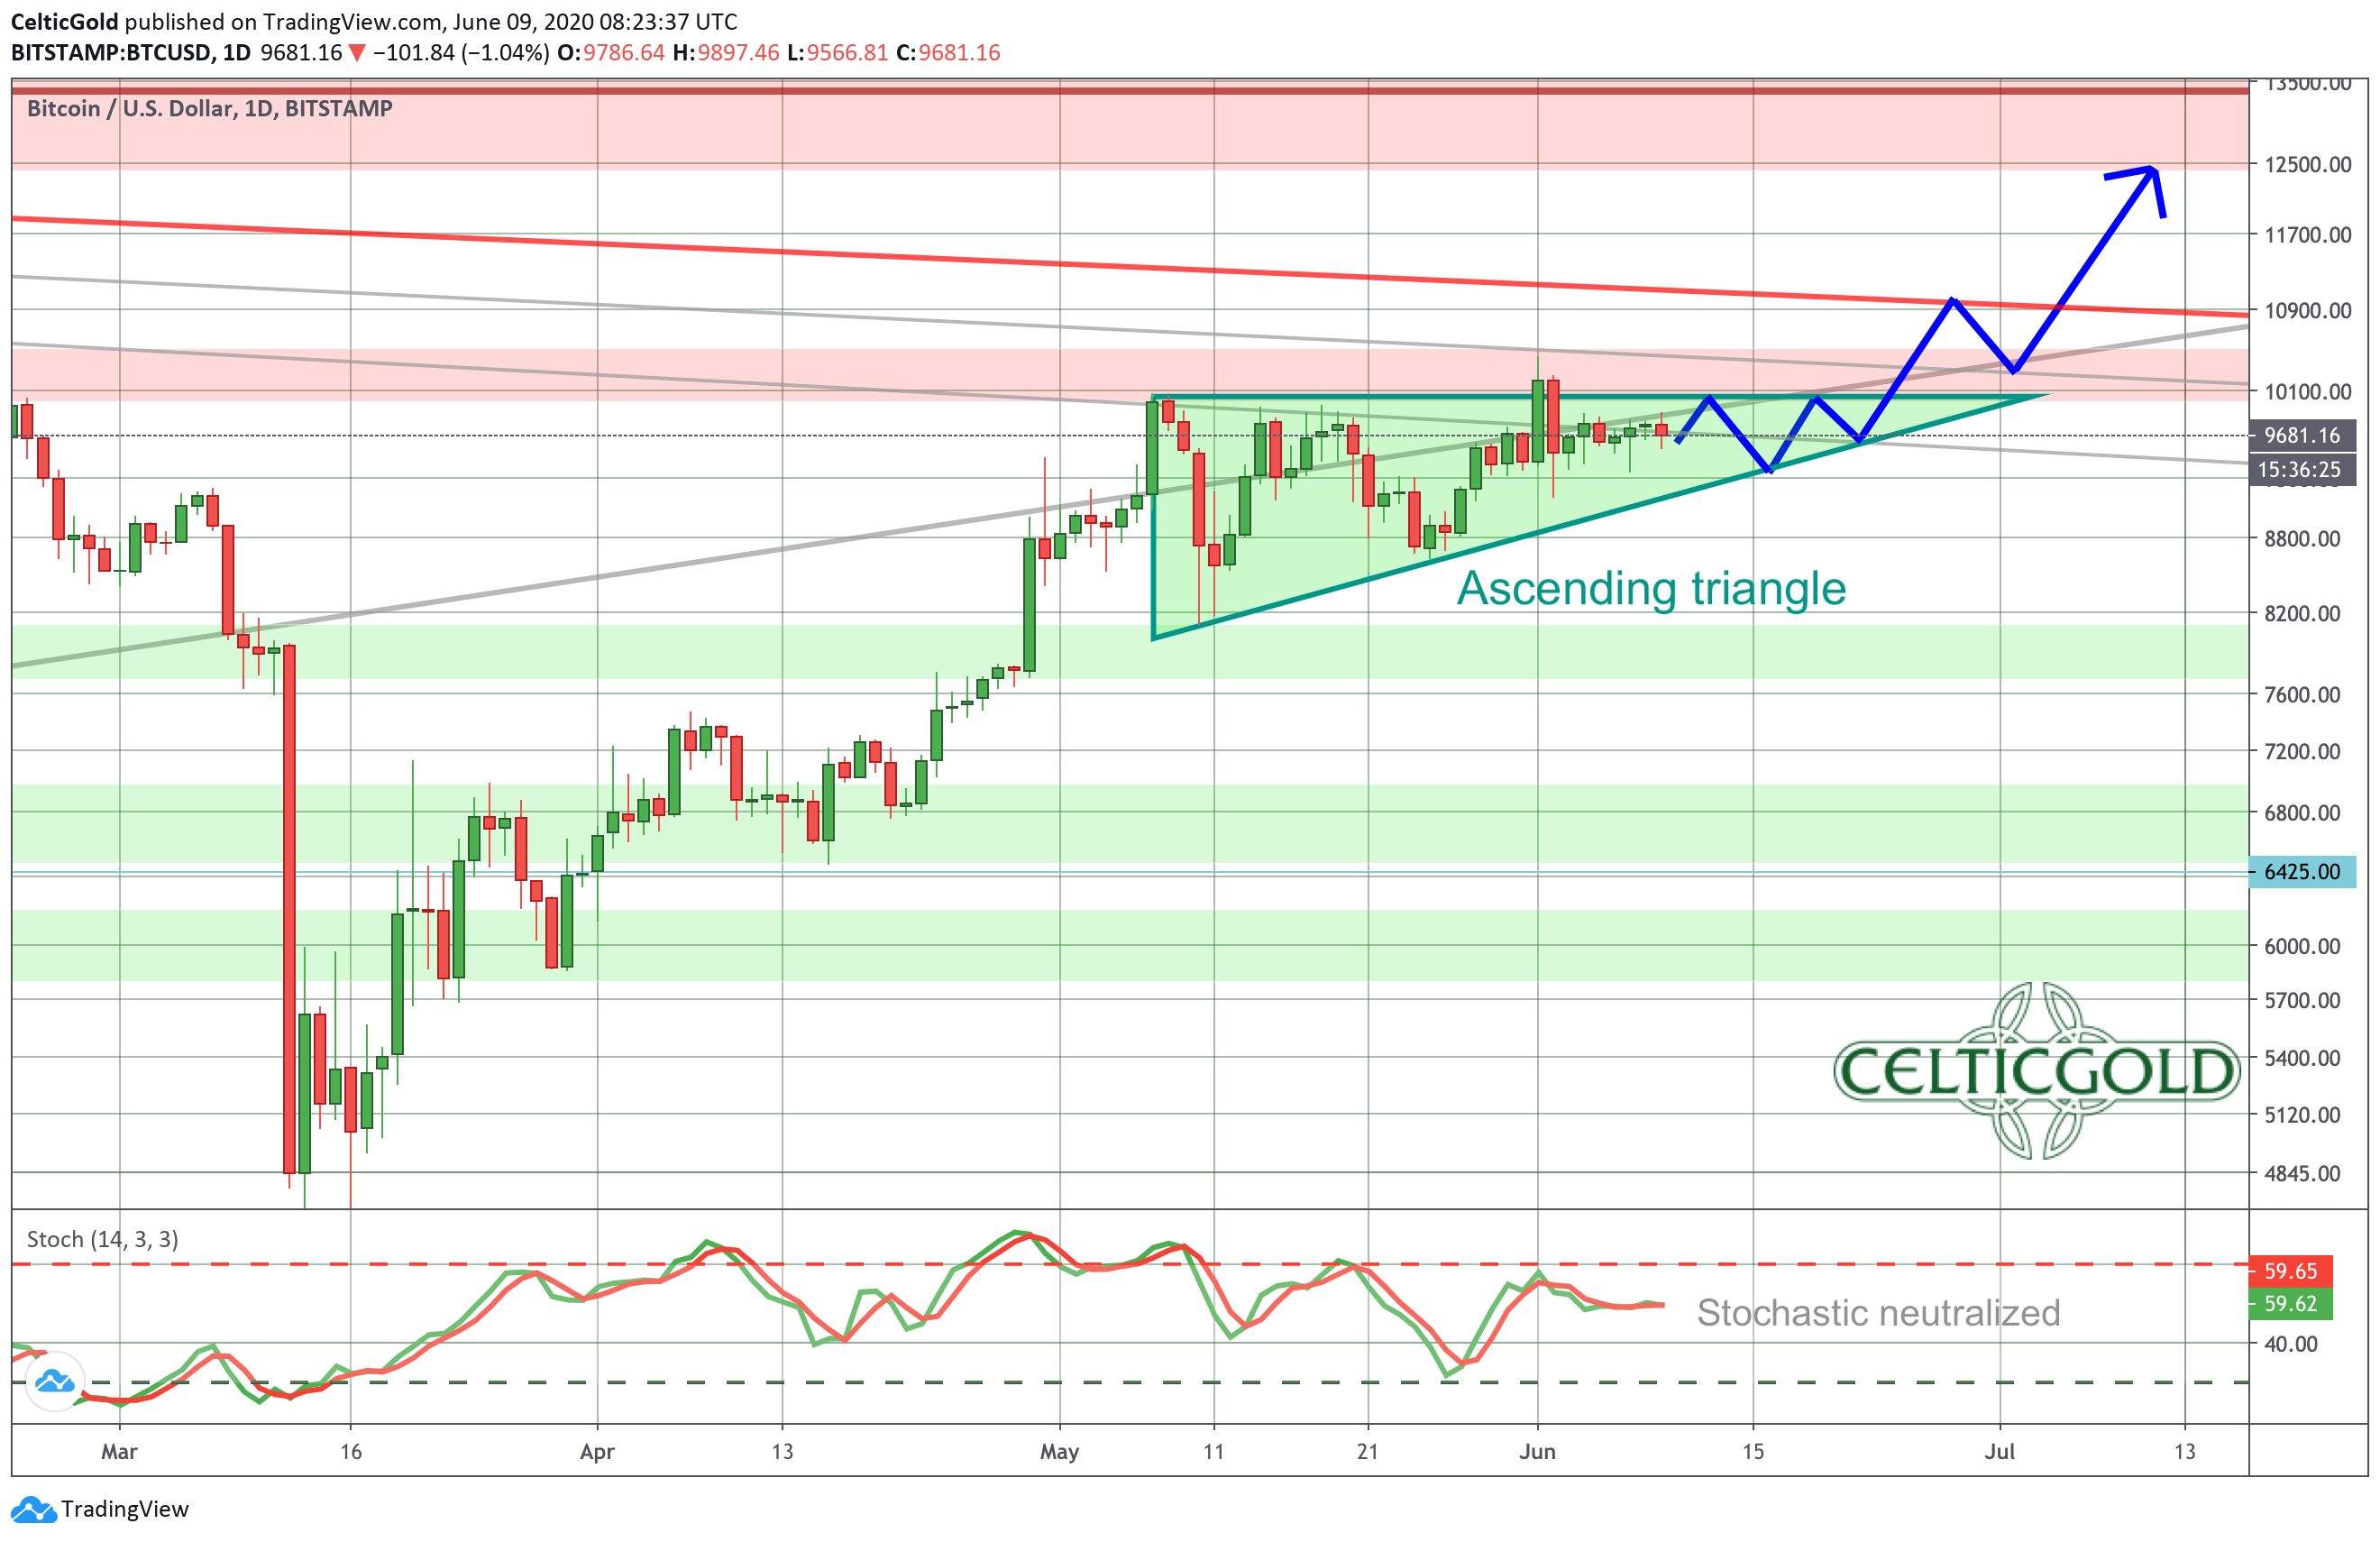
Bitcoin Daily Chart as of June 9th 2020, Source: Tradingview
On the daily chart, the consolidation since early May has taken the shape of an ascending triangle formation. Accordingly, further price declines to approx. US$9,000 on the downside are still possible. At the same time, the bulls are constantly attacking the horizontal resistance zone around US$10,000 since several weeks. A breakout to the upside would be equivalent to a liberation strike and could easily initiate a rapid rise to the next resistance zone between US$12,300 and US$13,800. In addition, the sideways consolidation has completely neutralized the overbought setup on the daily chart, so that the stochastic oscillator would again have enough room to continue the rally.
All in all, the daily chart makes a promising impression. The bulls are in the starting blocks. The only thing missing is a sustained breakout above the resistance zone around US$10,000. Possibly several more attempts will be necessary until a successful breakout. However, prices below US$9,000 are rather unlikely within the bullish triangle formation. Already a pullback to US$9,400 should be a buying opportunity. Only if the Bitcoin falls below US$ 8,600, the bullish bias will be completely lost.
Finally consider this: Markets often choose the most painful path for the largest possible number of participants. In that case, a final but sneaky sell off below the triangle support would take out most of the bulls and encourage all the bears. This extreme could then lead to a fast bounce and the breakout above US$10,000. However, this scenario is not based on technical evidence but on experience.
Commitments of Traders Report For Bitcoin
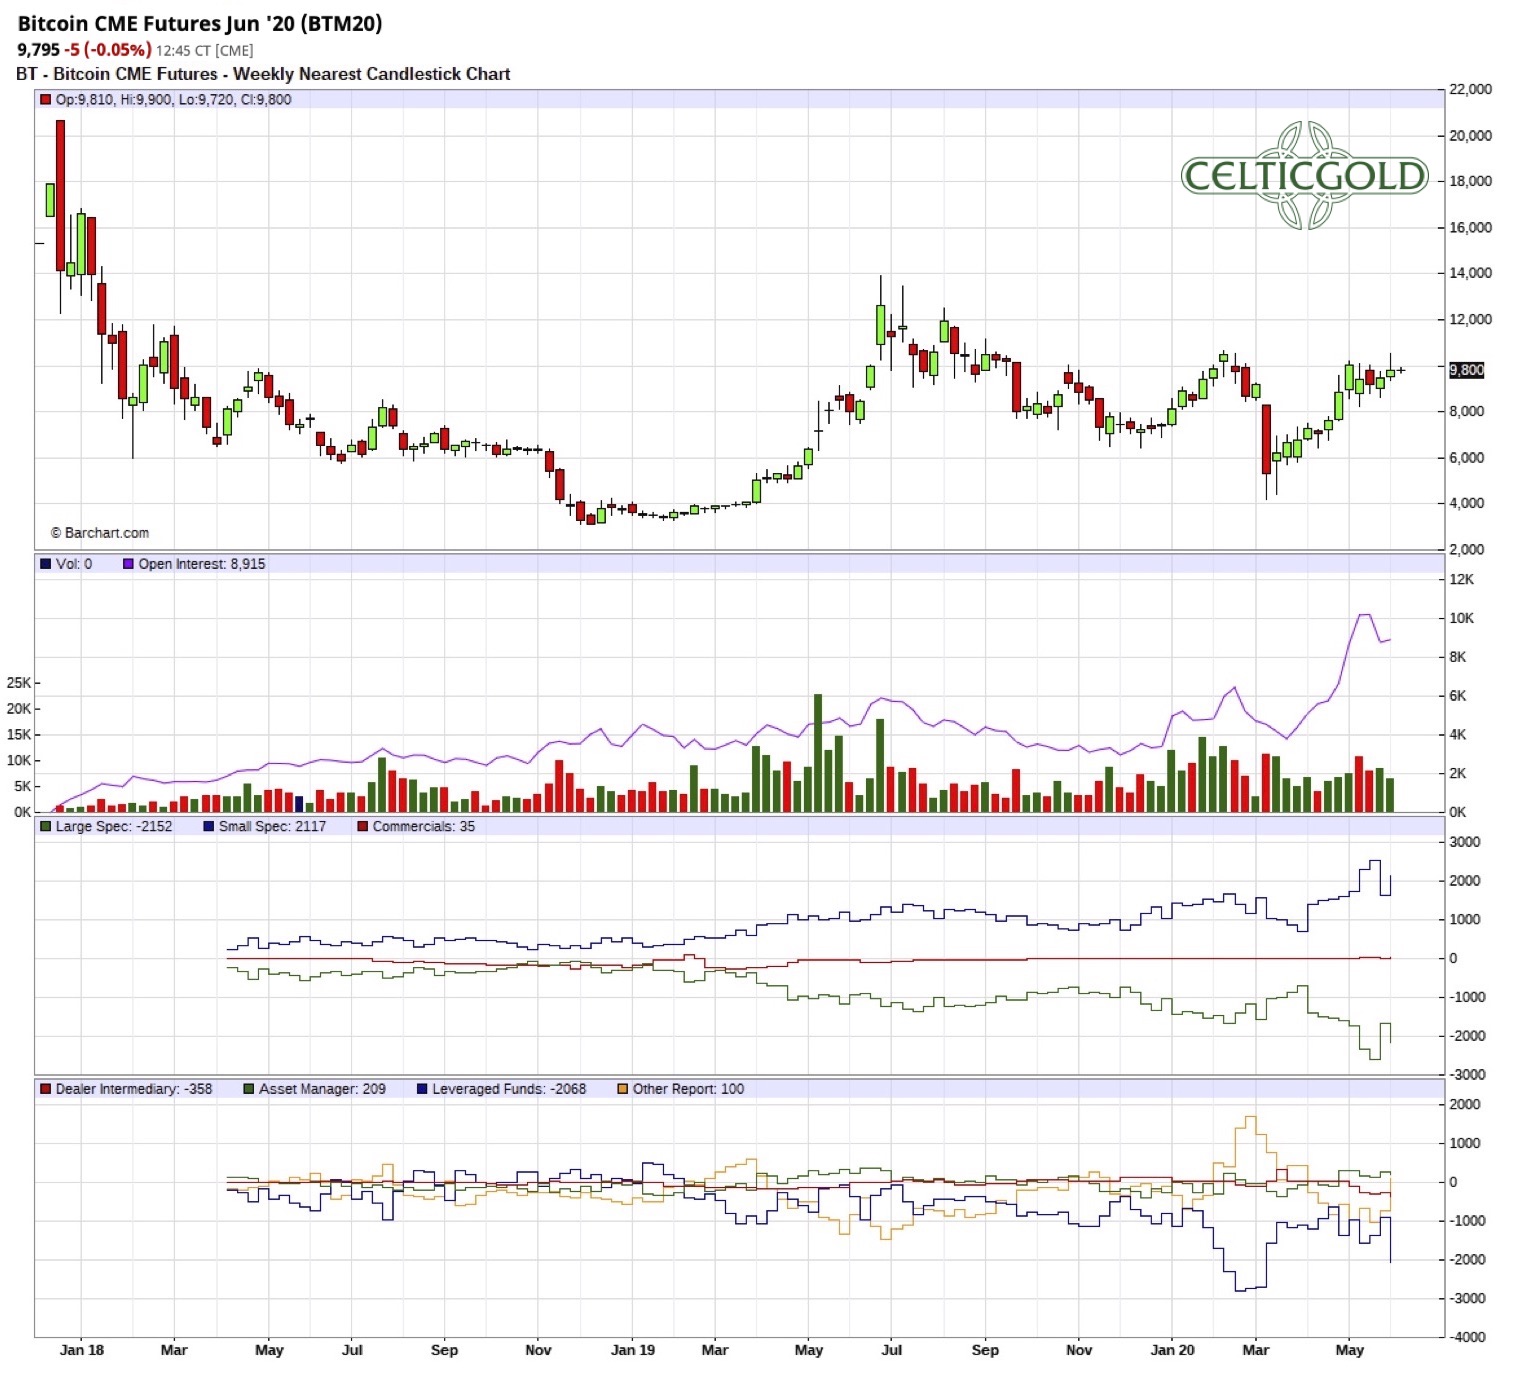
Bitcoin CME Future CoT-report, as of June 9th 2020. Source: Barchart
Although Bitcoin futures have only been trading since December 17th, 2017, the CoT report (Commitment of Trades), which is published every Friday evening, offers an interesting overview of the positions and is definitely a helpful tool to analyze the Bitcoin market. Note that the bitcoin future with the symbol XBT is trading at the CBOE, while the symbol BTC refers to the CME.
With the V-shaped recovery after the Corona Crash, the CoT report had already presented itself at neutral levels in early April. Since Bitcoin is now trading around US$600 higher, there were further shifts in the report. The significant increase in open interest is particularly noteworthy. Accordingly, the Bitcoin futures market is apparently being populated by significantly more market players than before the Corona crisis.
Among the three different groups of participants, the large speculators are quite engaged on the short side, while the small speculators again hold a pretty high long position. Looking at the detailed CoT Financial Traders Report, it is above all the “leveraged funds” that have again built up a high short position. The subgroup of the so-called “Other Reportables” on the other hand is currently positioned more or less neutrally.
However, according to the current CoT Report, there are no extreme positions, so that overall one can speak of a neutral set up.
Sentiment Bitcoin
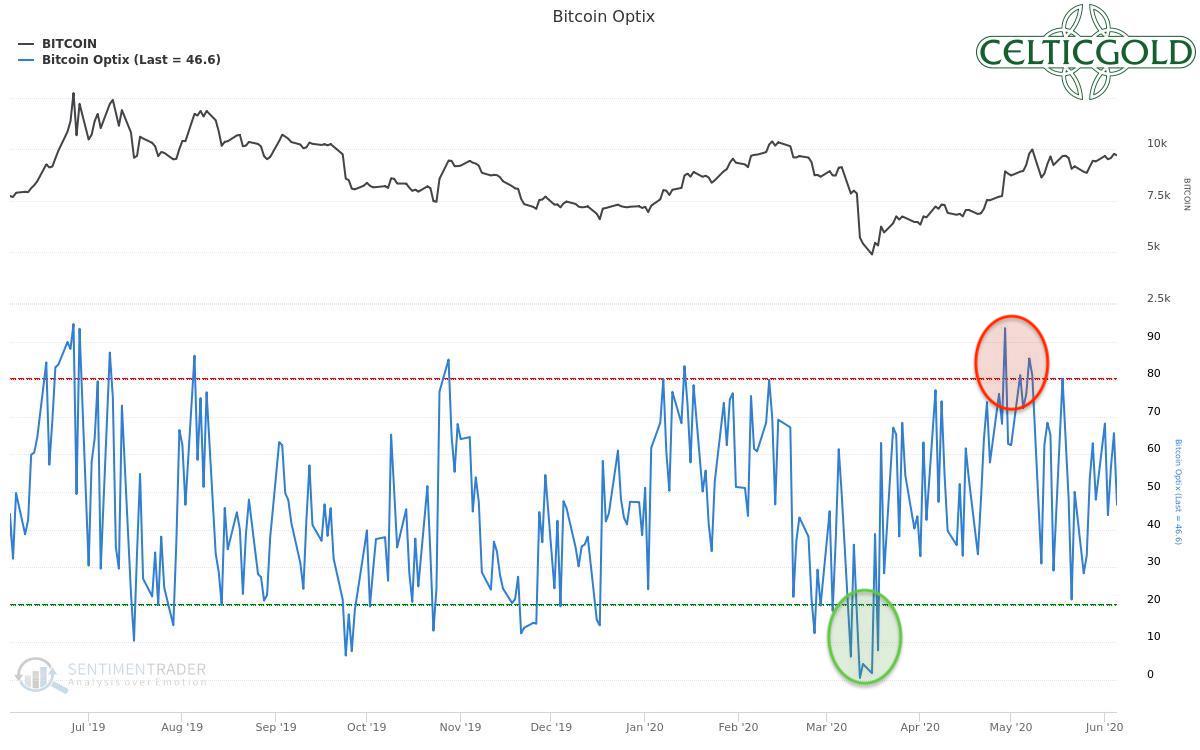
Bitcoin Optix as of June 7th, 2020. Source: Sentimentrader
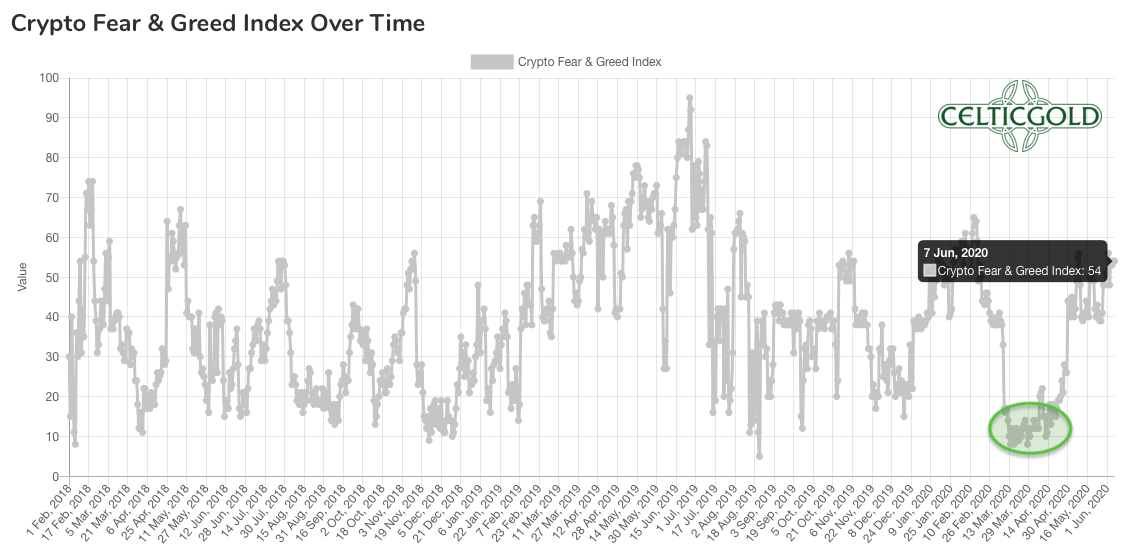
Crypto Fear & Greed Index as of June 7th, 2020. Source: Crypto Fear & Greed Index
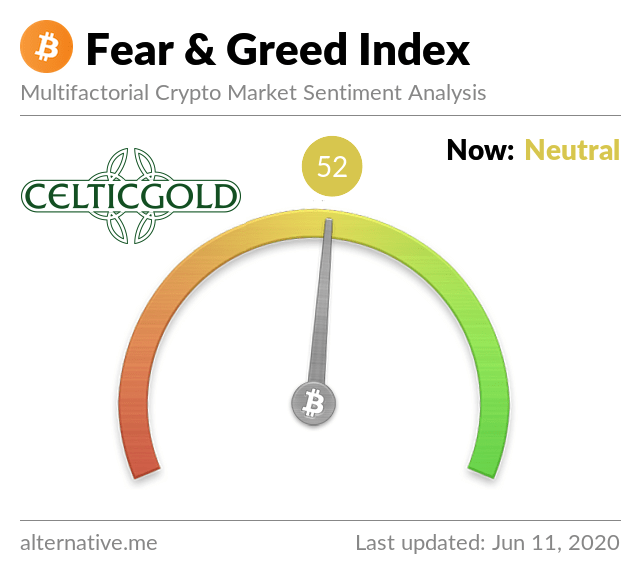
Crypto Fear & Greed Index as of June 11th, 2020. Source: Crypto Fear & Greed Index
The current sentiment data indicate a rather balanced mood among market participants. Neither the Bitcoin Optix from Sentimentrader nor the sophisticated “Fear & Greed Index” currently reports any extremes.
In summary, the five-week consolidation around US$10,000 has obviously done a good job, as the euphoric mood has given way to a more neutral perception.
Seasonality Bitcoin – Crack-Up Boom Will Force The Breakout
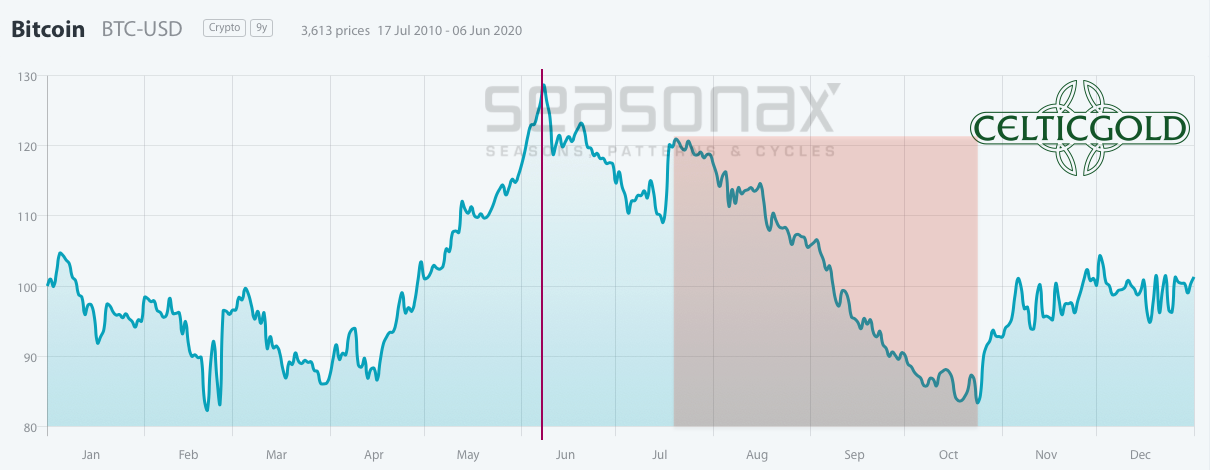
Bitcoin seasonality. Source: Seasonax
Despite a relatively small amount of data (10 years), a seasonal pattern has been established for Bitcoin over the last ten years. This can certainly be used as a helpful timing tool. In fact, the price trend this year has followed this seasonal pattern quite well. However, from now on the seasonality sends a warning signal, because statistically Bitcoin prices usually topped in June and then went into a correction until autumn.
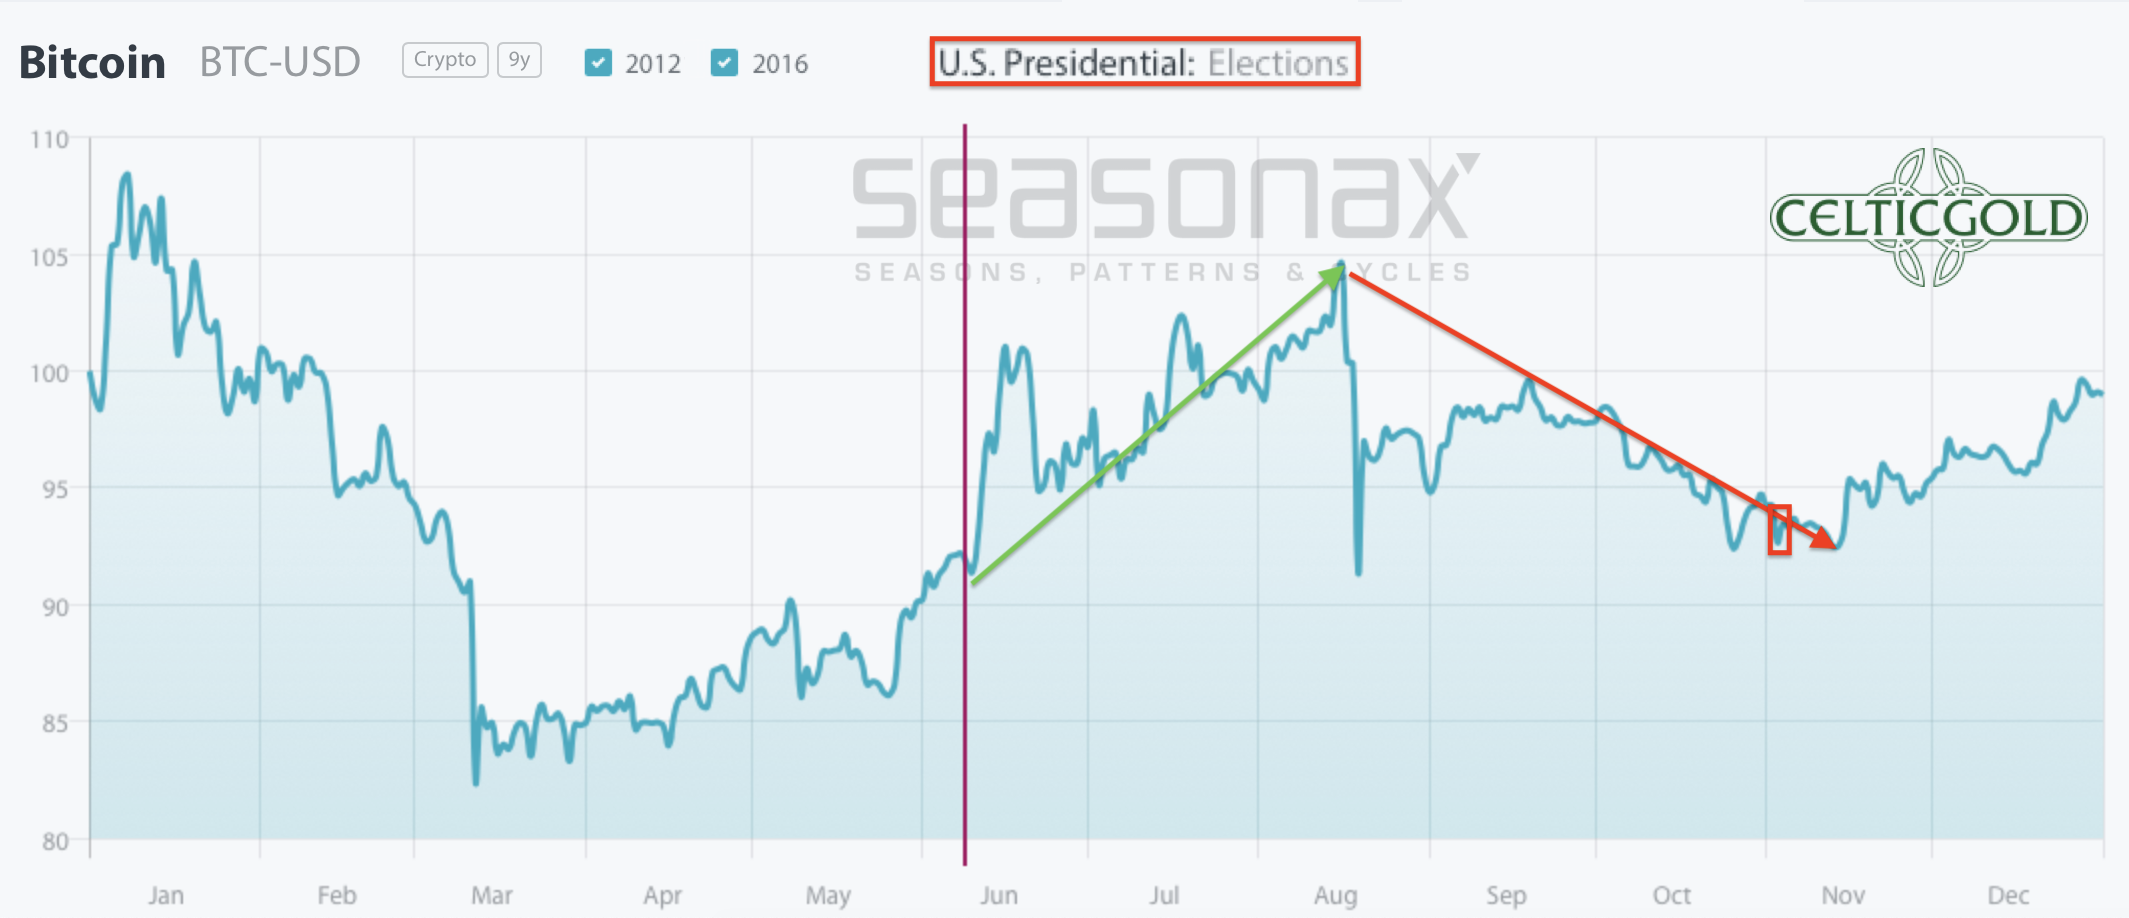
Bitcoin seasonality in US election years. Source: Seasonax
Despite the relatively small amount of data, this year, however, the US election must be mentioned as another limiting factor. This event is already casting its shadow. We can assume that the US election will soon become the dominant topic. For Bitcoin, we can only refer to the price developments in 2012 and 2016. Statistically speaking, two years are of course not worth much. For the sake of completeness, however, it should be mentioned that Bitcoin has seen strong rallies until midsummer in those two election years. From the tops in august the following corrections have been rather mild and only lasted until mid of November.
Based on the last 10 years, the seasonal component is now gradually becoming unfavorable. In an US election year, Bitcoin however has shown itself twice to be quite strong. Therefore, if the breakout above US$10,000 is successful in the coming weeks, a strong rally should follow until midsummer. This rally would then have to be corrected in the weeks or 2-3 months before the US election.
Bitcoin against gold
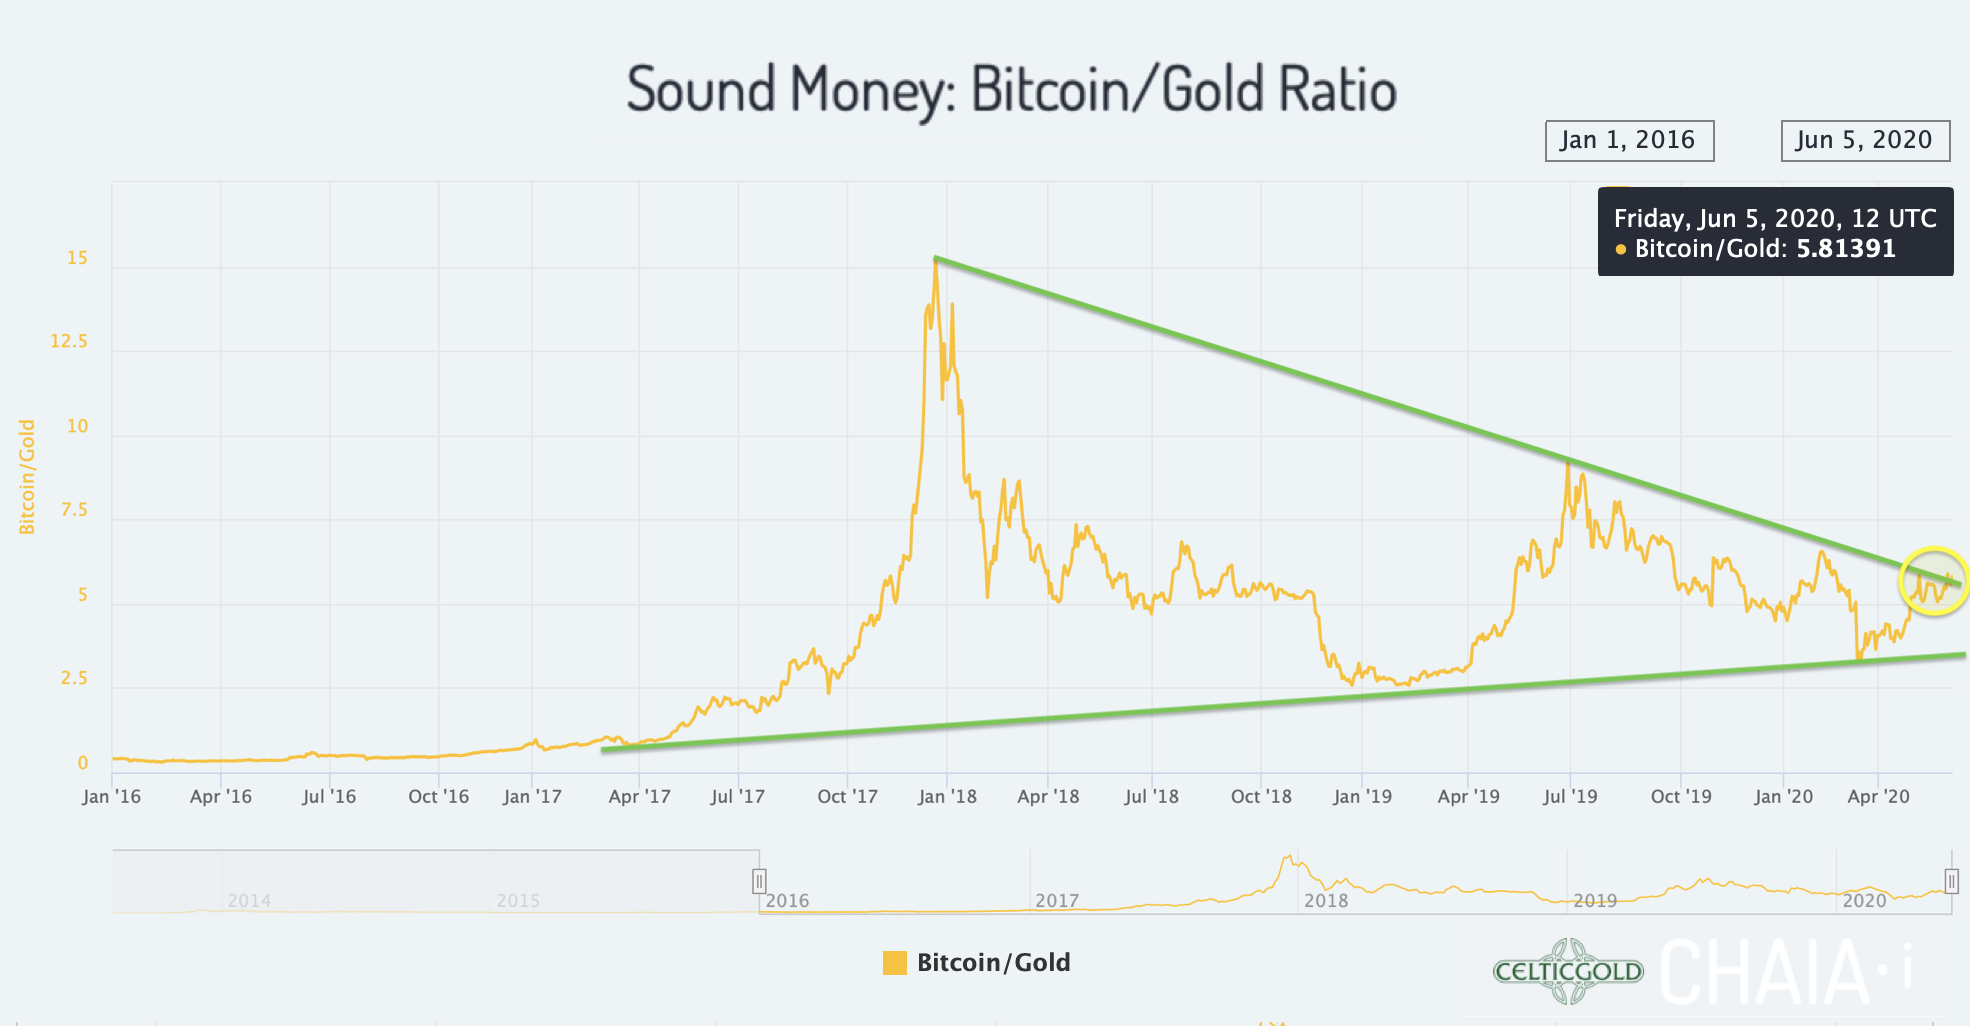
Sound Money Bitcoin/Gold-Ratio as of June 5th, 2020. Source: Chaia
Currently, you have to pay 5.74 ounces of gold for one Bitcoin. In other words, a troy ounce of gold currently costs only 0.205 Bitcoin. Thus, the Bitcoin/Gold ratio has shifted further in favor of Bitcoin. Indeed, Bitcoin seems to be finally breaking out of the two-and-a-half-year consolidation triangle these days.Putting this piece of the puzzle together with the rising triangle on the daily chart, the chances of a rapid rally for Bitcoin are extremely good.
Generally, buying and selling Bitcoin against gold only makes sense to the extent that one balances the allocation in the two asset classes! At least 10% but better 25% of one’s total assets should be invested in precious metals physically, while in cryptos and especially in Bitcoin one should hold at least between 1% and of 5%. If you are very familiar with cryptocurrencies and Bitcoin, you can certainly allocate higher percentages to Bitcoin on an individual basis. For the average investor, who is normally also invested in equities and real estate, 5% in the highly speculative and highly volatile Bitcoin is already a lot!
Opposites compliment. In our dualistic world of Yin and Yang, body and mind, up and down, warm and cold, we are bound by the necessary attraction of opposites. In this sense you can view gold and bitcoin as such a pair of strength. With the physical component of gold and the digital aspect of bitcoin you have a complimentary unit of a true safe haven for the 21st century. You want to own both! – Florian Grummes
Conclusion: Bitcoin – Crack-Up Boom Will Force The Breakout
A good two and a half months have passed since the peak of the corona crisis and the beginning of the global lockdown. Slowly but surely the economy and public life are picking up again. The pandemic seems to be on the retreat. The real economy is starting to grow again from bombed-out levels. But “normality” is still a long way off.
Nevertheless, the stock markets have made a phenomenal and v-shaped recovery in the last 11 weeks. The price of gold had already been way ahead of this recovery and trumped its highs of early March by mid-April already. Bitcoin initially lagged behind the gold price, but by the end of April Bitcoin as well had returned to its pre-corona levels well ahead of the stock markets. But why is there so much doubt and partly even indignation of many experts about these rising prices?
© Holger Zschaepitz @Schuldensuehner, 9th of June 2020
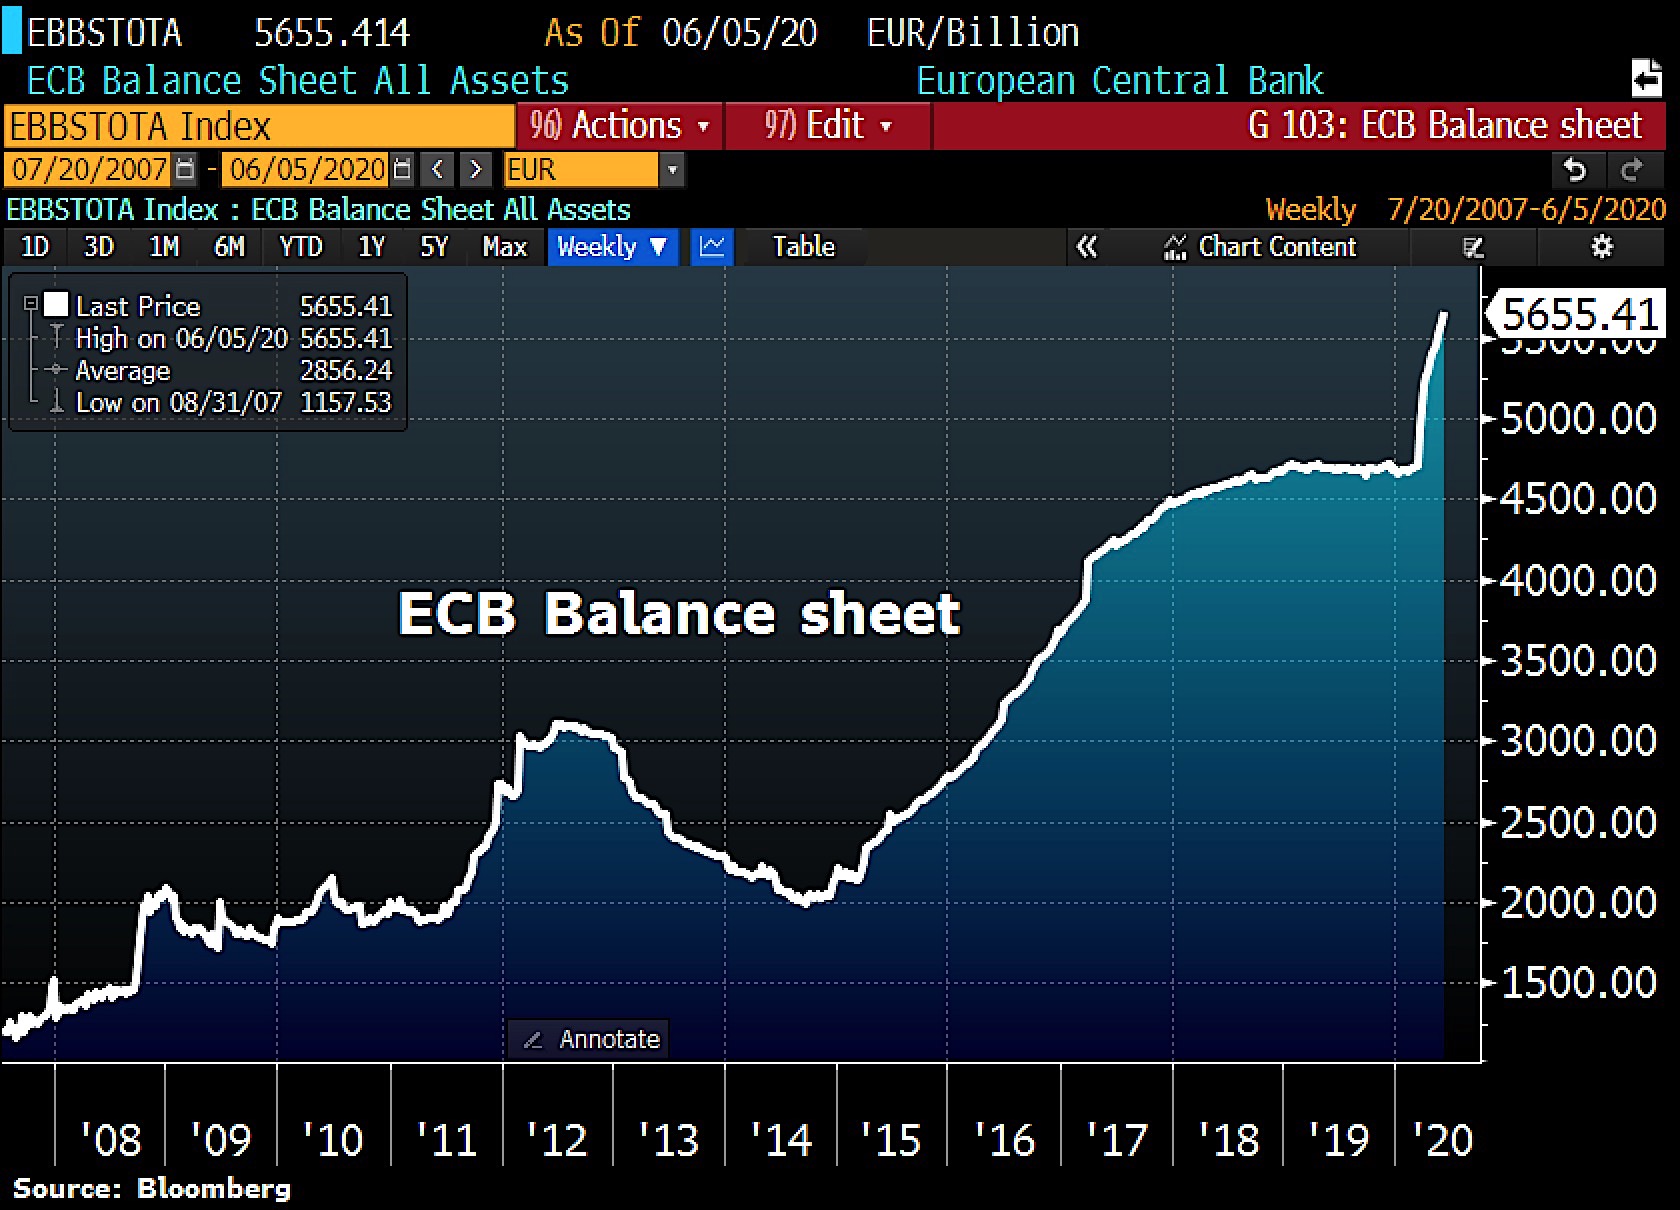
The decisive factor for these extremely bullish developments is of course the incredible flood of money that is pouring over the markets worldwide. Just last week the ECB announced that it had increased its balance sheet by a further EUR 40.7 billion in just one week.
It was also announced that the ECB will pump another EUR 600 billion into government and corporate bonds. The emergency purchase program “PEPP” (Pandemic Emergency Purchase Program) will be increased to a total of EUR 1.35 trillion and will run until at least June 2021! Ultimately, the central bank intends to continue the purchases until it considers the corona crisis to be over. The ECB approved the EUR 750 billion PEPP programme in March in response to the Corona crisis.
The speed at which the central bank had bought bonds in recent weeks spoke in favour of expanding the programme. If this trend continues, the original purchase volume of EUR 750 billion would already have been exhausted by this autumn.
© Holger Zschaepitz @Schuldensuehner, 3rd of June 2020
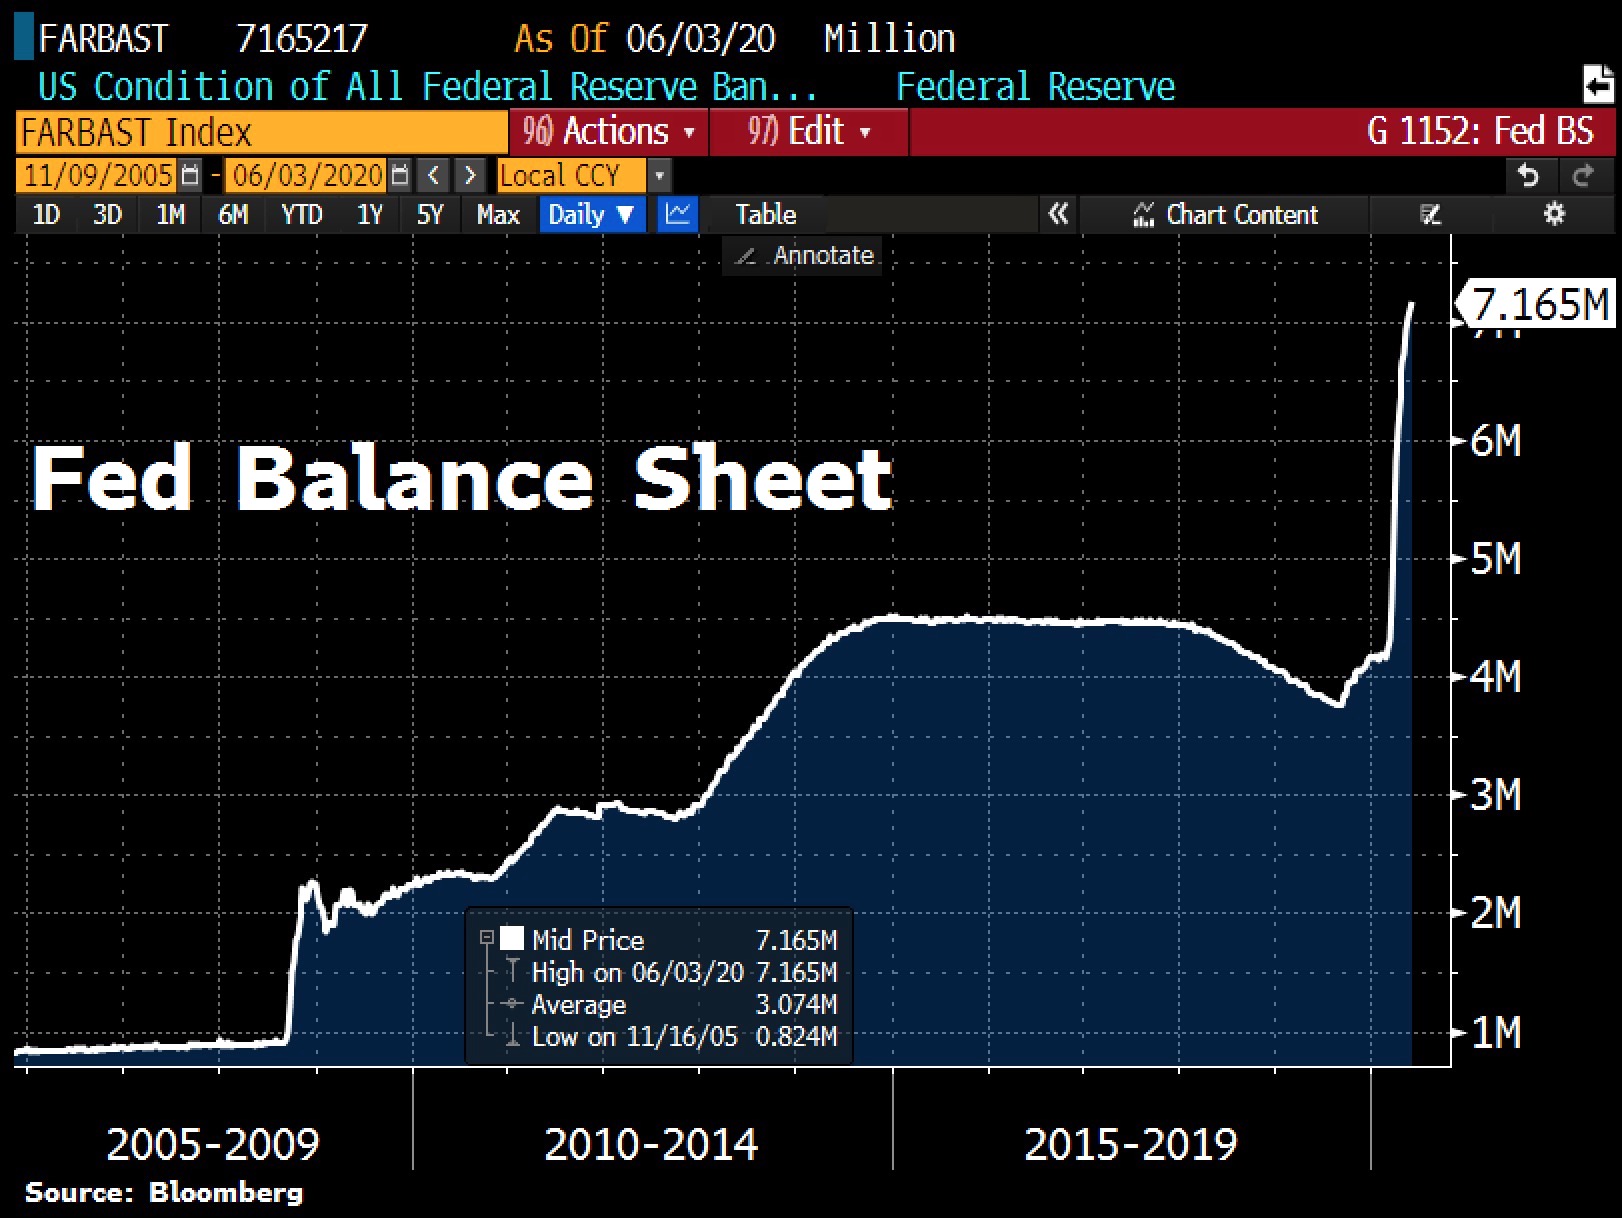
Of course, the US Federal Reserve cannot stand back at such a confetti party and is also pushing its balance sheet expansion at a breathtaking pace. The Fed’s total assets rose last week by US$67.9 billion from US$60 billion, more than 10% faster than the week before! Overall, the FED’s total assets reached a new high of US$7,165.2 billion.
© Holger Zschaepitz @Schuldensuehner, 4th of June 2020
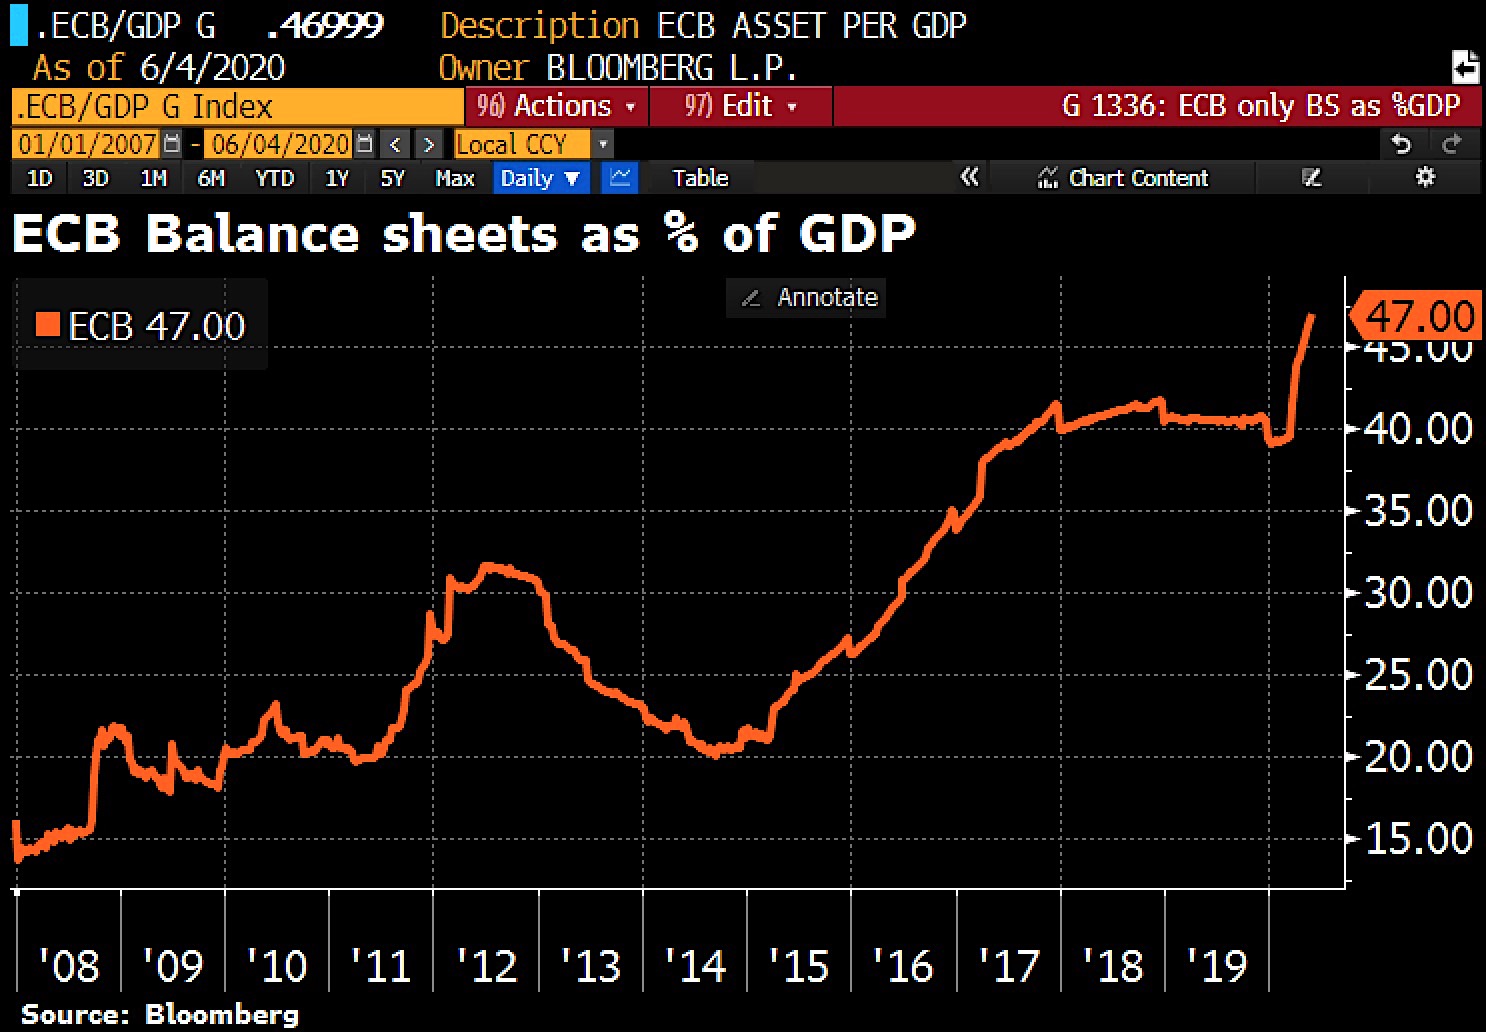
While the Federal Reserve’s balance sheet has thus now reached 33.3% of US GDP, the ECB’s balance sheet total already corresponds to more than 47% of eurozone GDP.
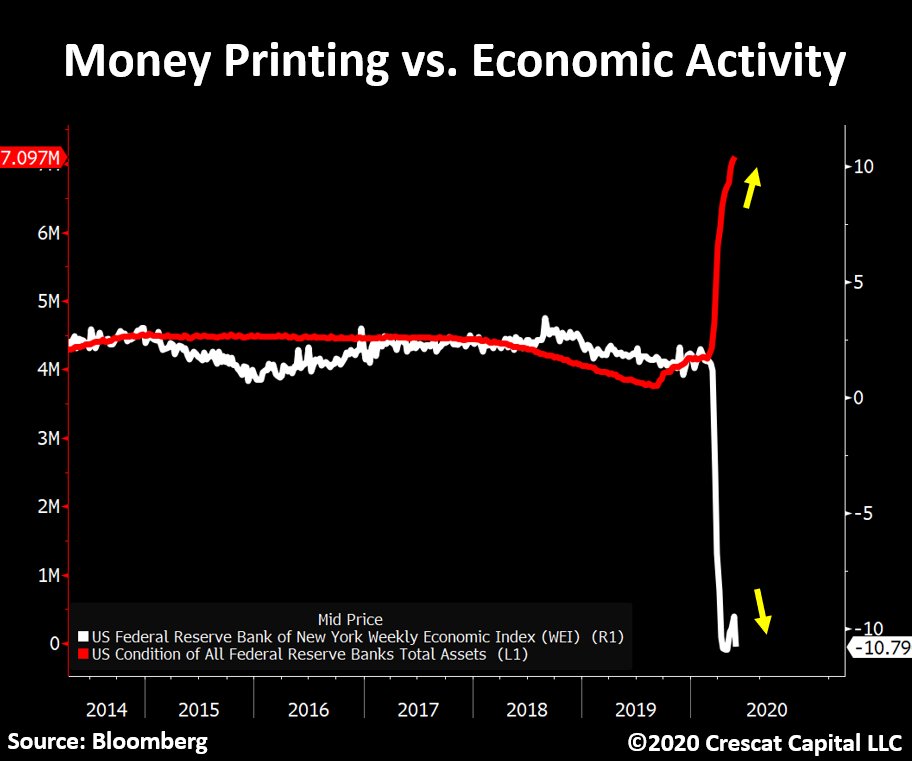
© Tavi Costa @Crescant Capital, 4th of June 2020
So while the printing presses are running hot, the real economy is only slowly getting back on track from extremely low levels, if at all. At the same time, bankruptcies in the USA, for example, literally exploded by 48% in May. The S&P 500, on the other hand, made up for all the corona losses, while global liquidity has reached a new all-time high at US$ 85.5 trillion.
This means that the so called crack-up boom is already in full swing as central bankers exacerbate the divergence between the miserable fundamentals and the booming financial markets at an ever-faster pace. In addition, politicians are putting together huge economic stimulus packages. The V-shaped rallies in the equity markets as well as in gold and silver and bitcoin are clearly due to these historically unique money supply expansions on a global scale. However, there is no escape from this game anymore.
Many investors are still skeptical and clearly underinvested. There is also still a lot of liquidity on the sidelines. However, the pressure of suffering is increasing daily due to these rising markets. Together with the constant flooding of central banks, the markets have no choice but to continue to rise in the coming months and years. At the same time, ever larger rescue and support measures will become necessary in the background. They will replace each other at an ever faster pace and also push each other up.
Of course, none of this has anything to do with capitalism, free market economy and democracy. Rather, it is the endgame in the now fifty-year-old paper money experiment. It began with the so-called closing of the gold window in 1971. Physical precious metals as well as selected precious metal and commodity stocks, Bitcoin and selected crypto-currencies are outside the debt money system. They are your “safe bank” in the looming catastrophic boom. They are therefore likely to outperform the nominally rallying equity markets.
Breakout only a question of time
The stable price development of Bitcoin confirms this thesis. Bitcoin is still consolidating around and below US$10,000. However, it seems to be only a matter of time until the breakout to the upside will occur. Then we can quickly expect price to rise 30-40% towards the highs of last summer in the US$13,500 range. Depending on how fiercely the bulls go about things, this hurdle can then be overrun relatively quickly. This would mean that the next target would already be the all-time high of around US$20,000. Hence, it doesn’t take too much to shift the focus of market participants towards this number. Bitcoin – Crack-Up Boom Will Force The Breakout.
However, further pullbacks within the rising triangle to approx. US$9,000 should be included in your planning! But in fact, every small pullback is already a buying opportunity.
Analysis sponsored and initially published on June 9th by www.celticgold.eu.
If you like to get regular updates on our gold model, precious metals and cryptocurrencies you can subscribe to our free newsletter.

