


Bitcoin – The market wants to see the all-time high
Review
Only three months have passed since the last short-term correction in Bitcoin at the beginning of September. Back then it was the last pullback slightly below US$10,000. In terms of price, however, Bitcoin has since then catapulted itself into another dimension as prices are currently trading very close to the all-time high of US$20,000! This means an impressive doubling within a few months! The expected strong performance even accelerated in recent weeks, so that numerous altcoins came back to life, too. Overall, the entire crypto sector is back in a bull market. Bitcoin – The market wants to see the all-time high
The rally into another dimension began on October 8th and led Bitcoin prices within seven weeks from US$10,600 up to US$19,500 on November 25th. Since then, Bitcoin has been consolidating on high levels just below its all-time high at US$20,000. A top or even a trend reversal has not been observed. However, volatility has increased significantly and temporary pullbacks in the range between US$1,000 and US$3,200 are causing nervousness among the weak hands.
Technical Analysis For Bitcoin in US-Dollar
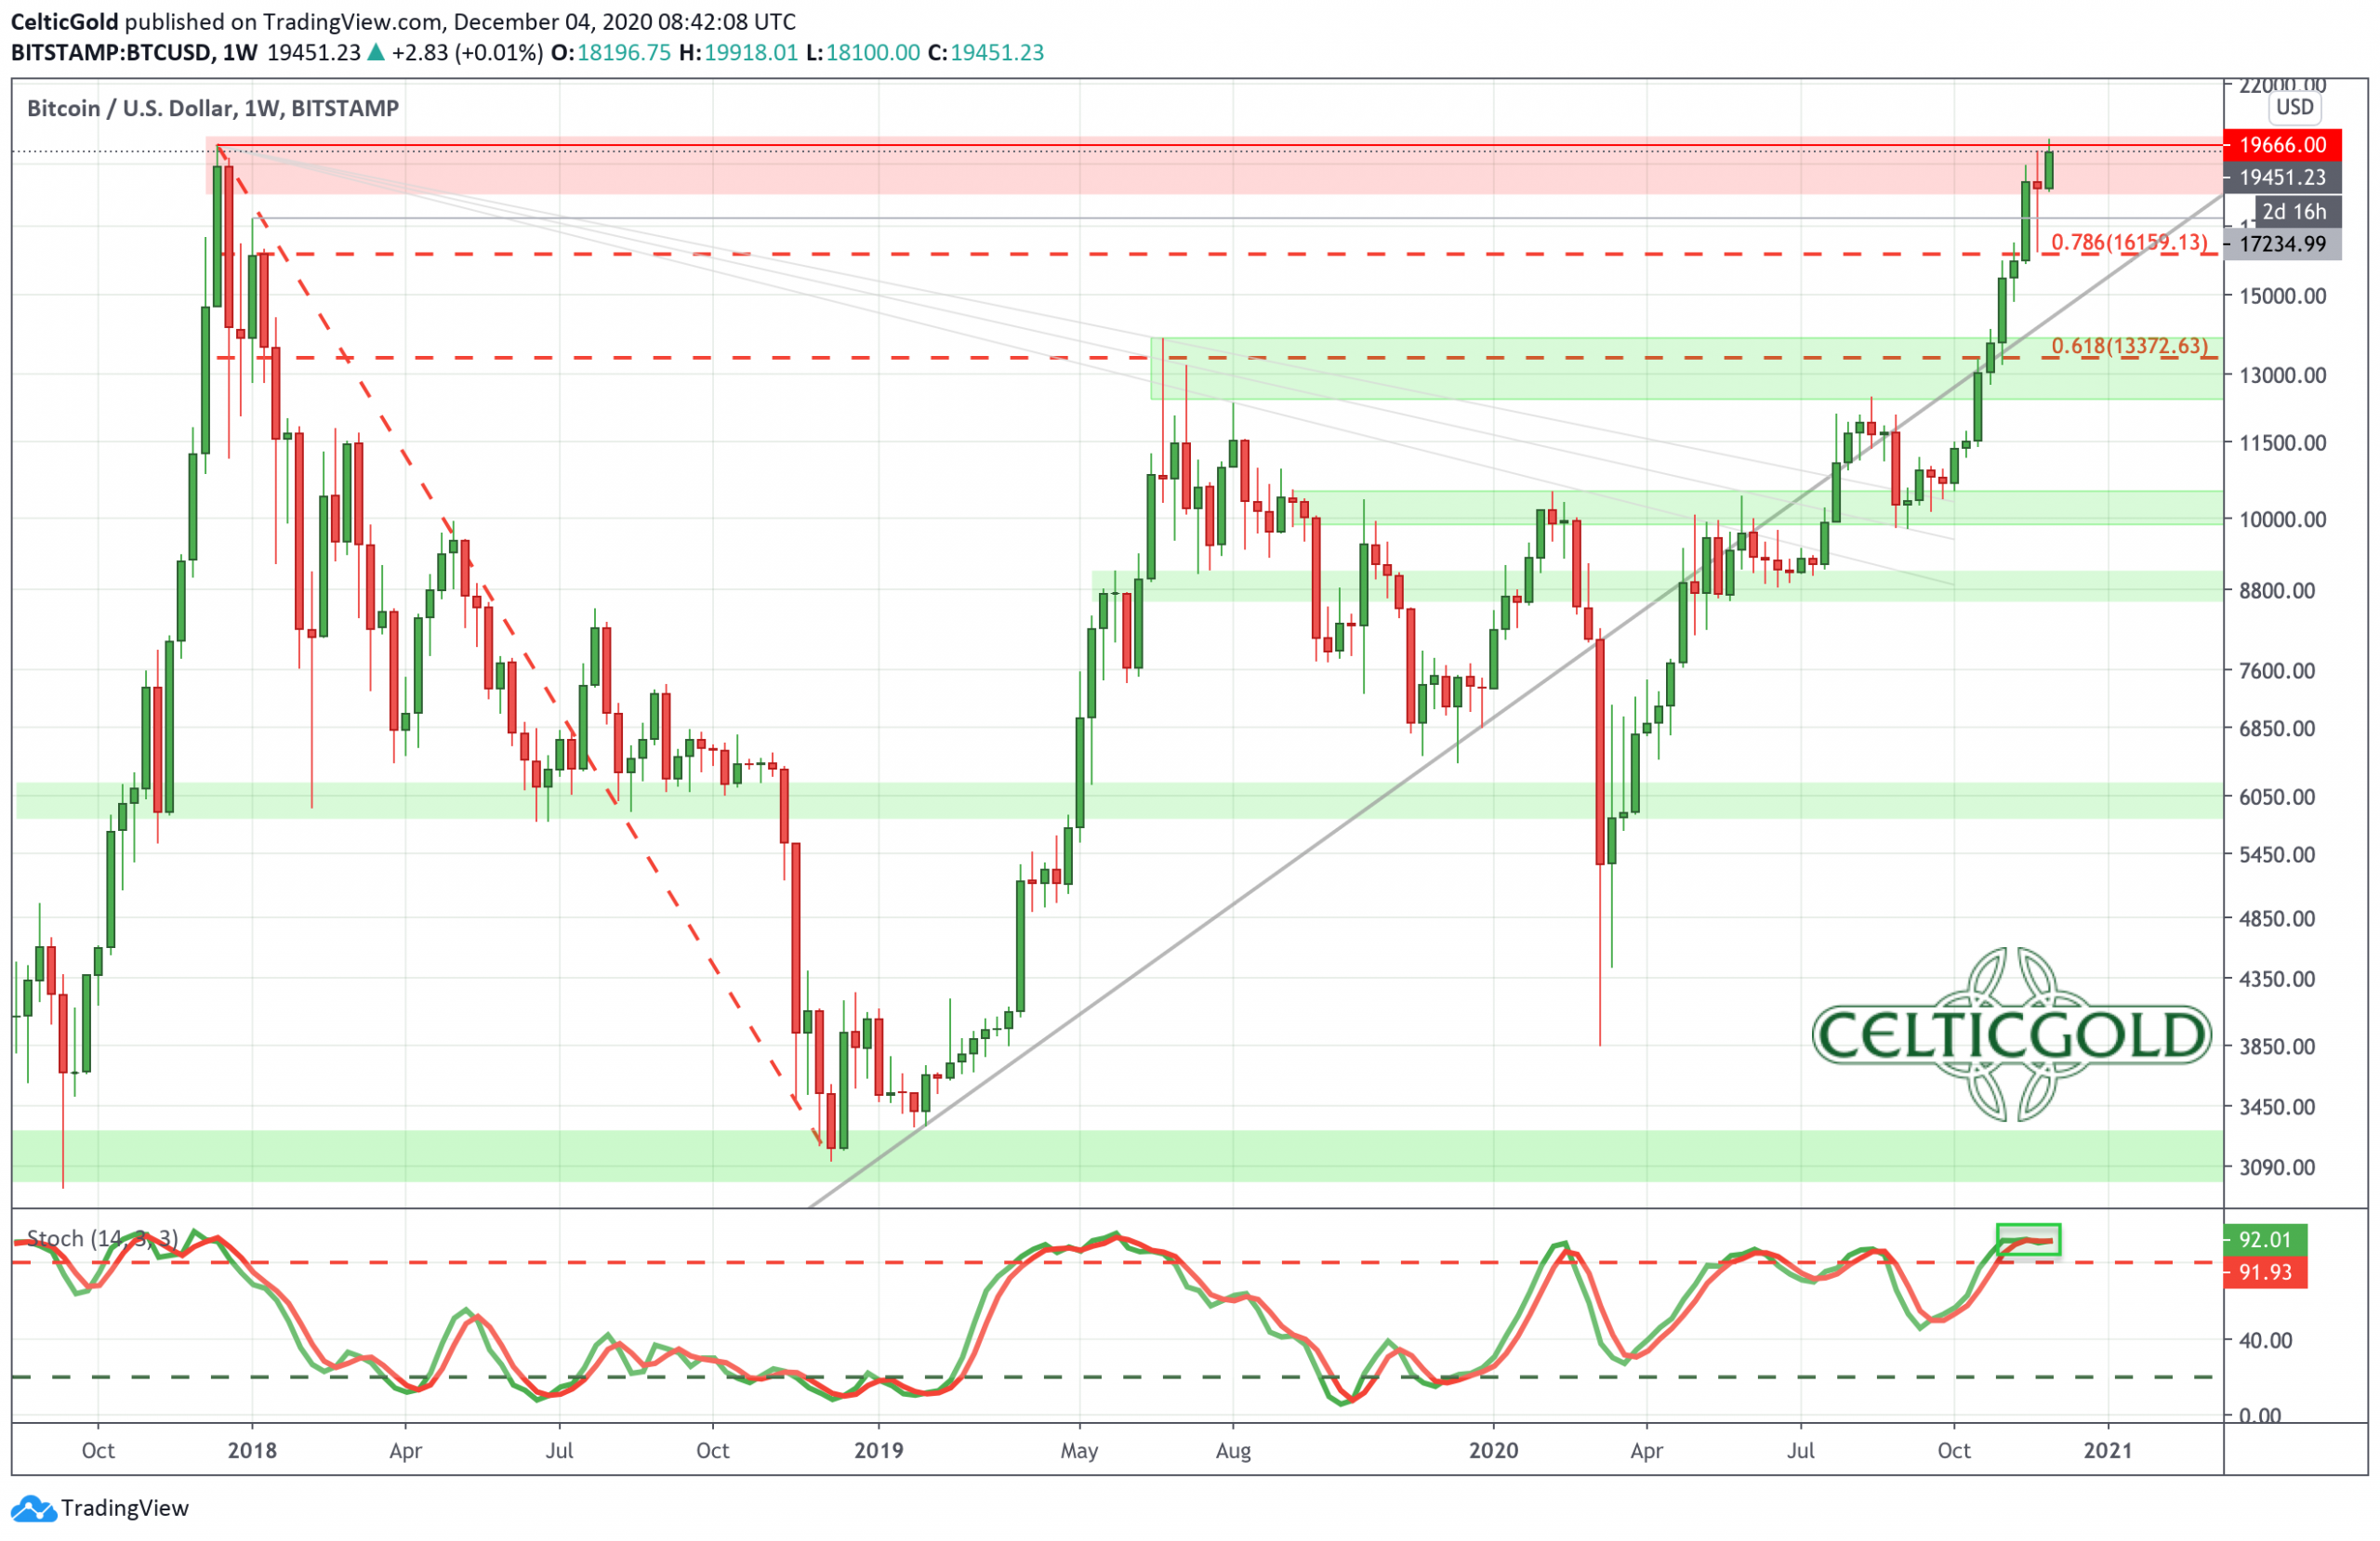
Bitcoin Weekly Chart as of December 4th 2020, Source: Tradingview
Nearly three years have passed since the legendary run to almost US$20,000. Back then, Bitcoin topped out just under US$20,000 and fell into a deep crypto winter, which mercilessly separated the strong from the weak among the investors and traders and likewise also under all the hyped “ICO projects” and cobbled together new crypto currencies. Now what is left after all the hype and and the deep correction is above all a much stronger Bitcoin, which is currently knocking at its all-time December 2017 highs long before almost all other altcoins.
On the weekly chart for Bitcoin, the zone between US$19,000 and US$20,000 therefore logically forms a strong resistance zone. Nevertheless, the perseverance with which the bulls have been able to hold around and above the US$19,000 mark for the past few days is impressive and clearly shows strength. Equally positive is the fact that Bitcoin was able to fight its way back over its multi-year upward trend line in October. However, anyone looking for the hair in the soup will find a heavily overbought stochastic oscillator on the weekly chart. The RSI has also reached very sporty highs. A somewhat larger pullback or a sideways consolidation for several weeks would therefore not be surprising and should definitely be planned for.
In conclusion, the weekly chart is bullish and in a clear uptrend. Basically, we have to assume that the uptrend will continue and even accelerate in the next step. However, the heavily overbought situation proves to be problematic. The risk/reward at current price level is rather miserable, as long as one does not assume at least a tripling of Bitcoin prices over the coming 12 months! Who however legitimately counts on six digit Bitcoin prices in the medium- to longer-term, can buy right now despite prices trading only slightly below the all-time high. Then in addition, however, one must bring along nerves made of steel too, in order to be able to bear and get through possible huge pullbacks in the magnitude of 30-45% from current price levels. Speculative trading with high leverage on margin and without a safety net is prohibited in the current environment.
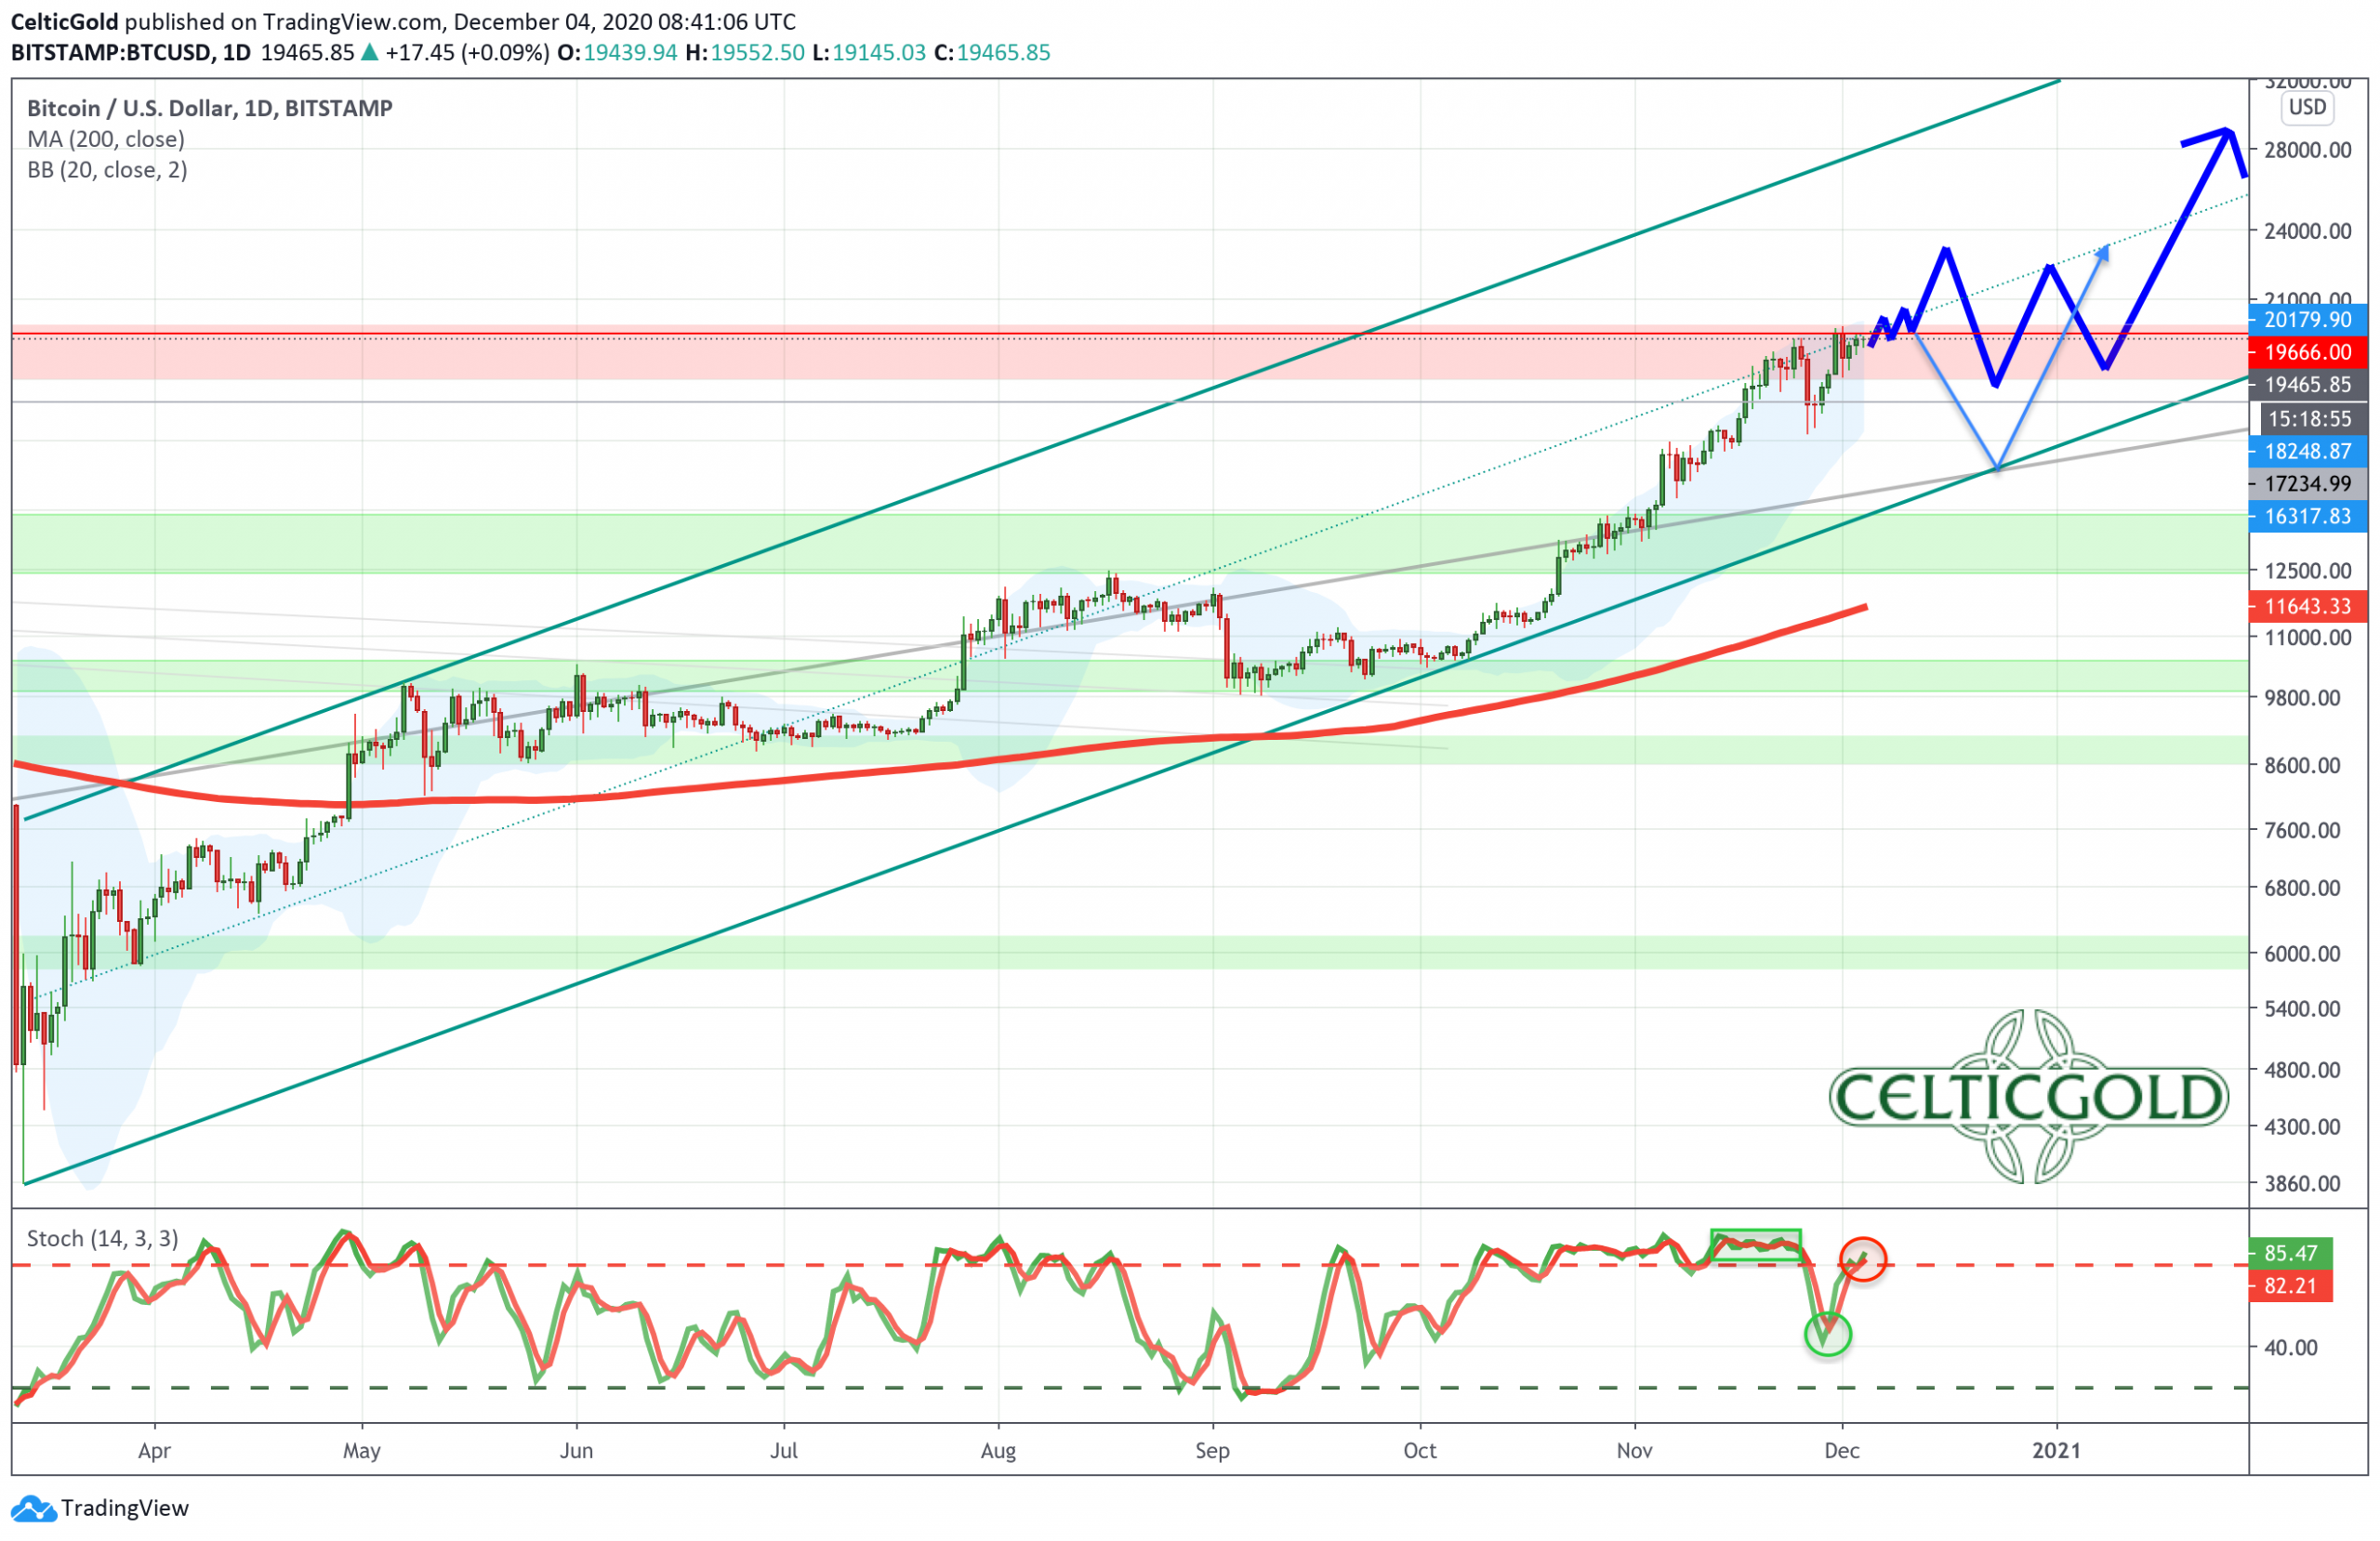
Bitcoin Daily Chart as of December 4th 2020. Source: Tradingview
On the daily chart, a meaningful uptrend channel can be defined with the corona crash low in March, the first recovery high in early May and the last low in early October. Thereby, Bitcoin currently consolidates around the midline of this uptrend channel or alternatively prepares for the breakout into the upper half of the channel. Depending on which scenario the market decides on, either considerable upside potential will be released rather soon or a pullback towards US$15,000 to US$17,000 is activated on the down side.
However, the Stochastic Oscillator is already overbought again, after the price slide around Thanksgiving caused the market to lose its ultra-bullish embedded stochastic status. In addition, the 200-day moving average (US$11,643) is well below the current price action and also confirms the current somewhat airy price levels.
Overall, the daily chart is overbought, but still bullish in the short term. The danger of a somewhat larger pullback cannot be dismissed. Yet so far, there is any confirmation. However, the divergences on the short-term (1h and 4h charts) are accumulating!
Commitments of Traders Report For Bitcoin – The market wants to see the all-time high
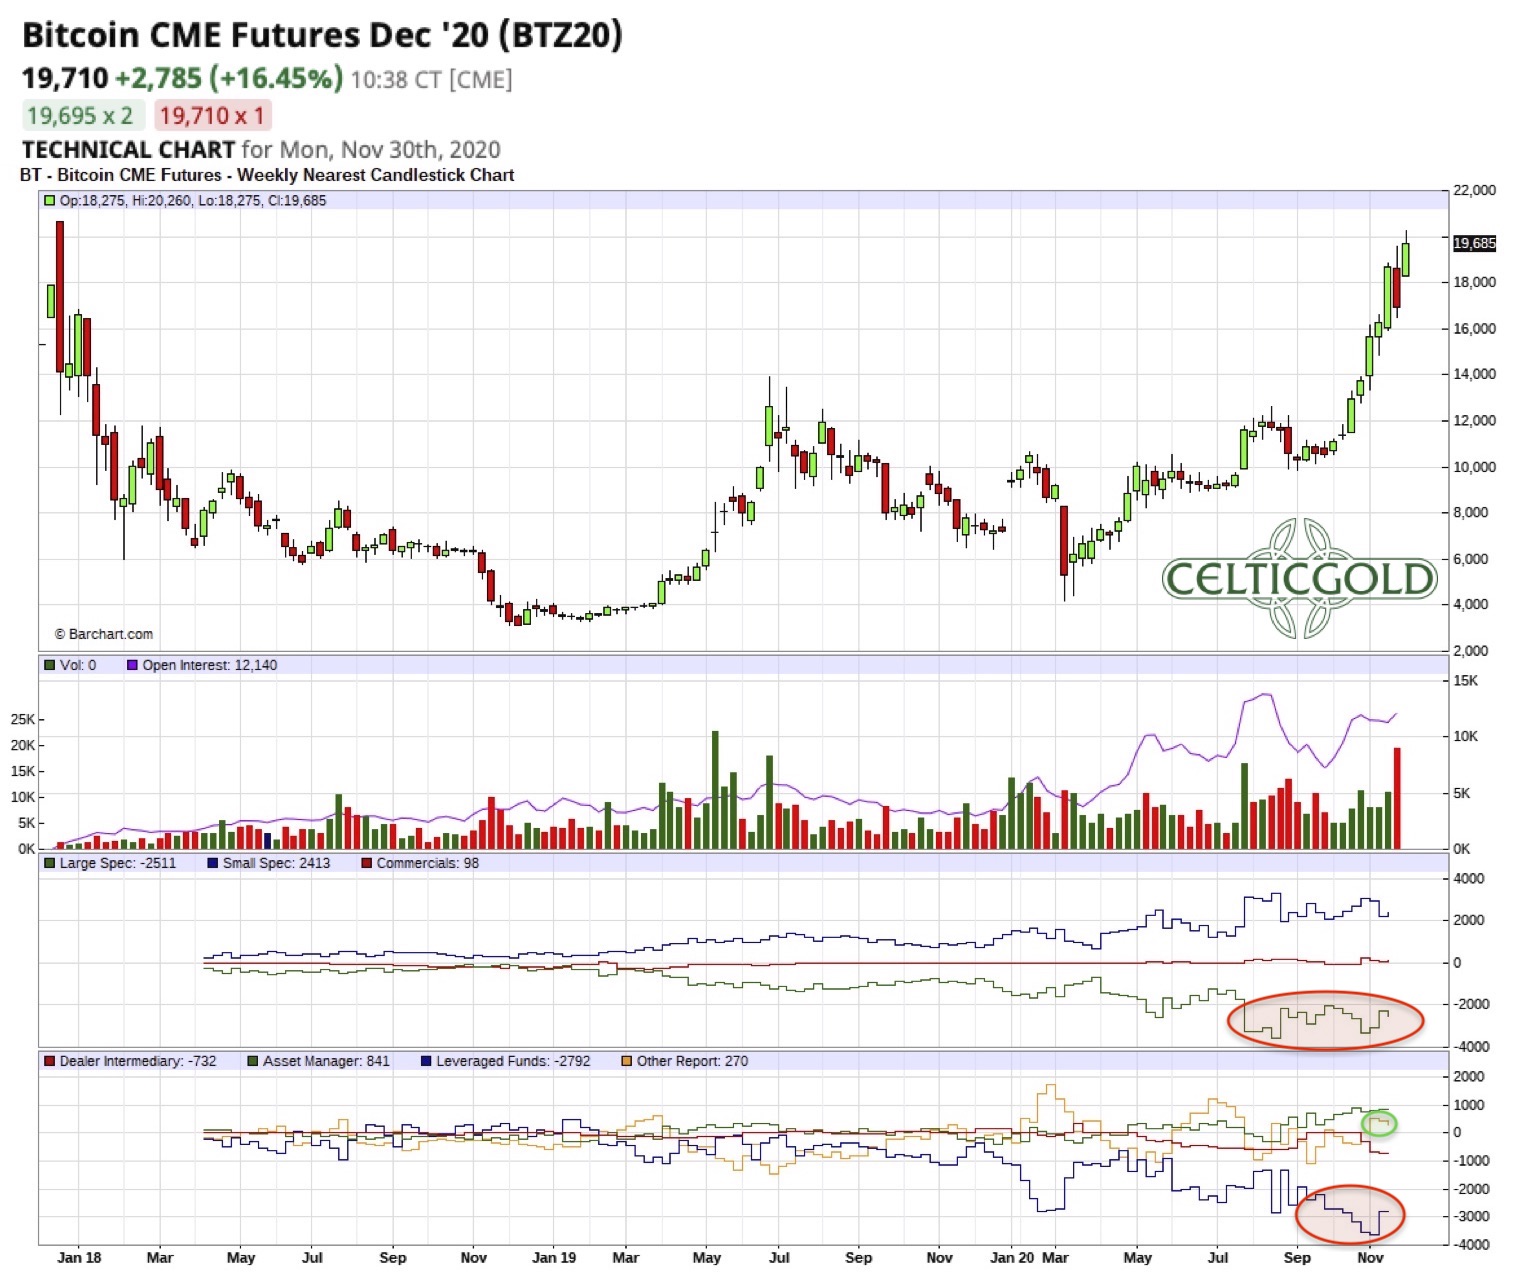
Bitcoin CME Future CoT-report, as of November 30th 2020. Source: Barchart
Although bitcoin future (with the symbol XBT at the CBOE and the symbol BTC at the CME) have only been trading since December 17th, 2017, the overall trading volume is still relatively low. Nevertheless, the weekly CoT report (Commitment of Trades) offers an interesting overview of the positions and is definitely a helpful tool to analyze the Bitcoin market.
Even though, Bitcoin prices posted a strong rally in recent weeks, the current CoT Report does not show any new extreme positioning. The subgroup of the so called “leveraged funds” is still massively positioned on the short side. They obviously had to cover some of their short positions at least in small parts during the rally. The second interesting subgroup, namely the “Other Reportables”, on the other hand, slightly expanded their long position pro-cyclically into the rising prices.
Overall, “smart money” has been on the sellers’ side since August and especially since the beginning of September. The resulting high short position of the “leveraged funds” is a clear warning signal. In order to close the high short position profitably, these major speculators need significantly lower Bitcoin prices likely between and below US$10,000 to US$12,000. Of course, such a large pullback cannot be ruled out, but there is currently no indication of this. Nevertheless, the CoT Report still urges caution.
Sentiment Bitcoin – The market wants to see the all-time high
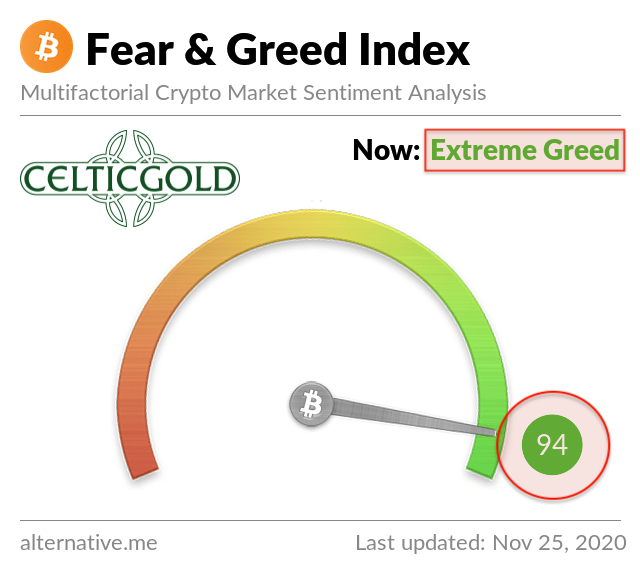
Crypto Fear & Greed Index as of November 25th, 2020. Source: Crypto Fear & Greed Index
The short-term mood among market participants had reached a dangerously exaggerated level 10 days ago. At around 94, the Fear & Greed Index was almost at its limit, signaling extreme greed. The logical consequence was the sharp setback in Bitcoin in the order of over 16% within two days or almost US$3,500 around Thanksgiving.
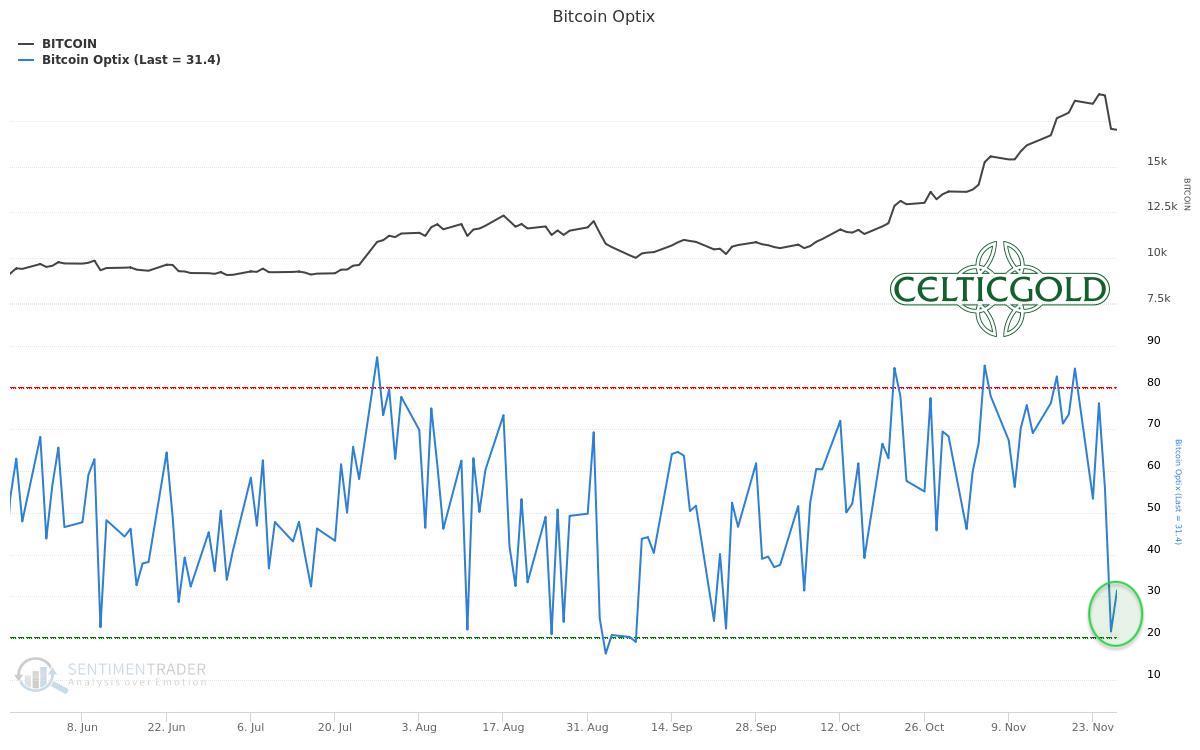
Bitcoin Optix as of November 30th, 2020. Source: Sentimentrader
This pullback caused a significant cooling down at least for the faster changing Bitcoin Optix Sentiment indicator. The direct recovery to a new high in Bitcoin during last week can be explained thereby by this beaten down sentiment indicator. However, the bounce has likely been driven primarily by buyers who had missed the rally so far. Thus ever more weak hands came into the market.
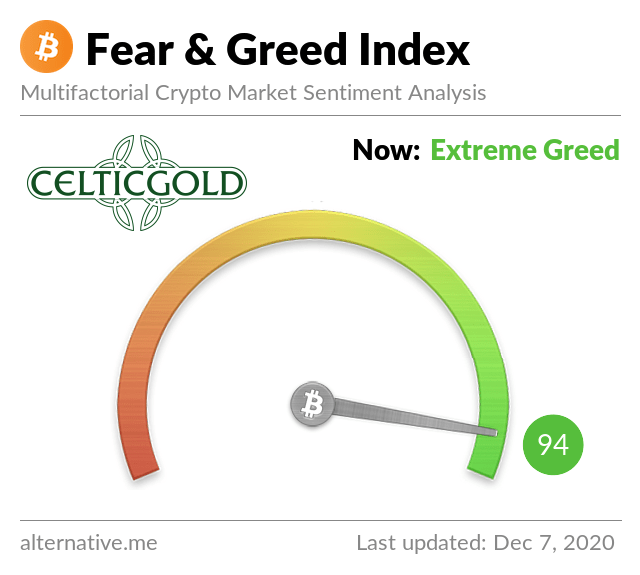
Crypto Fear & Greed Index as of December 7th, 2020. Source: Crypto Fear & Greed Index
Currently, the tense or exaggerated situation has hardly changed in the larger picture. Furthermore, the Fear & Greed Index measures extreme greed and an extremely dangerous sentiment that is very sensitive to pullbacks!
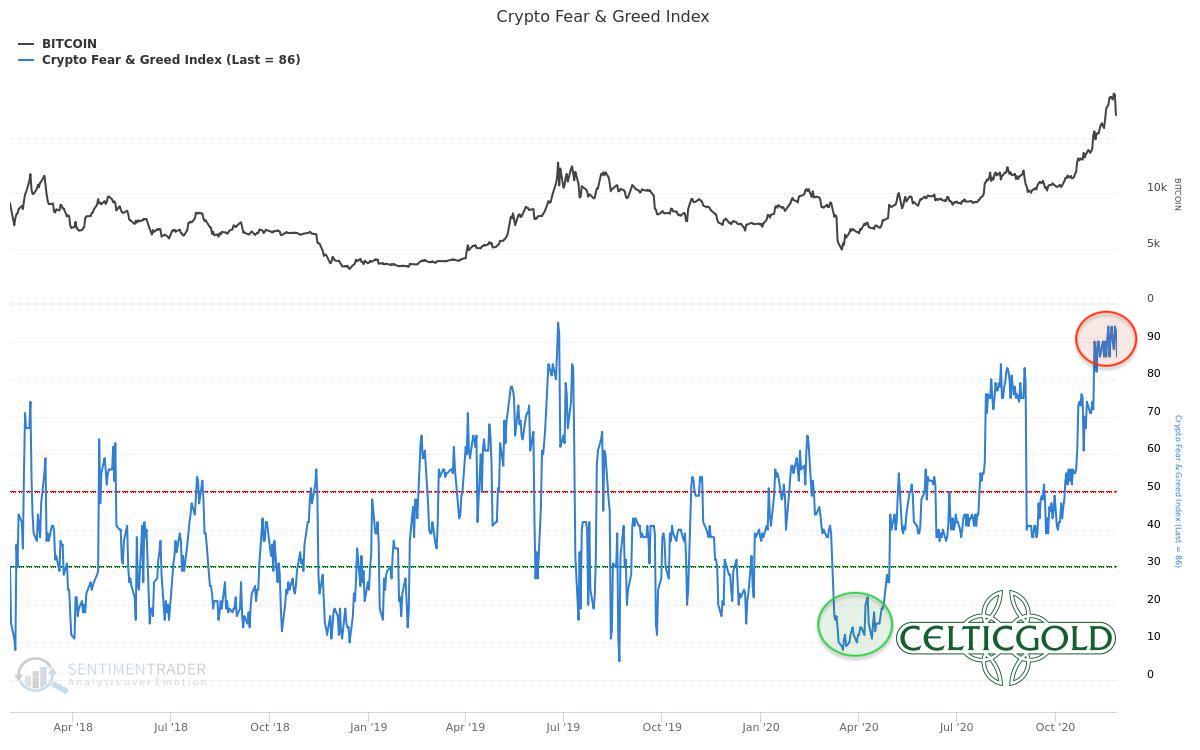
Crypto Fear & Greed Index as of November 30th, 2020. Source: Sentimentrader
In the bigger picture, this Fear & Greed Index is trading at extremely unhealthy highs too. Anyone who still starts buying Bitcoin on a large scale under such conditions is acting with gross negligence. A strong or violent pullback, which pushes the sentiment back to a normal balanced level, is only a question of time.

On top to all this, “Bild” (the German mainstream yellow press) also reported on Bitcoin over the last few days, hence the mainstream title page indicator also provides a clear warning signal.
In summary, the sentiment analysis delivers a clear sell signal. It is advisable to wait patiently and calmly for a bit larger pullback.
Seasonality Bitcoin – The market wants to see the all-time high
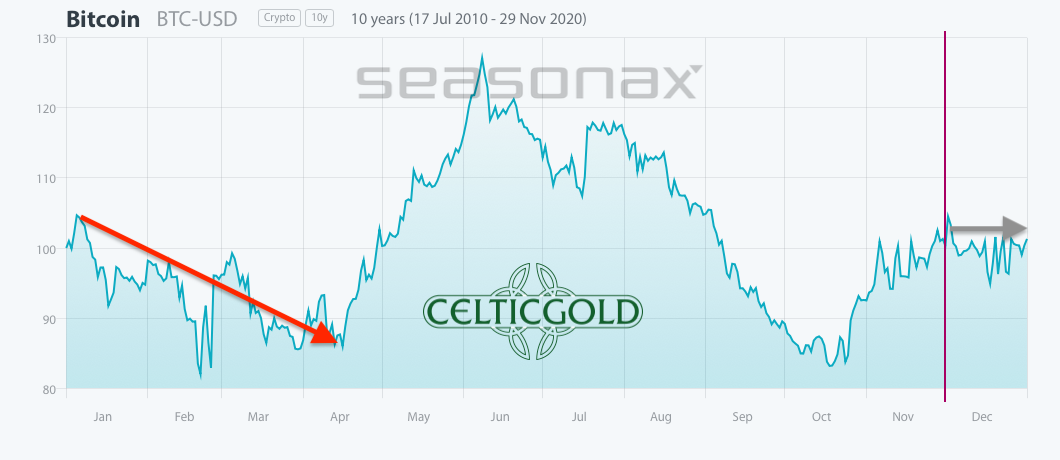
Bitcoin seasonality. Source: Seasonax
From the seasonal perspective, until midsummer Bitcoin has sticked quite well to the pattern established over the last 10 years. The typical correction from late summer into fall was extremely short and manageable this year. Instead, the typical autumn rally began as early as the beginning of October. And instead of normal upmove, the last two months were a huge bull run.
According to the seasonal statistics, this wave up is approaching its peak during these days which is unlikely to be surpassed in the coming one or two months. According to the seasonal pattern, a corrective phase, which has not (yet) been confirmed, could be over in March or April.
The seasonal conclusion brings a clear warning signal, too. Frequently, bitcoin´s bullrun have been running out of steam at the beginning or mid of December. Either it followed a sharp corrective move and/or a sideways consolidation lasting several months.
Sound-money: Bitcoin vs. Gold
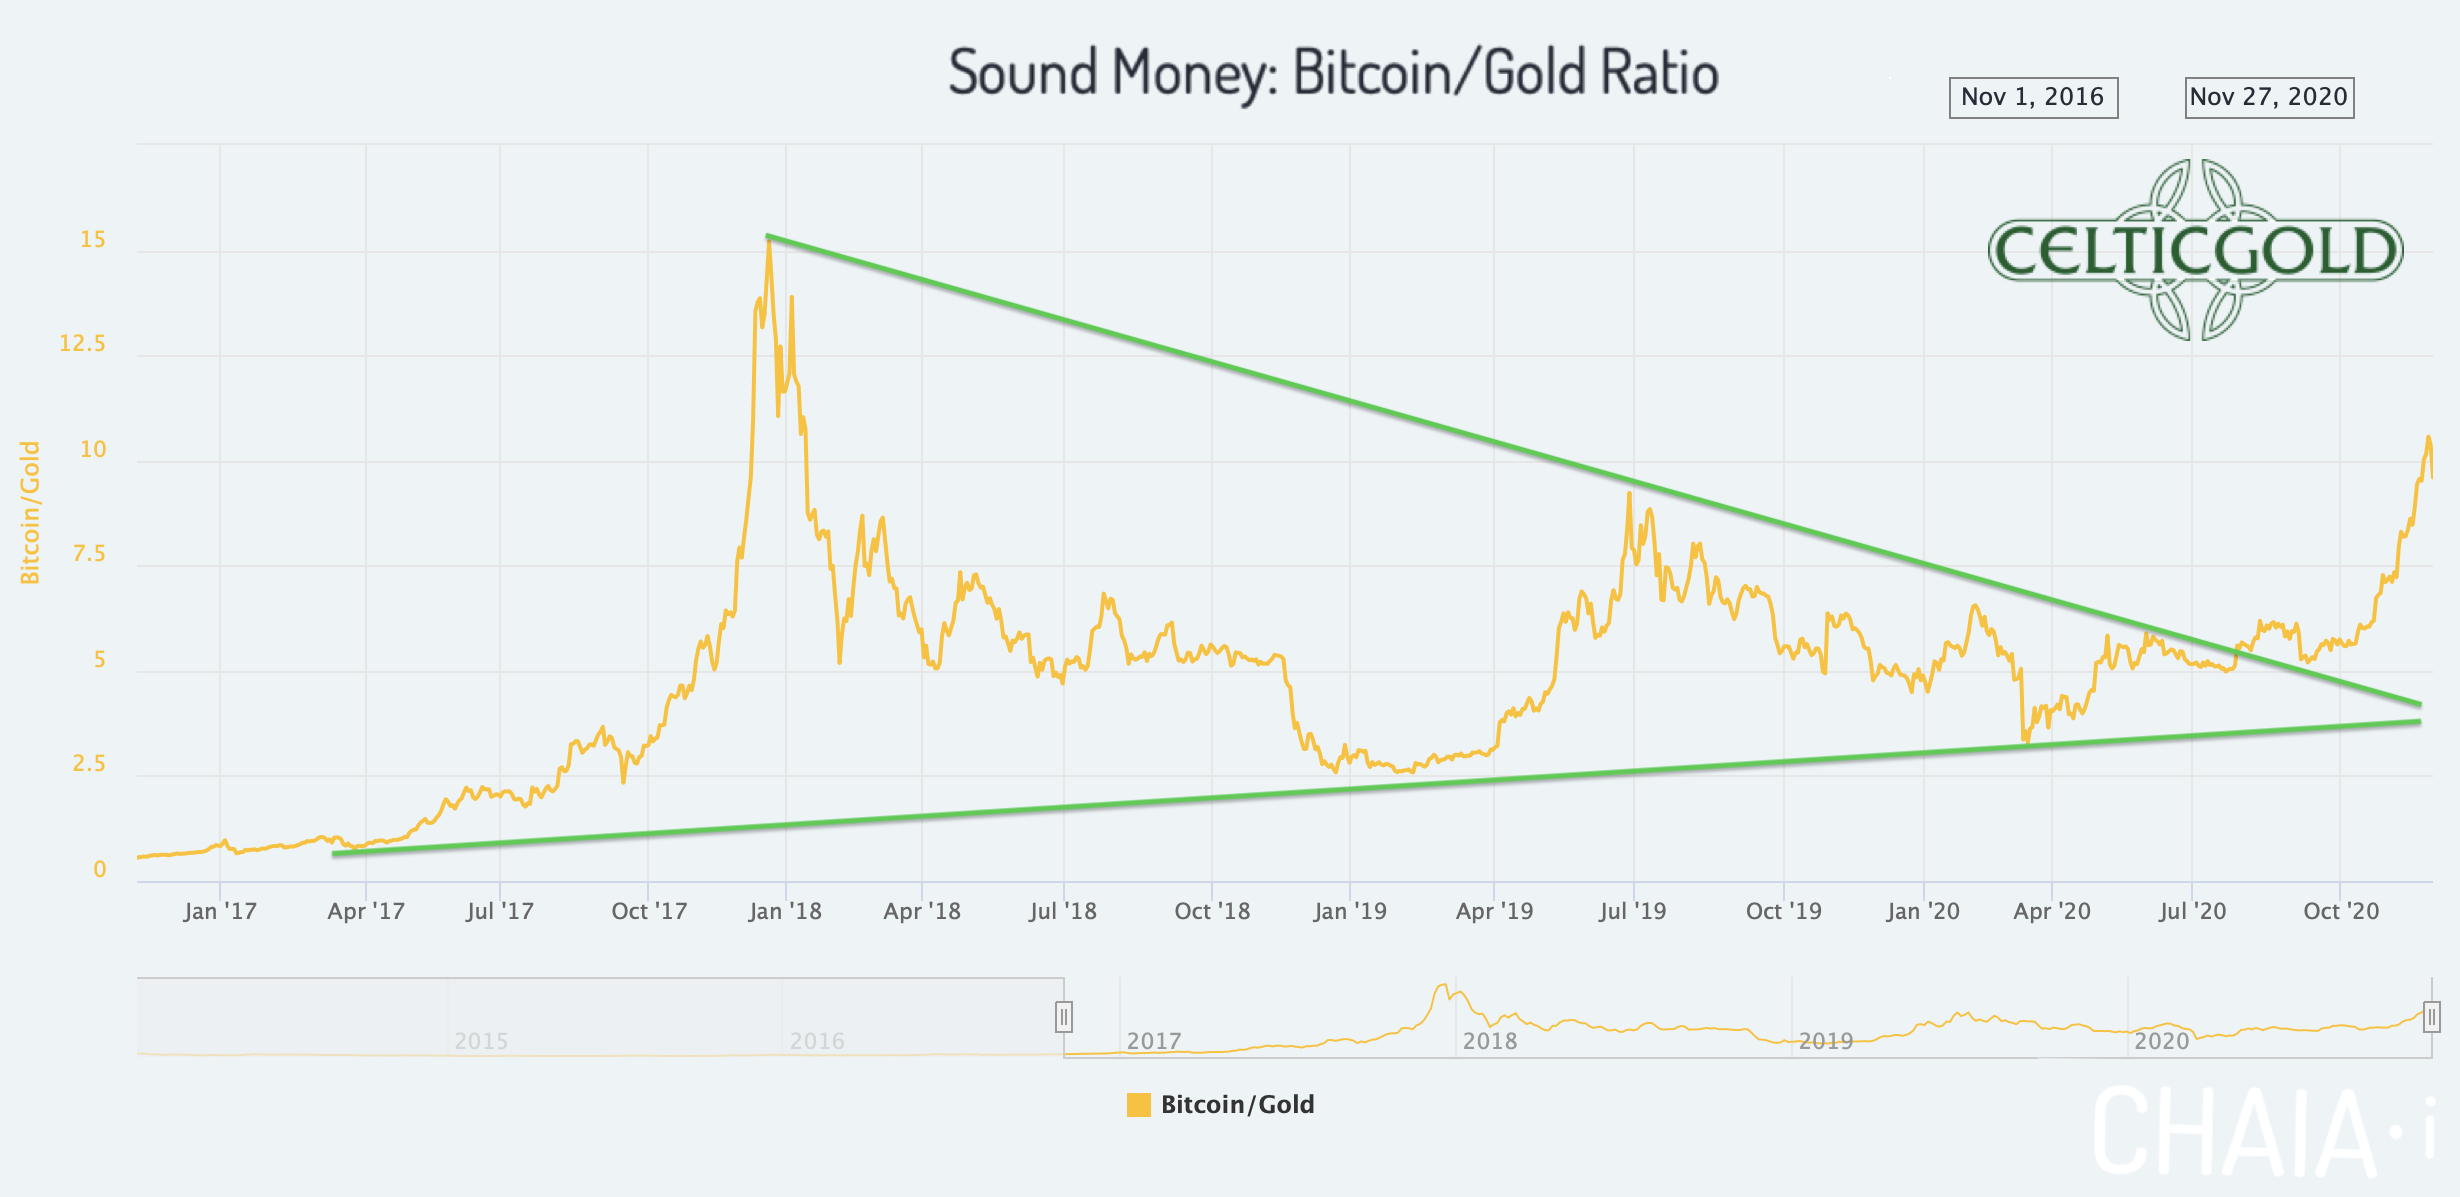
Sound Money Bitcoin/Gold-Ratio as of November 28th, 2020. Source: Chaia
With current prices of US$19,000 for one Bitcoin and US$1,860 for one troy ounce of Gold, the bitcoin/gold-ratio currently sits at 10,21. That means you have to pay more than ten ounces of gold for one bitcoin. Vice versa, one troy ounce of gold currently costs only 0,097 Bitcoin.
Since the long-awaited breakout from the large consolidation triangle at the end of July, Bitcoin has mercilessly outperformed the gold price. After this steep rise, a breather or consolidation at high levels would be the most likely scenario. A fundamental trend reversal, however, is not expected. Rather, the movement of the last few months should only be a foretaste of what awaits us in the next few months and years, because Bitcoin is definitely the faster horse compared to gold.
Ok, last bomb - I have a sell order in tomorrow to sell all my gold and to scale in to buy BTC and ETH (80/20). I dont own anything else (except some bond calls and some $'s). 98% of my liquid net worth. See, you can't categorize me except #irresponsiblylong Good night all.
— Raoul Pal (@RaoulGMI) November 30, 2020
You want to own Bitcoin and gold!
Generally, buying and selling Bitcoin against gold only makes sense to the extent that one balances the allocation in those two asset classes! At least 10% but better 25% of one’s total assets should be invested in precious metals physically, while in cryptos and especially in Bitcoin one should hold at least between 1% and of 5%. If you are very familiar with cryptocurrencies and Bitcoin, you can certainly allocate much higher percentages to Bitcoin on an individual basis. For the average investor, who is normally also invested in equities and real estate, more than 5% in the still highly speculative and highly volatile Bitcoin is already a lot!
Opposites compliment. In our dualistic world of Yin and Yang, body and mind, up and down, warm and cold, we are bound by the necessary attraction of opposites. In this sense you can view gold and bitcoin as such a pair of strength. With the physical component of gold and the digital aspect of bitcoin you have a complimentary unit of a true safe haven for the 21st century. You want to own both! – Florian Grummes
Macro Outlook
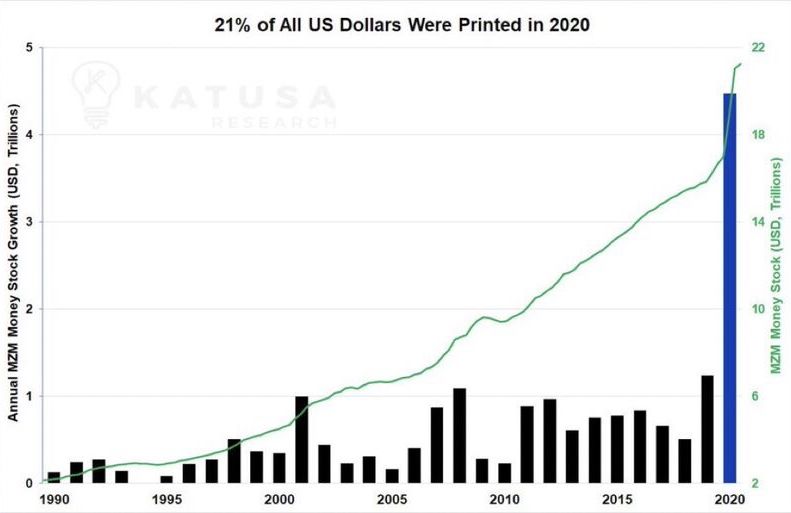
©Katusa Research, 19. November 2020
This year´s expansion of the money supply via central bank balance sheets, or rather the fraudulent creation of currency, surpasses anything that has ever been seen before. In the USA alone, US$4.5 trillion have been created out of thin air in 2020 so far. This is more new currency than in the last five years combined and corresponds to 21% of the total existing USD.
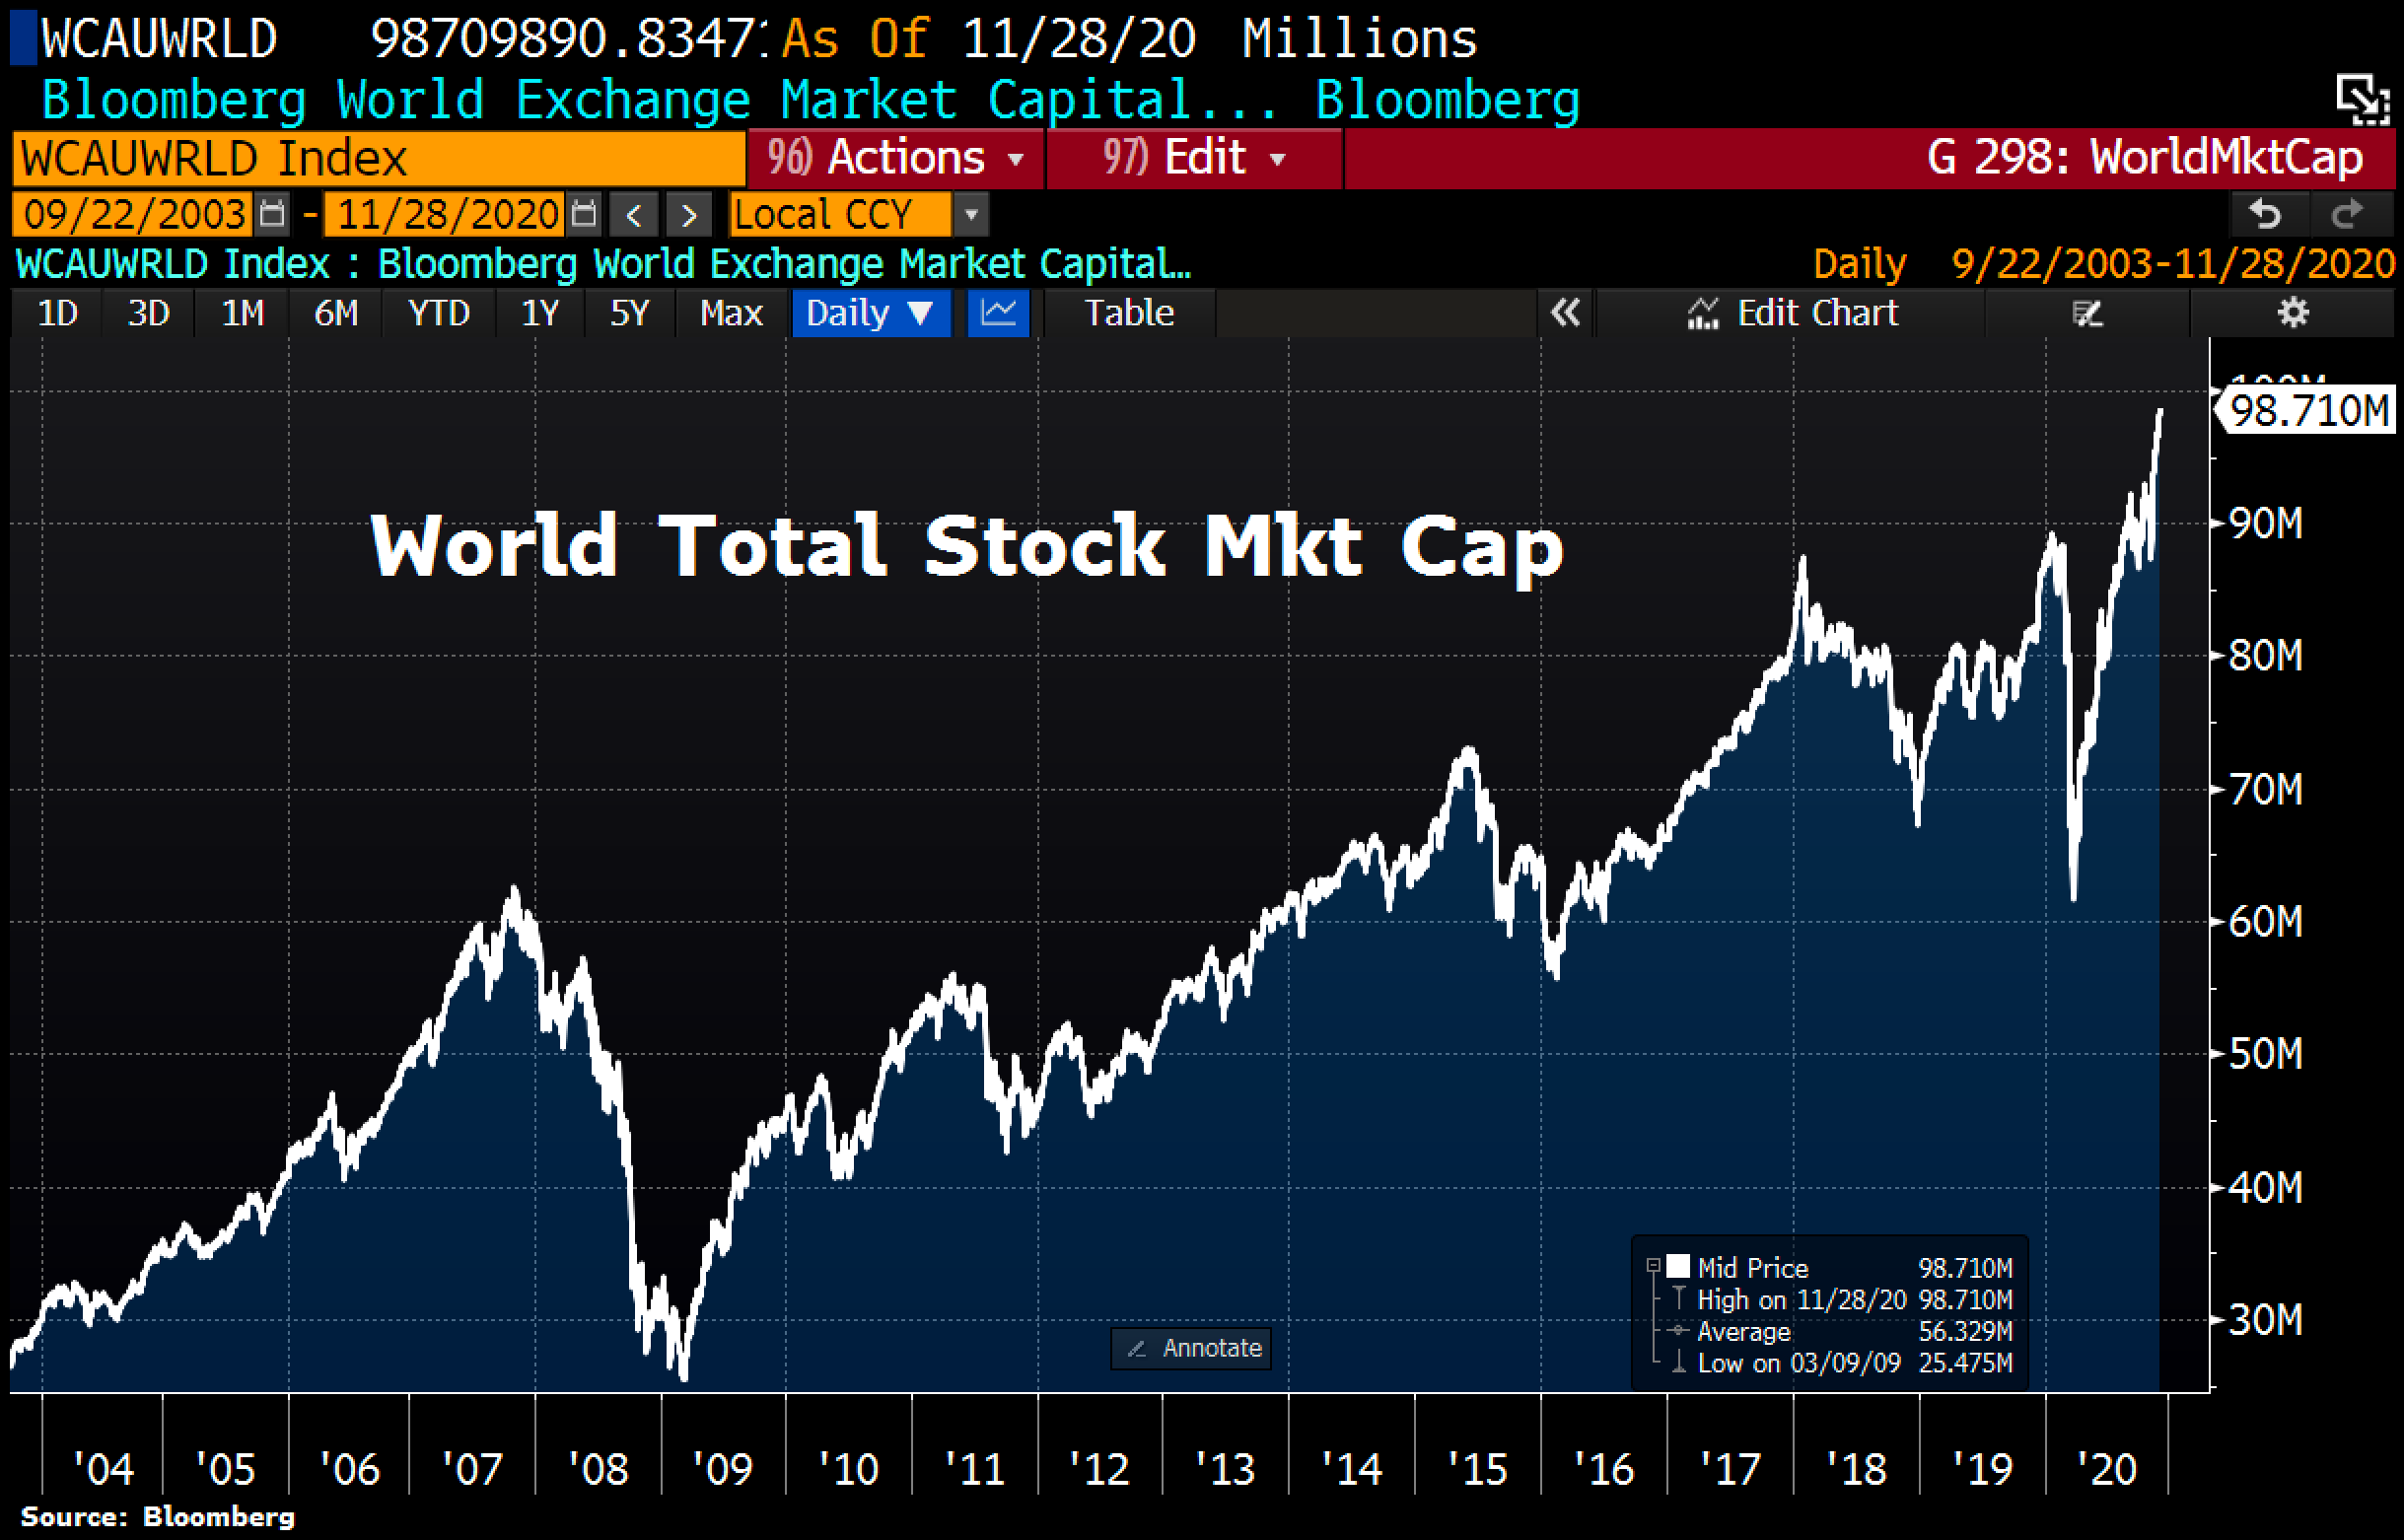
World Total Stock Market Cap. Source: ©Holger Zschaepitz, Schuldensuehner, 28th of November 2020
The consequences are steeply rising stock markets, into which the new currency is primarily migrating. Not surprisingly, the MSCI World has therefore reached a global market capitalization of almost US$100 trillion. This in turn corresponds to approximately 112% of global GDP. Global liquidity is causing all asset classes to explode. While investors and financial market players are celebrating, for the majority of the world’s population nothing remains but rising costs of living and thus increasingly difficult living conditions. Of course, this has nothing to do with free markets and capitalism. On the contrary, the only name for this mess is “Centrally controlled techno-cleptocracy”.
Conclusion: Bitcoin – The market wants to see the all-time high
The bull market for Bitcoin is undoubtedly back. Already since the sell-off in March and from the lows around US$3,800 a new uptrend had established itself. With the strong rise during the last three months, the last doubts should have been removed in the meantime!
Whenever Bitcoin started to run in the past, it couldn’t be stopped anymore. Each time a traffic bull-run marched through all resistances and skeptics exceeding all conservative price targets by far. It might be exactly the same this time again. Prices around US$100,000 therefore appear absolutely realistic on a 12 to 24 months horizon. If the current bull market is as strong as the last one between 2015 and 2017, a price extension in the range of US$327,000 would be conceivable!
If you own 1 Bitcoin, you’re part of the 0.2%.
— Dan Held (@danheld) November 25, 2020
In any case, Bitcoin is the winner of a crazy year in the financial markets, as the “King of Crypto” is extremely scarce as a sovereign decentralized currency and thus an ideal vehicle for securing your wealth in times of hot running printing presses. One can even say that there are only two things in a human life that have absolute and finite scarcity: 1. time 2. Bitcoin.
Bitcoin – The market wants to see the all-time high
Technically, the tension in the Bitcoin markets continues to rise practically every hour. Will the jump over the psychological mark of US$20,000 be successful? And if so, how far can prices then directly advance? Or will there be a short but sharp pullback first? And how do the numerous new market participants behave who have not yet had any experience with the crazy volatility of Bitcoin?
In view of the clear strength, the market obviously wants to see the all-time high and thus prices above US$20,000 as soon as possible. At the same time, sentiment seems to have run a little too hot in the short term. A brief overshooting in the direction of US$22,000 to US$25,000 would be logical and would satisfy the bulls that are pushing higher. Afterwards, however, a severe pullback in the range of 30 – 45% should provide a cold shower and thus the urgently needed temporary cooling.
In conclusion, the long-term outlook for Bitcoin remains extremely positive. New all-time highs and further massive price increases against all Fiat currencies are only a question of the time. The breakout above the all-time high at US$20,000 seems to be imminent, too. This means that the volatile party should really get going next year. Already somewhat larger pullbacks of US$2,000 to 4,000 are now buying opportunities.
Analysis sponsored and initially published on December 4th, 2020, by www.celticgold.eu.
We post real time entries and exits for Bitcoin and crypto-assets in our free Telegram channel.
If you like to get regular updates on our gold model, precious metals and cryptocurrencies you can subscribe to our free newsletter.

