


Bitcoin – Strong Performance
Review
Since our last bitcoin analysis on September 17th, the price of Bitcoin had initially fallen back to USD 10,150. In retrospect, this has already been the lowest rate in the last four weeks. Since then, Bitcoin started slowly creeping higher. It was only since October 8th that the increase to US$10,800 and then, in particular, the breakout above US$11,000 brought bullish momentum back into the market. Bitcoin – Strong Performance.
Driven by a further technical improvement as well as numerous very positive developments (Raoul Pal: The Bitcoin Life Raft) as well as favorable fundamental news (MicroStrategy, PayPal), bitcoin was able to rise further in the last two weeks. Finally, it conquered the round mark of US$12.000 on October 21st without any problems. As a result, the technical picture has improved quite significantly.
Accordingly, prices have been rising sharply over the last few days and with US$13,225 Bitcoin reached its highest level since the beginning of July 2019! Now not much is missing for breakout above those highs at US$13,800. Should it happen, a fast and spectacular bull run towards the all-time high at US$20,000 is likely to follow.
Technical Analysis For Bitcoin in US-Dollar
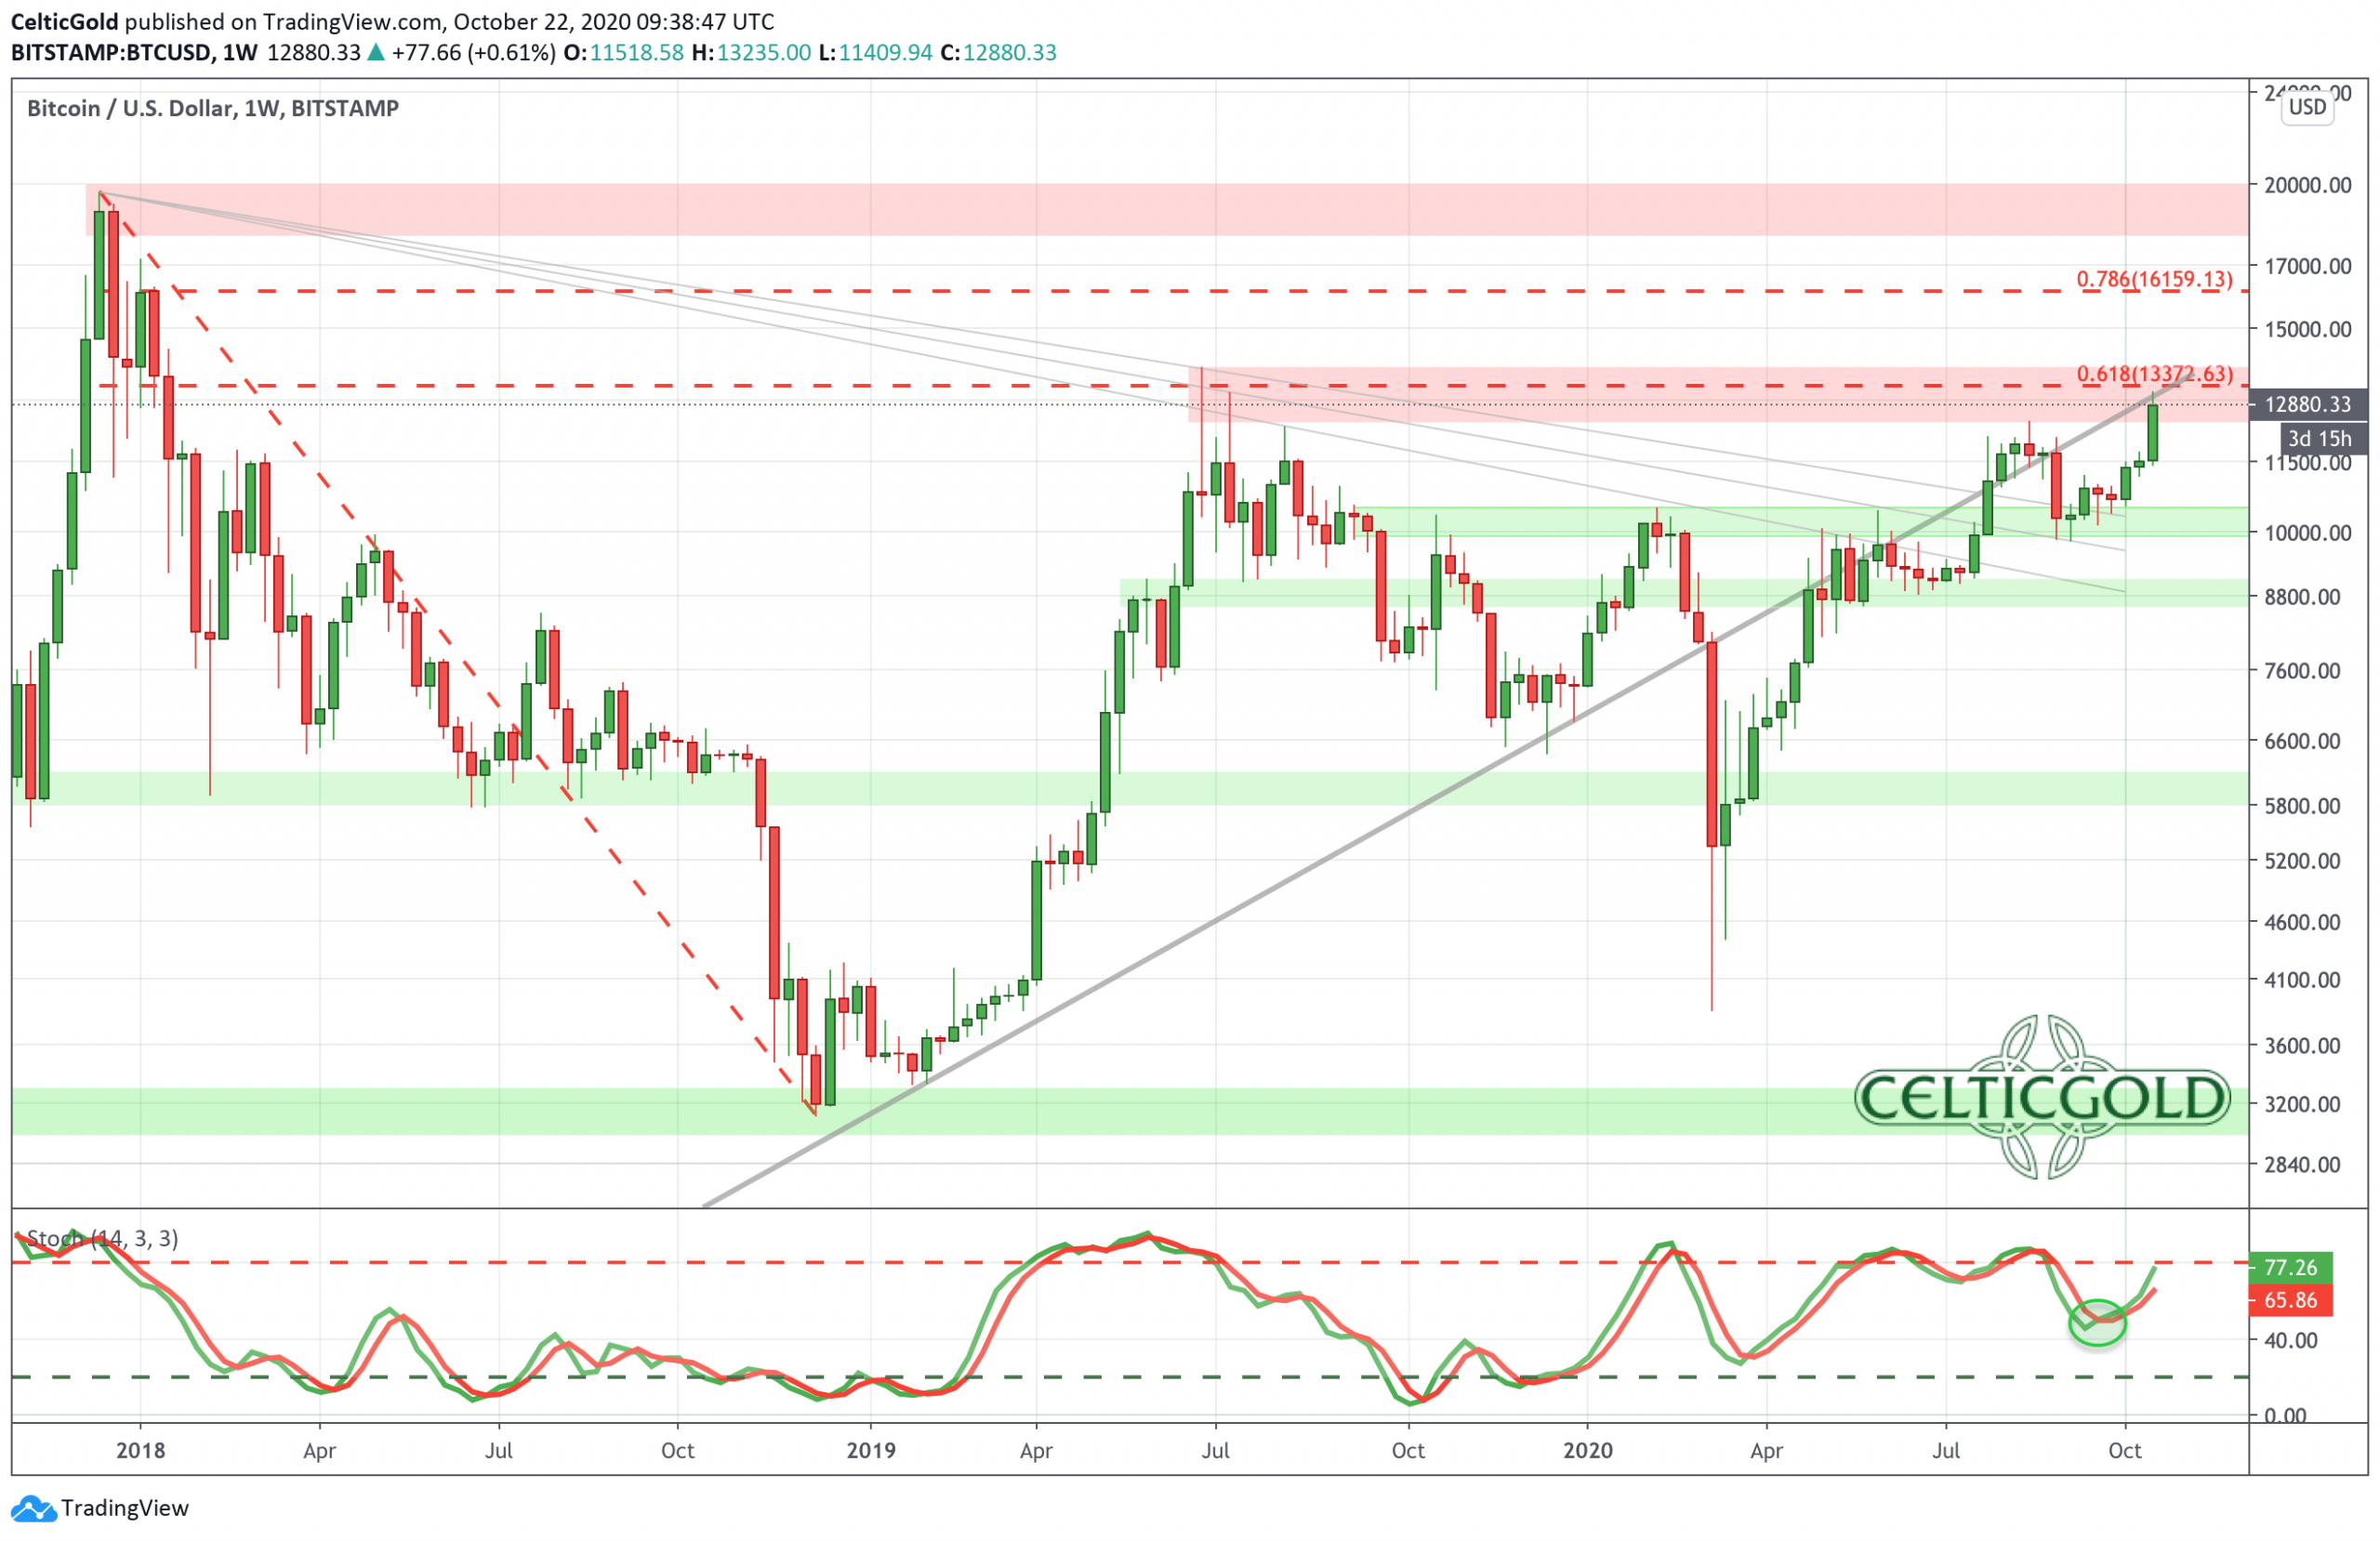
Bitcoin Weekly Chart as of October 22nd 2020, Source: Tradingview
With the sharp rise in recent days, bitcoin may have finally awakened from its slumber. At the same time, however, bitcoin has once again reached its long-standing uptrend-line on the weekly chart. In June and most recently in August, the Bulls failed to make a sustained move back above this line. On top, bitcoin has now reached its strong resistance zone between US$13,000 and US$13,800. One year ago, the spectacular rally ended here followed by an eight-month pullback and temporary prices below US$4.000. In addition, the Stochastic oscillator has almost reached its overbought zone. These three points should make it clear that bitcoin at prices just around US$13,000 certainly does not provide a risk/reward-ratio for new long positions.
Expect the rally to continue towards US$13,800 to US$14,000
However, and at the same time, there is not a single indication that Bitcoin is on the verge of an important top. Quite the contrary, the weekly chart certainly provides room for further price increases. Nevertheless, at least a breather in the zone between US$12.500 and US$13.800 should be expected. If you’re afraid of missing the rally towards the all-time high and haven’t invested yet, you can now try to fish for any possible pullback by placing limit orders below US$12,500 and US$12,000. However, this approach is not ideal, as it contradicts the rule of “buy low and sell high”. Nevertheless, the possibility that the Bitcoin train will now simply continue towards US$20,000 is not to be dismissed!
Overall, the weekly chart is bullish and still has room to move higher. Should the stochastic oscillator embed above 80, we could see a few more weeks of strong upward pressure. In particular, a breakout above US$14,000 activates a more or less direct rally to the all-time high at around US$20,000. Immediate downside risks are not visible on the chart, apart from possible profit taking at any time. But as said already, current setup does not offer a reasonable risk/reward-ratio for new long positions.
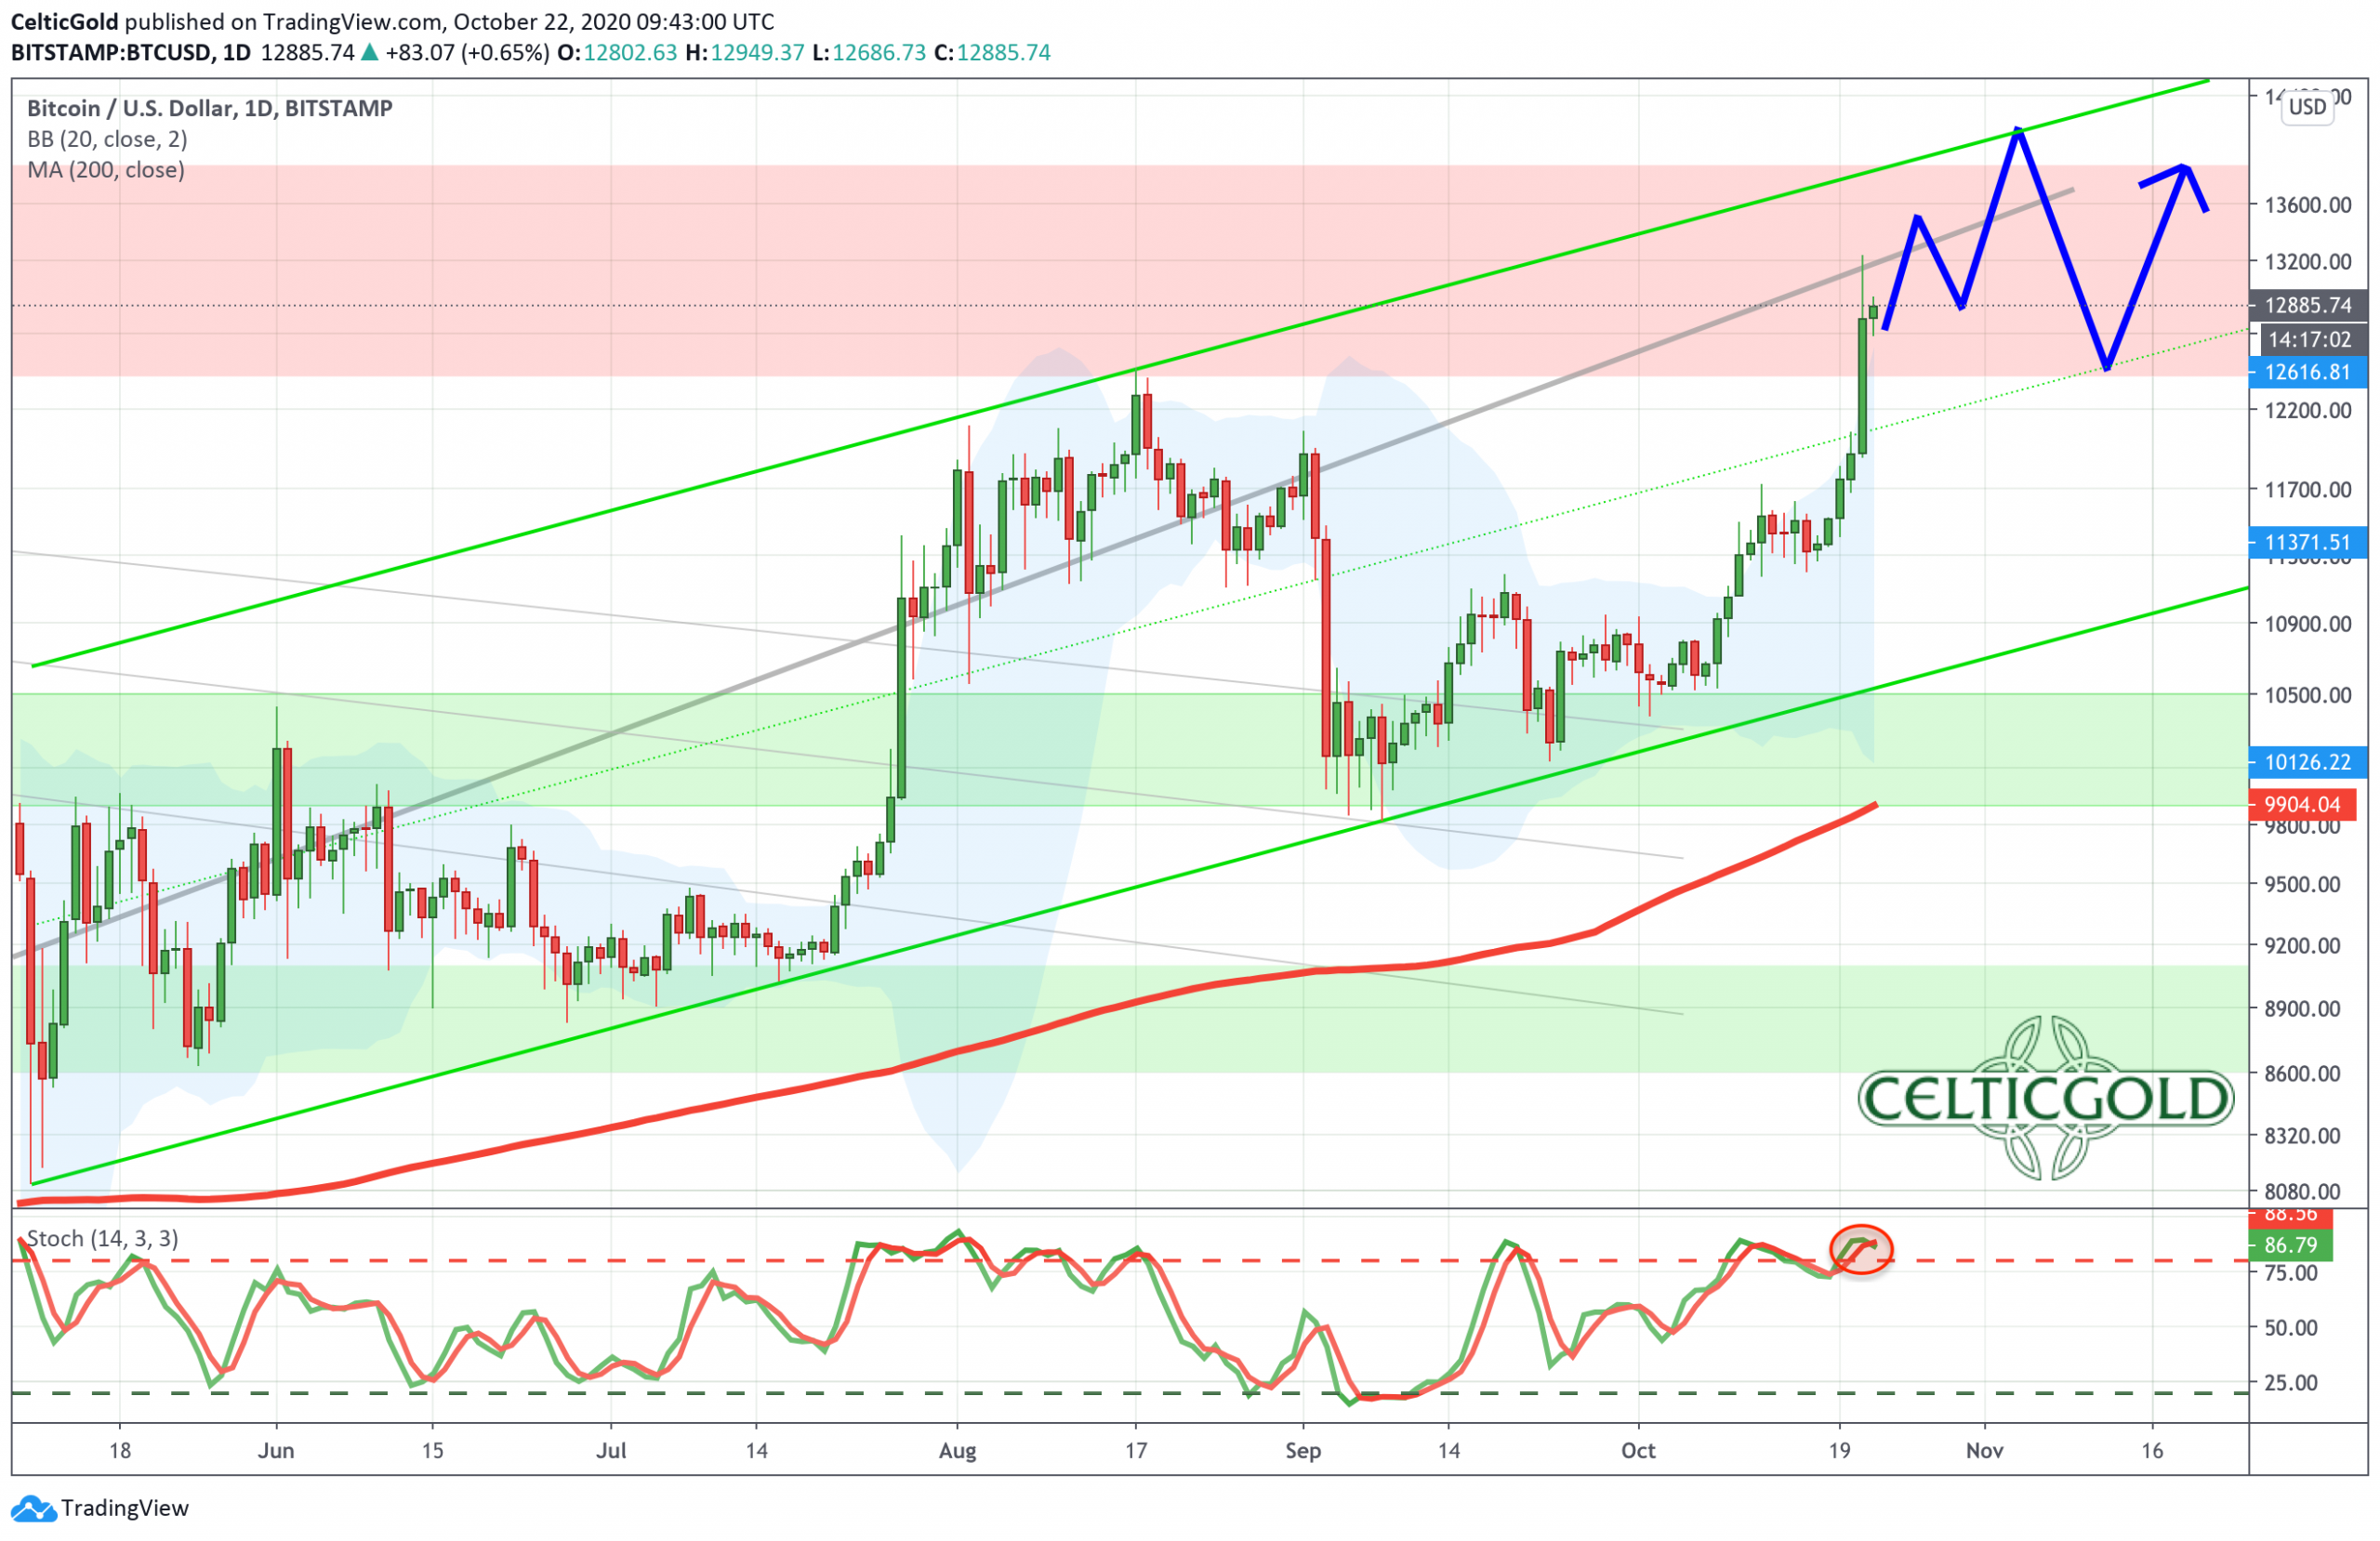
Bitcoin Daily Chart as of October 22nd 2020. Source: Tradingview
On the daily chart, bitcoin has been running within an uptrend channel since mid of May and is currently bending the upper Bollinger Band (US$12,616) upwards. Of course, the daily chart is overbought. Hence the air is getting thinner. Nevertheless, within the uptrend channel, further increases towards US$13,800 are likely just a question of time. With the rising 200-day moving average just below US$10,000, the uptrend is clearly confirmed. In the “worst-case” a pullback to around US$10,000 would be conceivable. However, the probability for such a pullback (approx. 25%) is very low. On the opposite, it is much more likely that we will see only a temporary back-and-forth between US$12,500 and US$13,800 before the breakout exceeds US$14,000.
In the conclusion, the daily chart is bullish too. The daily Stochastic Oscillator has transformed from an overbought setup to the embedded super bullish state. This has locked in the uptrend. Therefore, don’t sell Bitcoin short, but simply let your profits run and only add to your position if there is at least a bit larger pullback.
Commitments of Traders Report For Bitcoin – Strong Performance
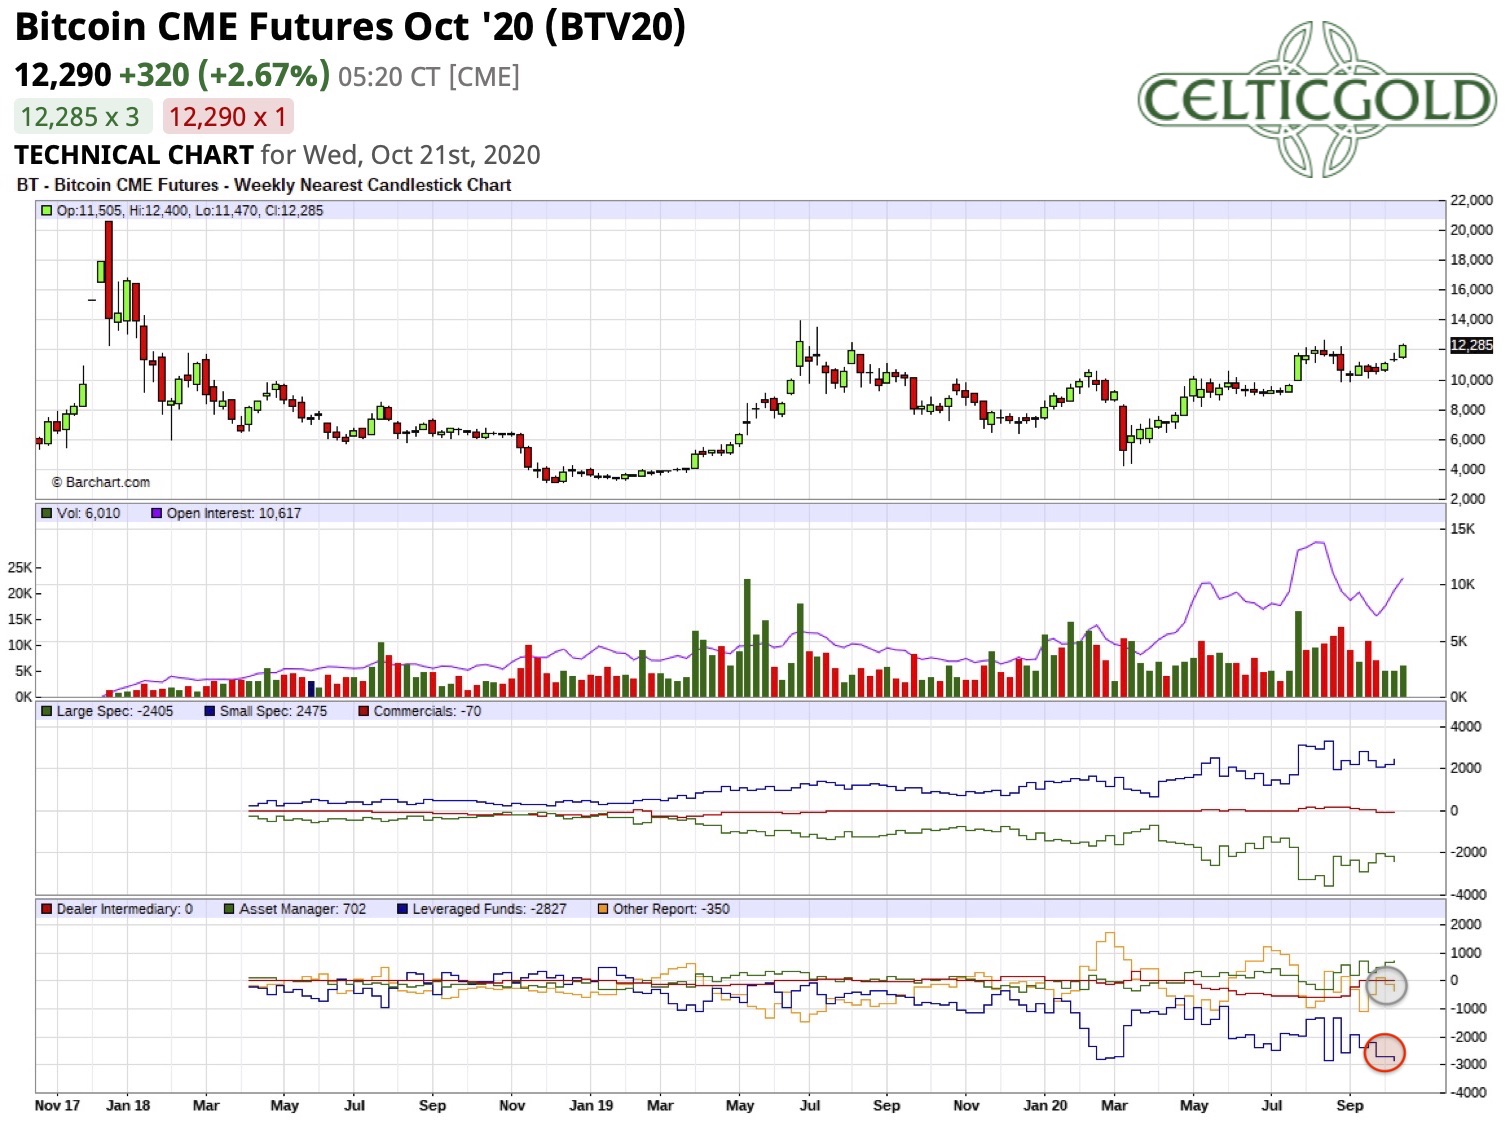
Bitcoin CME Future CoT-report, as of October 21st 2020. Source: Barchart
Although Bitcoin futures have only been trading since December 17th, 2017, the CoT report (Commitment of Trades), which is published every Friday evening, offers an interesting overview of the positions and is definitely a helpful tool to analyze the Bitcoin market. However, I must mention that the overall trading volume is still relatively low. Note as well that the bitcoin future with the symbol XBT is trading at the CBOE, while the symbol BTC refers to the CME.
However, the current CoT report provides a mixed to rather unfavorable picture. Particular, the subgroup called “Other Reportables”, which we always pay extra attention to, has not positioned itself on the long side in recent weeks. Instead these commercial participants cumulatively hold a small short position. The “leveraged funds”, on the other hand, are once again heavily engaged on the short side and do hold a similarly high short-position like they did just before the Corona crash in last February.
Overall, the current setup suggests that the “smart money” will be on the sell side at prices between US$13, 000 and US$14,000. Actually, it looks like they are speculating on lower prices in the medium term. Hence, the analysis of the weekly CoT report does not currently suggest a good starting position for a sustainable rally up to the all-time high at US$20,000.
Sentiment Bitcoin – Strong Performance
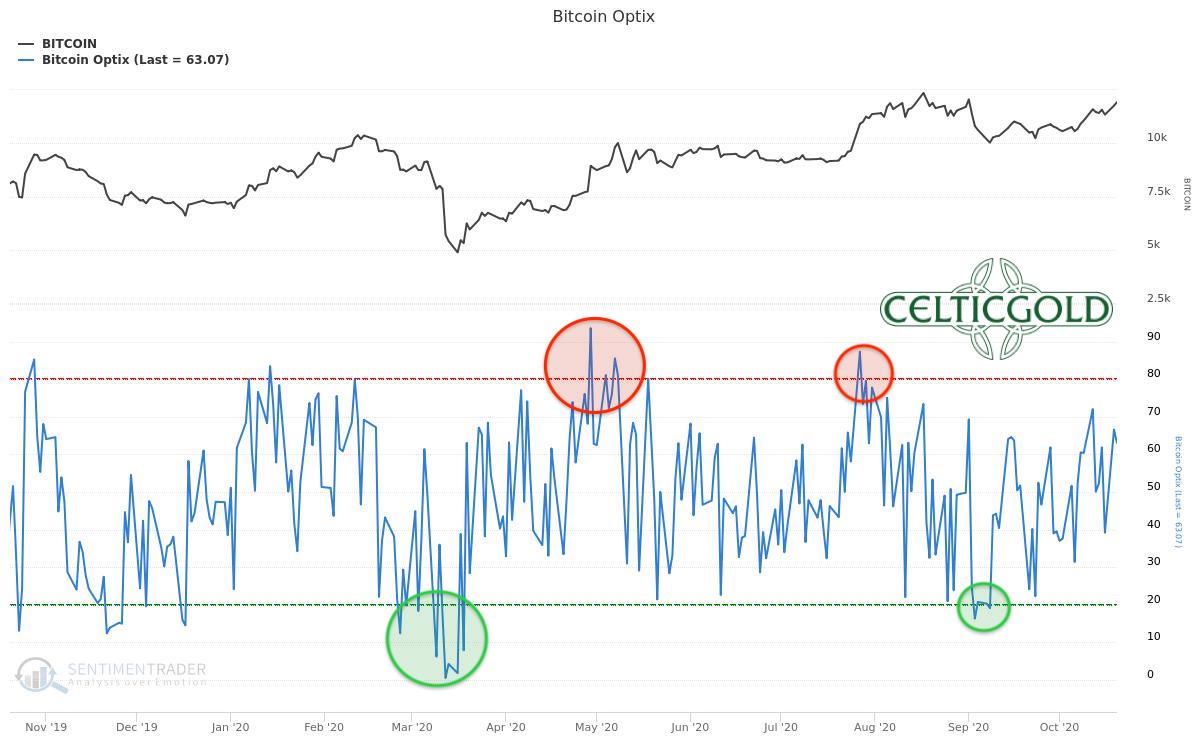
Bitcoin Optix as of October 21st, 2020. Source: Sentimentrader
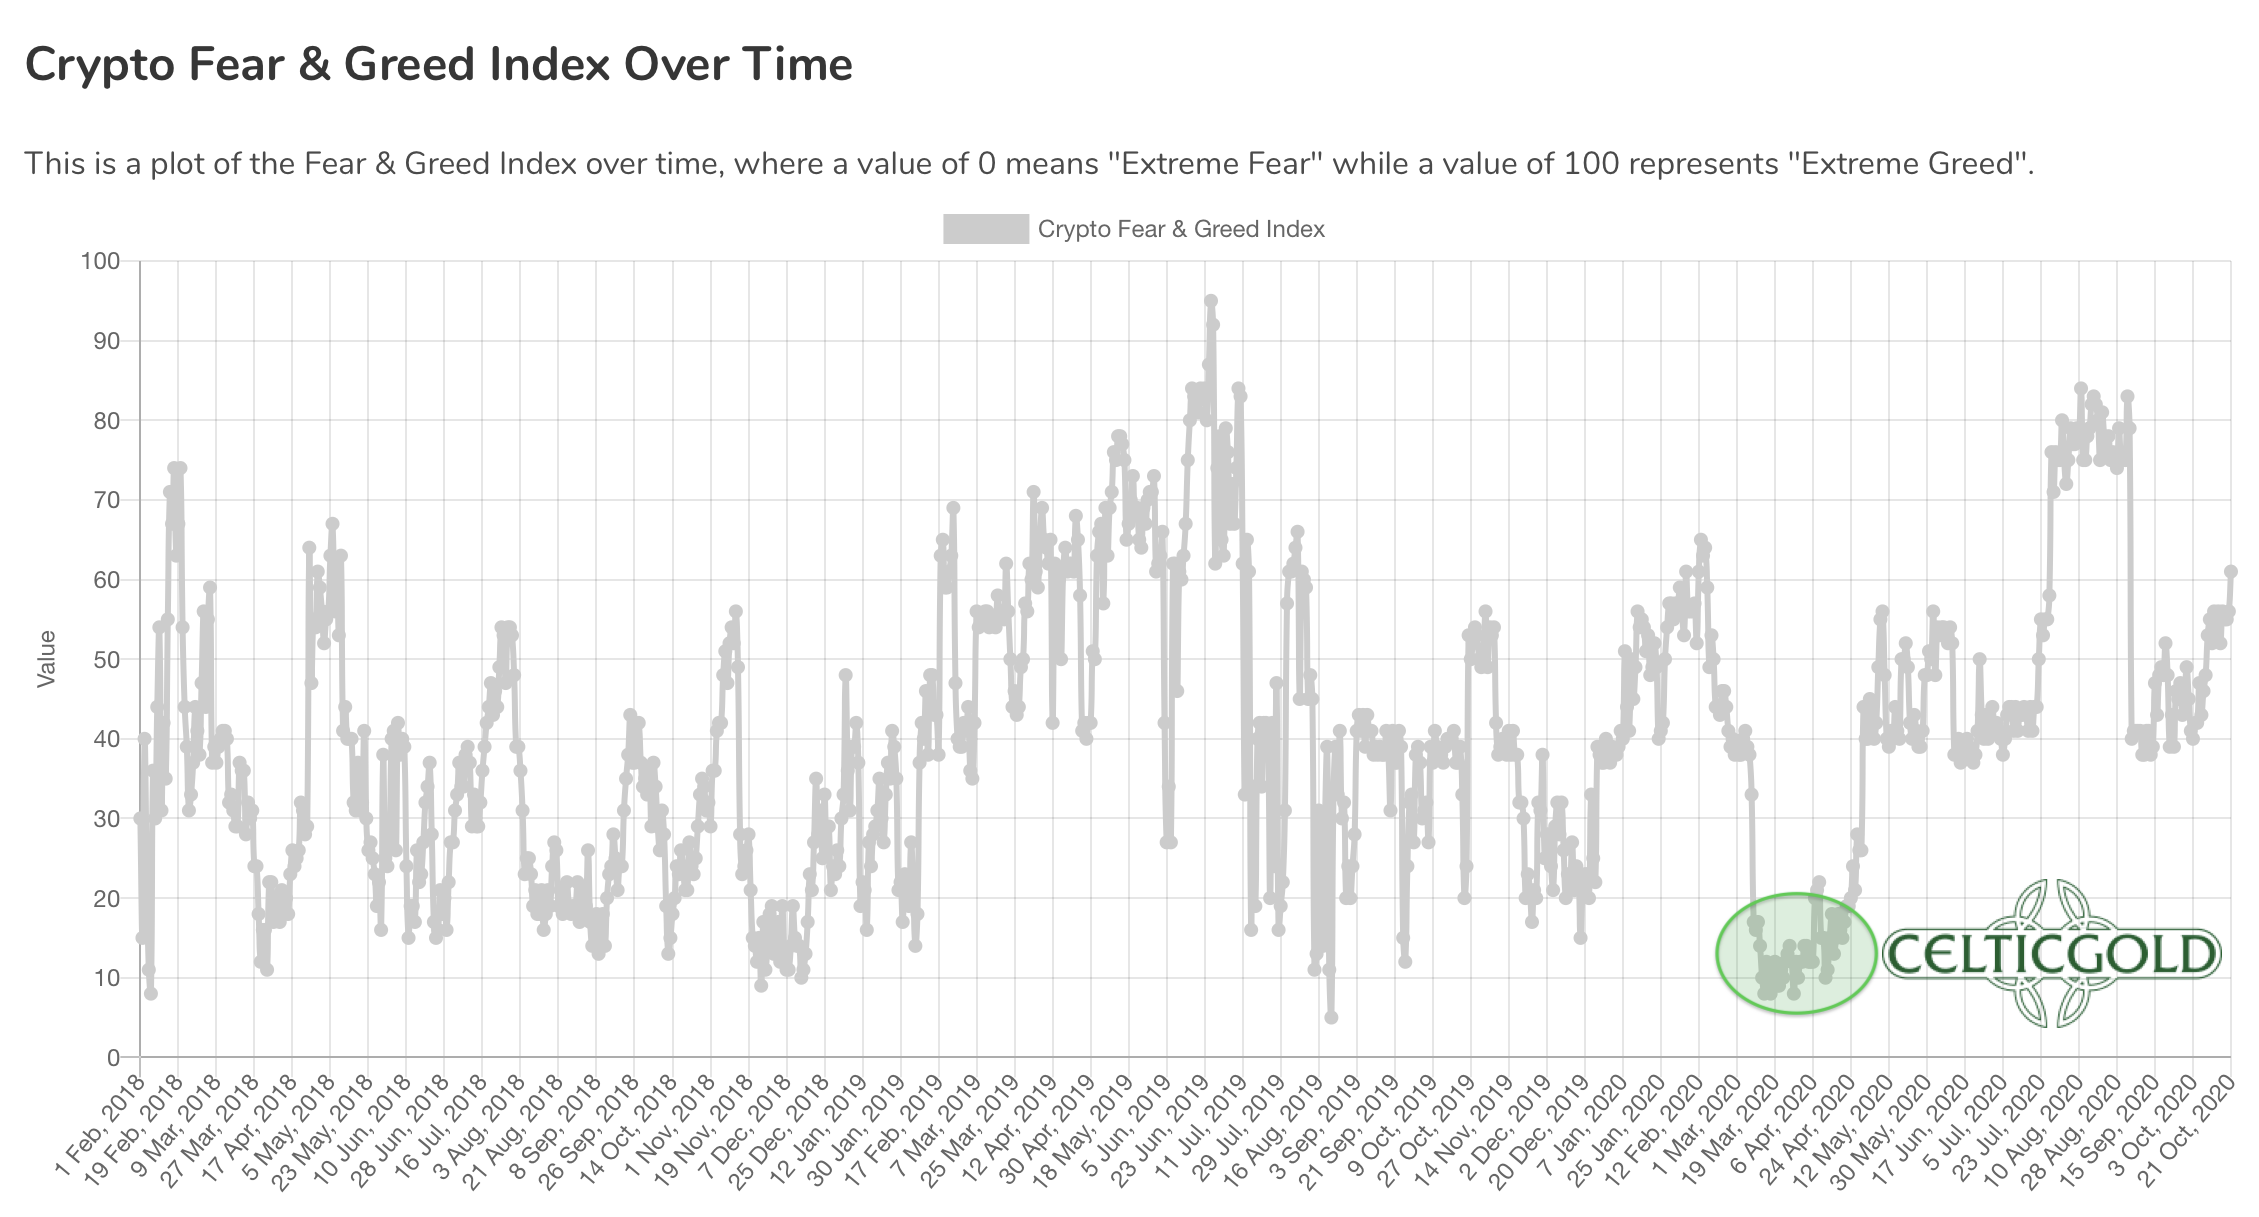
Crypto Fear & Greed Index as of October 21st, 2020. Source: Crypto Fear & Greed Index
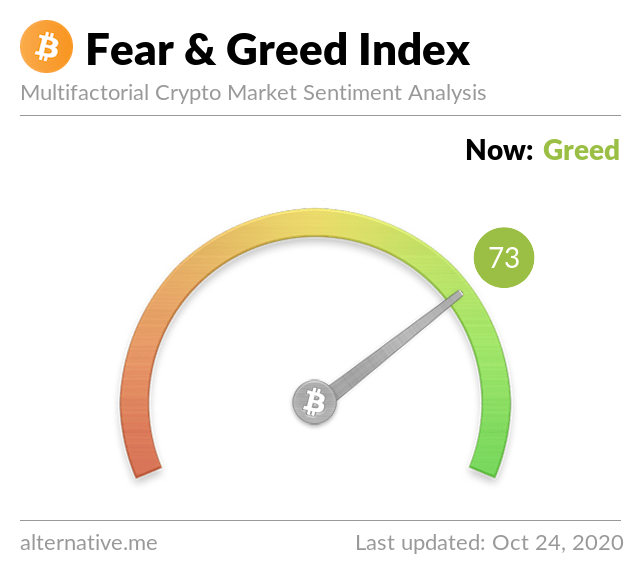
Crypto Fear & Greed Index as of October 24th, 2020. Source: Crypto Fear & Greed Index
The current sentiment data reflects a strongly increased optimism due to the sharp price increases over the last few days. There are no extreme values yet, but an increased degree of caution is already appropriate. In retrospect, the short but crisp correction in early September was the last time with elevated pessimism levels. However, there have been no real panicking sentiment since the Corona crash in March. Long-term and contrarian investors therefore did not find a really favorable entry opportunity during the last seven months. In retrospect, any medium-sized pullback was buying opportunity.
Overall, the growing optimism is not yet standing in the way for higher prices. However, if bitcoin can continue its rally towards US$13,800 – 14,000, sentiment values are likely to overheat. In any case, now is no longer the right time to blindly chase bitcoin after the recent rally.
Seasonality Bitcoin – Strong Performance
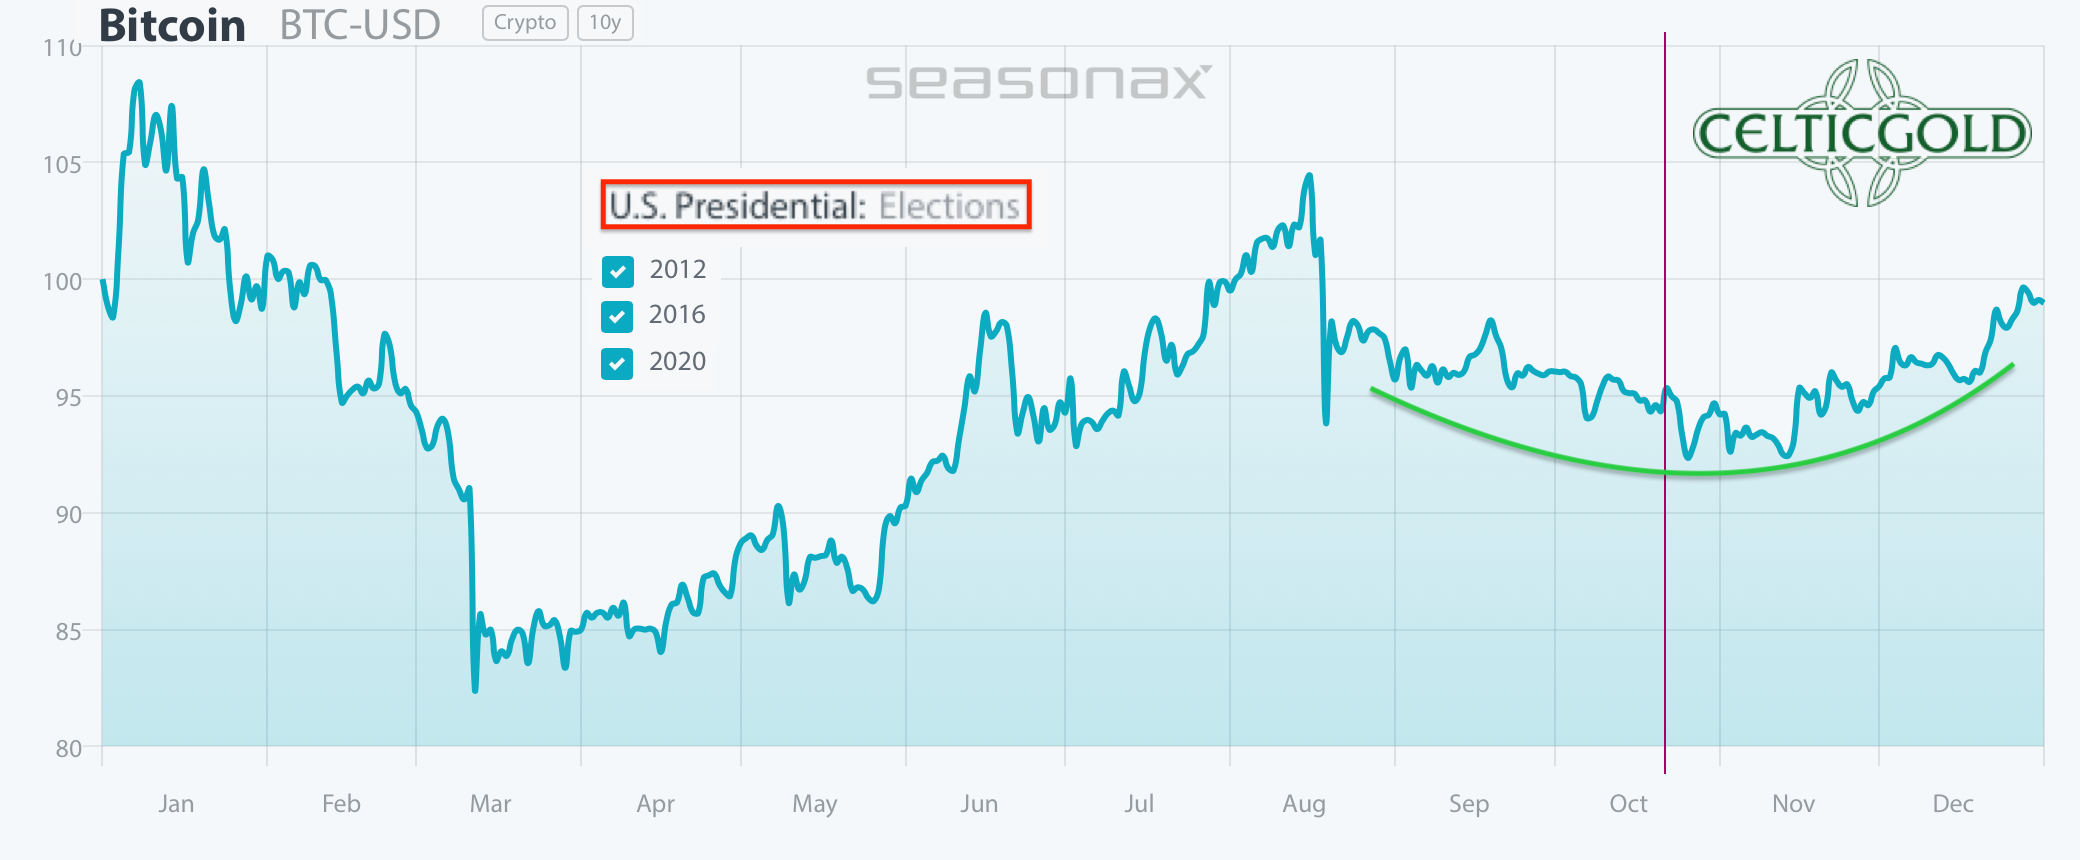
Bitcoin seasonality in US election years. Source: Seasonax
The US election is less than two weeks away and could still surprise and upset the markets. In particular, if either party were to contest the election result, the uncertainty is likely to cause turmoil and temporary pullbacks in all sectors.
Seasonal-wise, bitcoin is now entering a favorable phase, usually pushing prices up into December. In the US election years of 2012 and 2016, however, prices remained trapped in a sideways period until mid of November. Hence, the price of Bitcoin will certainly be influenced by the election result.
From a seasonal perspective, the probability favors rising bitcoin prices in coming weeks and months.
Sound-money: Bitcoin vs. Gold
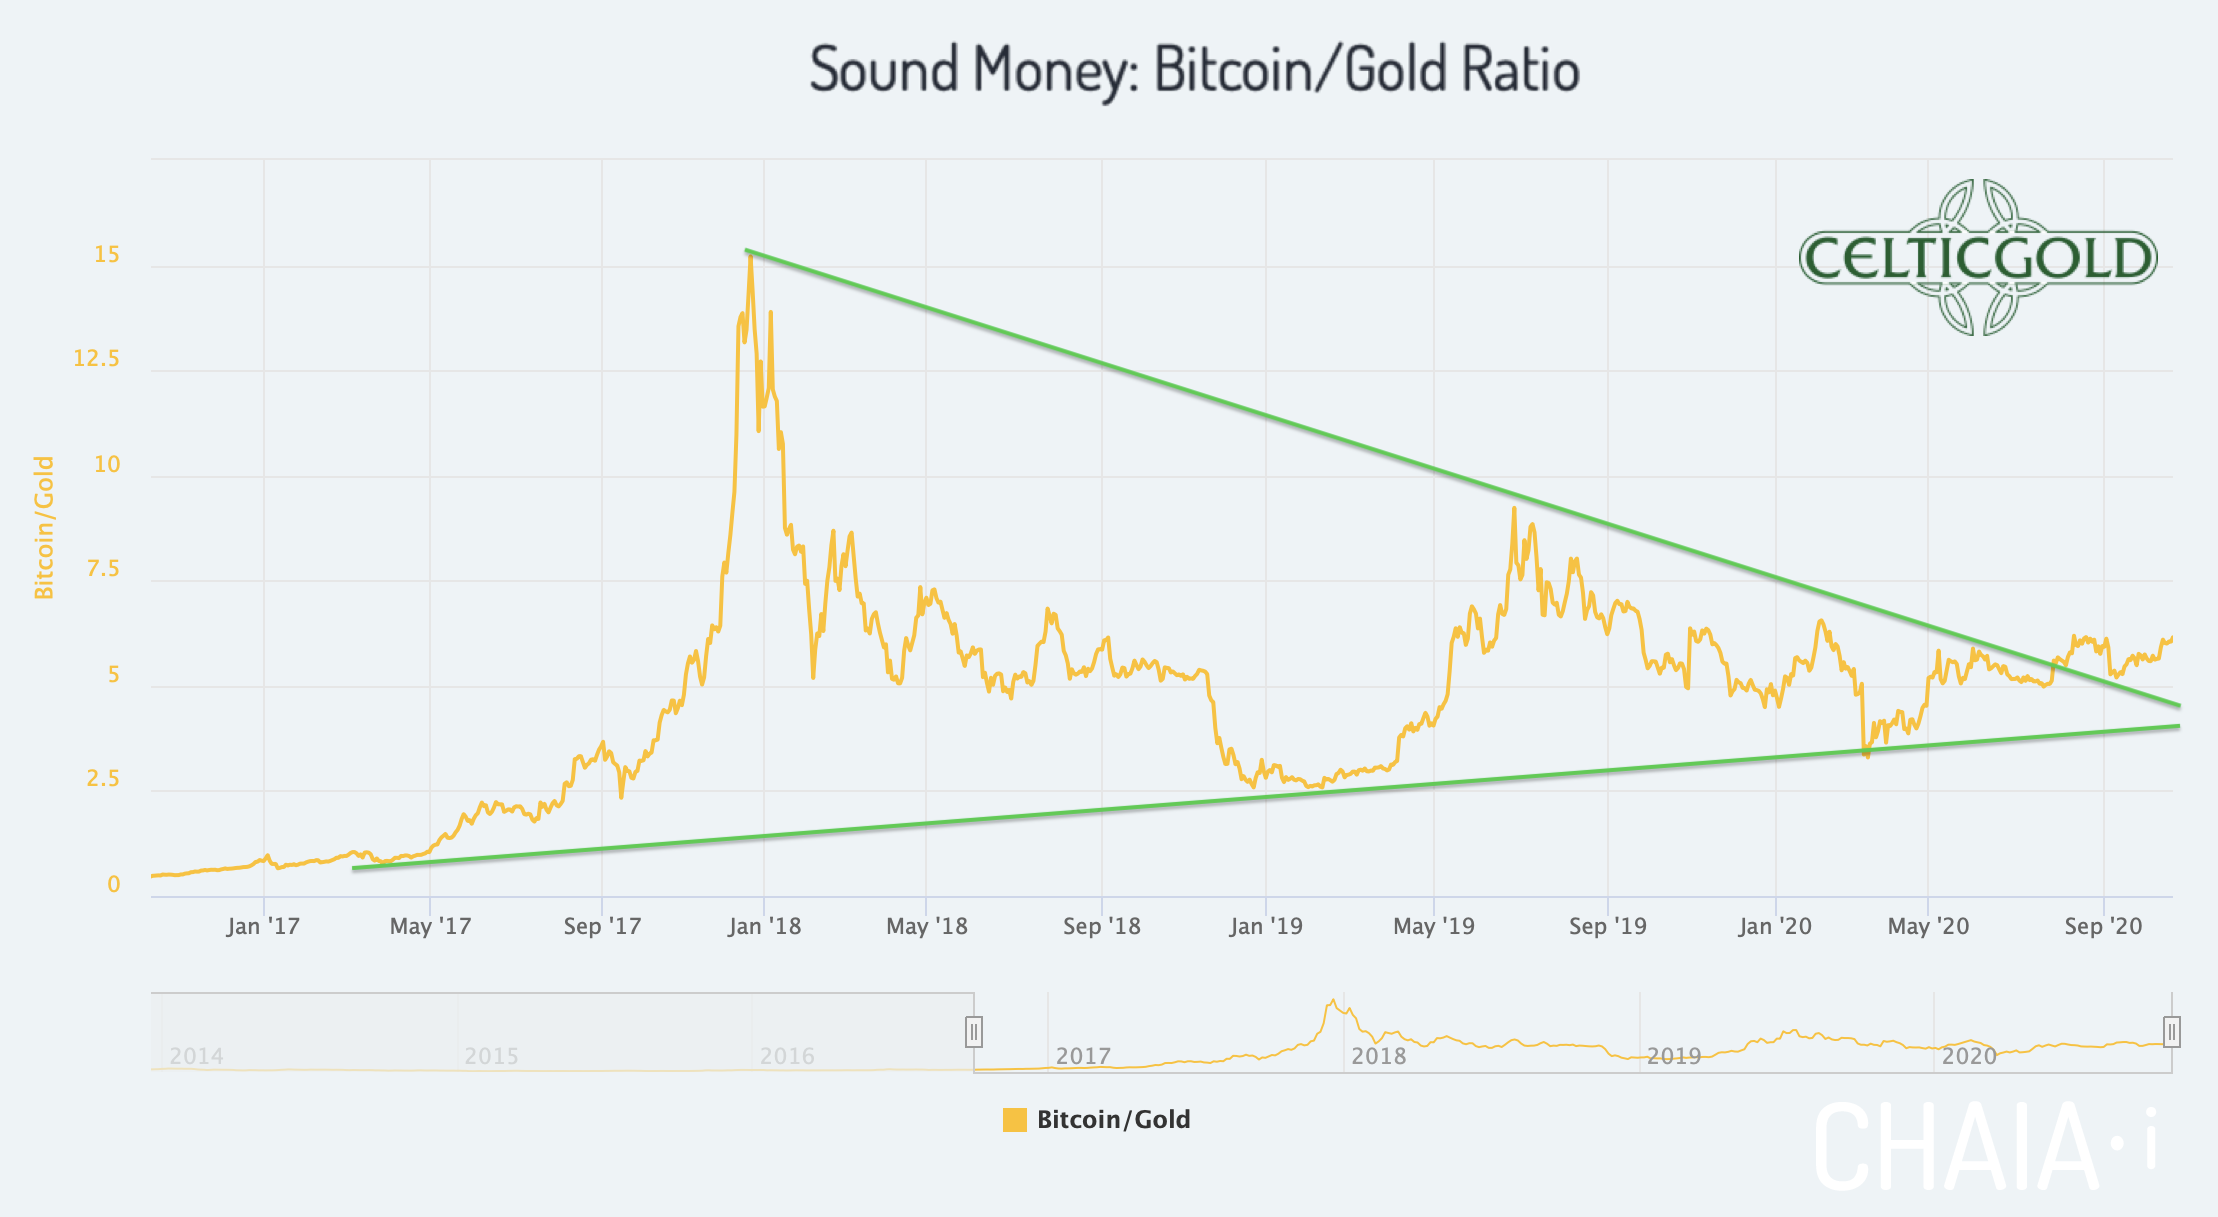
Sound Money Bitcoin/Gold-Ratio as of October 21st, 2020. Source: Chaia
With current prices of US$12,960 for one Bitcoin and US$1,901 for one troy ounce of Gold, the bitcoin/gold-ratio currently sits at 6,81. That means you have to pay almost seven ounces of gold for one bitcoin. Vice versa, one troy ounce of gold currently costs only 0,146 Bitcoin.
At the end of July, bitcoin had finally broken out from its big triangle against the price of gold. Although this breakout initially led to a first rapid increase, the bitcoin/gold-ratio then returned to the former resistance line due to the strong gold price. However, this test was successful, so that bitcoin has now clearly outperformed the price of gold in recent weeks and the bitcoin/gold-ratio seems to be on the way up again. This rally has likely just started and should bring a spectacular outperformance of bitcoin against gold over the next few years.
You want to own Bitcoin and gold!
Generally, buying and selling Bitcoin against gold only makes sense to the extent that one balances the allocation in those two asset classes! At least 10% but better 25% of one’s total assets should be invested in precious metals physically, while in cryptos and especially in Bitcoin one should hold at least between 1% and of 5%. If you are very familiar with cryptocurrencies and Bitcoin, you can certainly allocate much higher percentages to Bitcoin on an individual basis. For the average investor, who is normally also invested in equities and real estate, 5% in the still highly speculative and highly volatile Bitcoin is already a lot!
Opposites compliment. In our dualistic world of Yin and Yang, body and mind, up and down, warm and cold, we are bound by the necessary attraction of opposites. In this sense you can view gold and bitcoin as such a pair of strength. With the physical component of gold and the digital aspect of bitcoin you have a complimentary unit of a true safe haven for the 21st century. You want to own both! – Florian Grummes
Macro Outlook
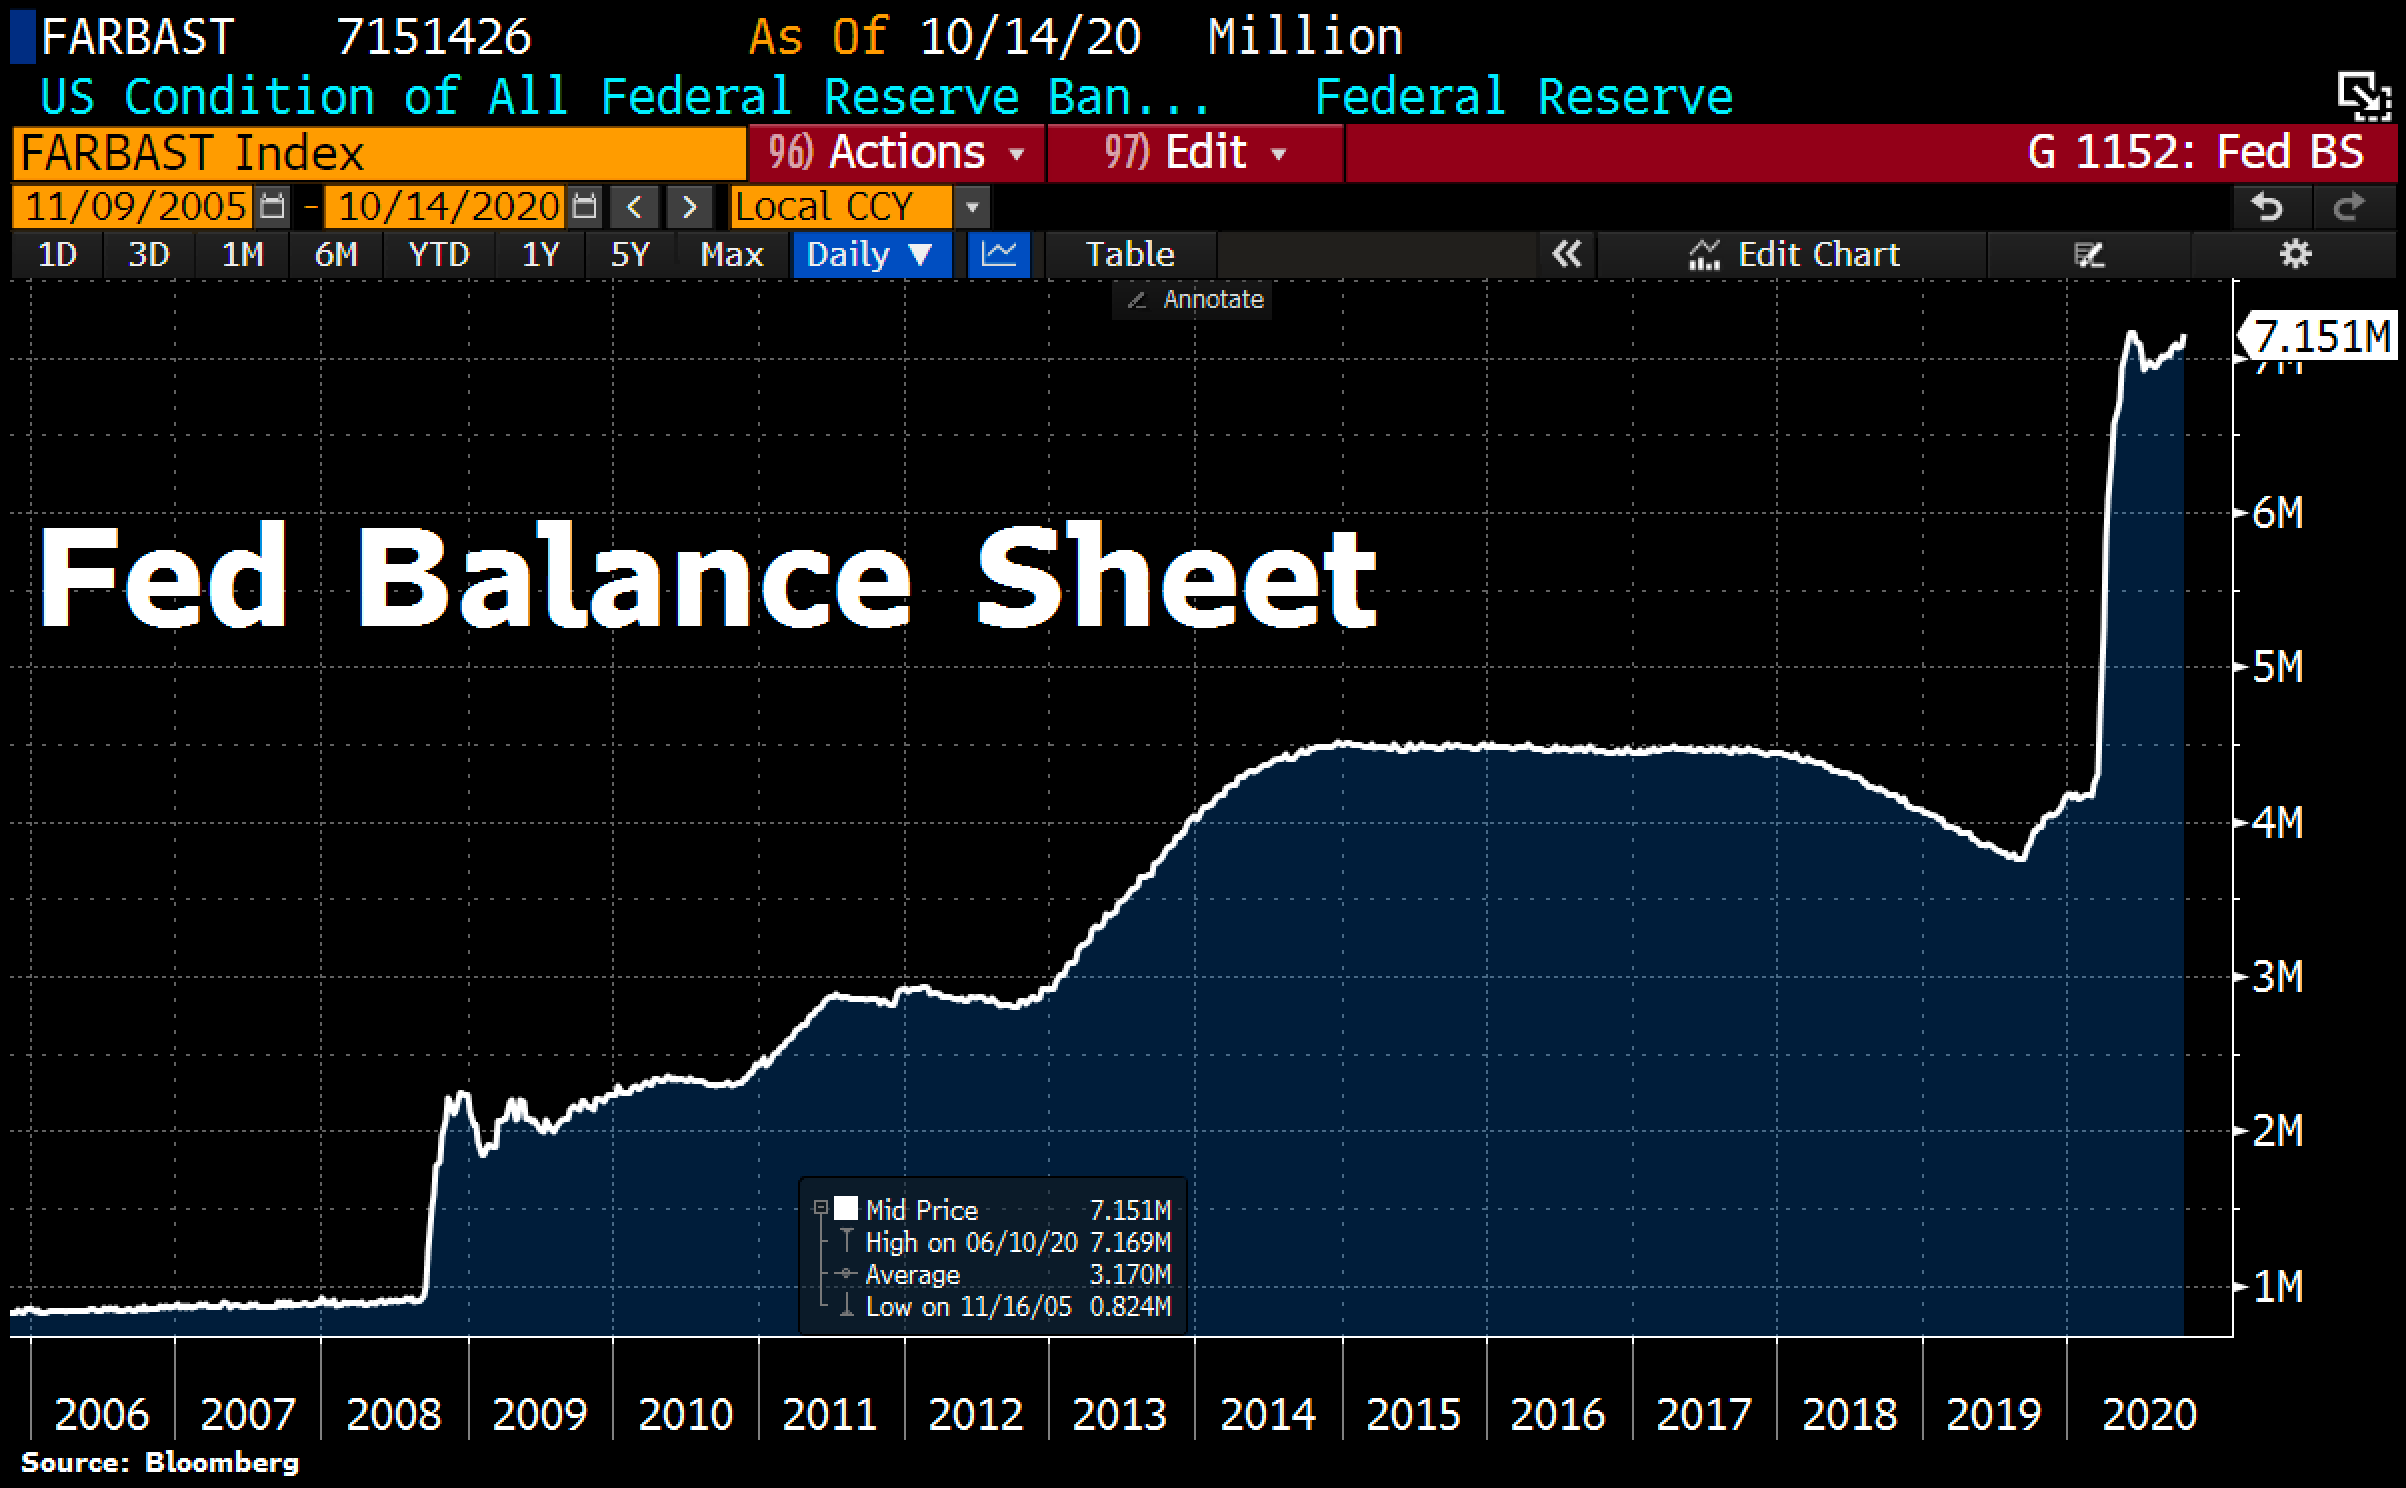
FED Balance sheet. Source: ©Holger Zschaepitz, Schuldensuehner, 17th of October 2020
The US central bank has continued to ramp up its balance sheet in recent weeks. Total assets rose by US$77 billion to a total of US$ 7,15 trillion. This represents the largest increase since May of this year. In particular, the Fed bought mortgage-backed securities (MBS) and treasury bonds (treasuries). The Fed is buying these these treasuries by granting loans to its member banks that hold the Treasuries and adds the funds to its reserve deposits. The Fed balance now represents 37% of annual US gross domestic product (GDP), compared with the ECB balance who represents 66% of the GDP of the eurozone and the central bank in Japan whose balance represents 136% of the Japanese GDP. Hence, the race to the bottom continues as Fed Chairman Powell recently made clear again, that he sees the risk of “doing too little” (“Risks of overdoing it on aid” than too little”).
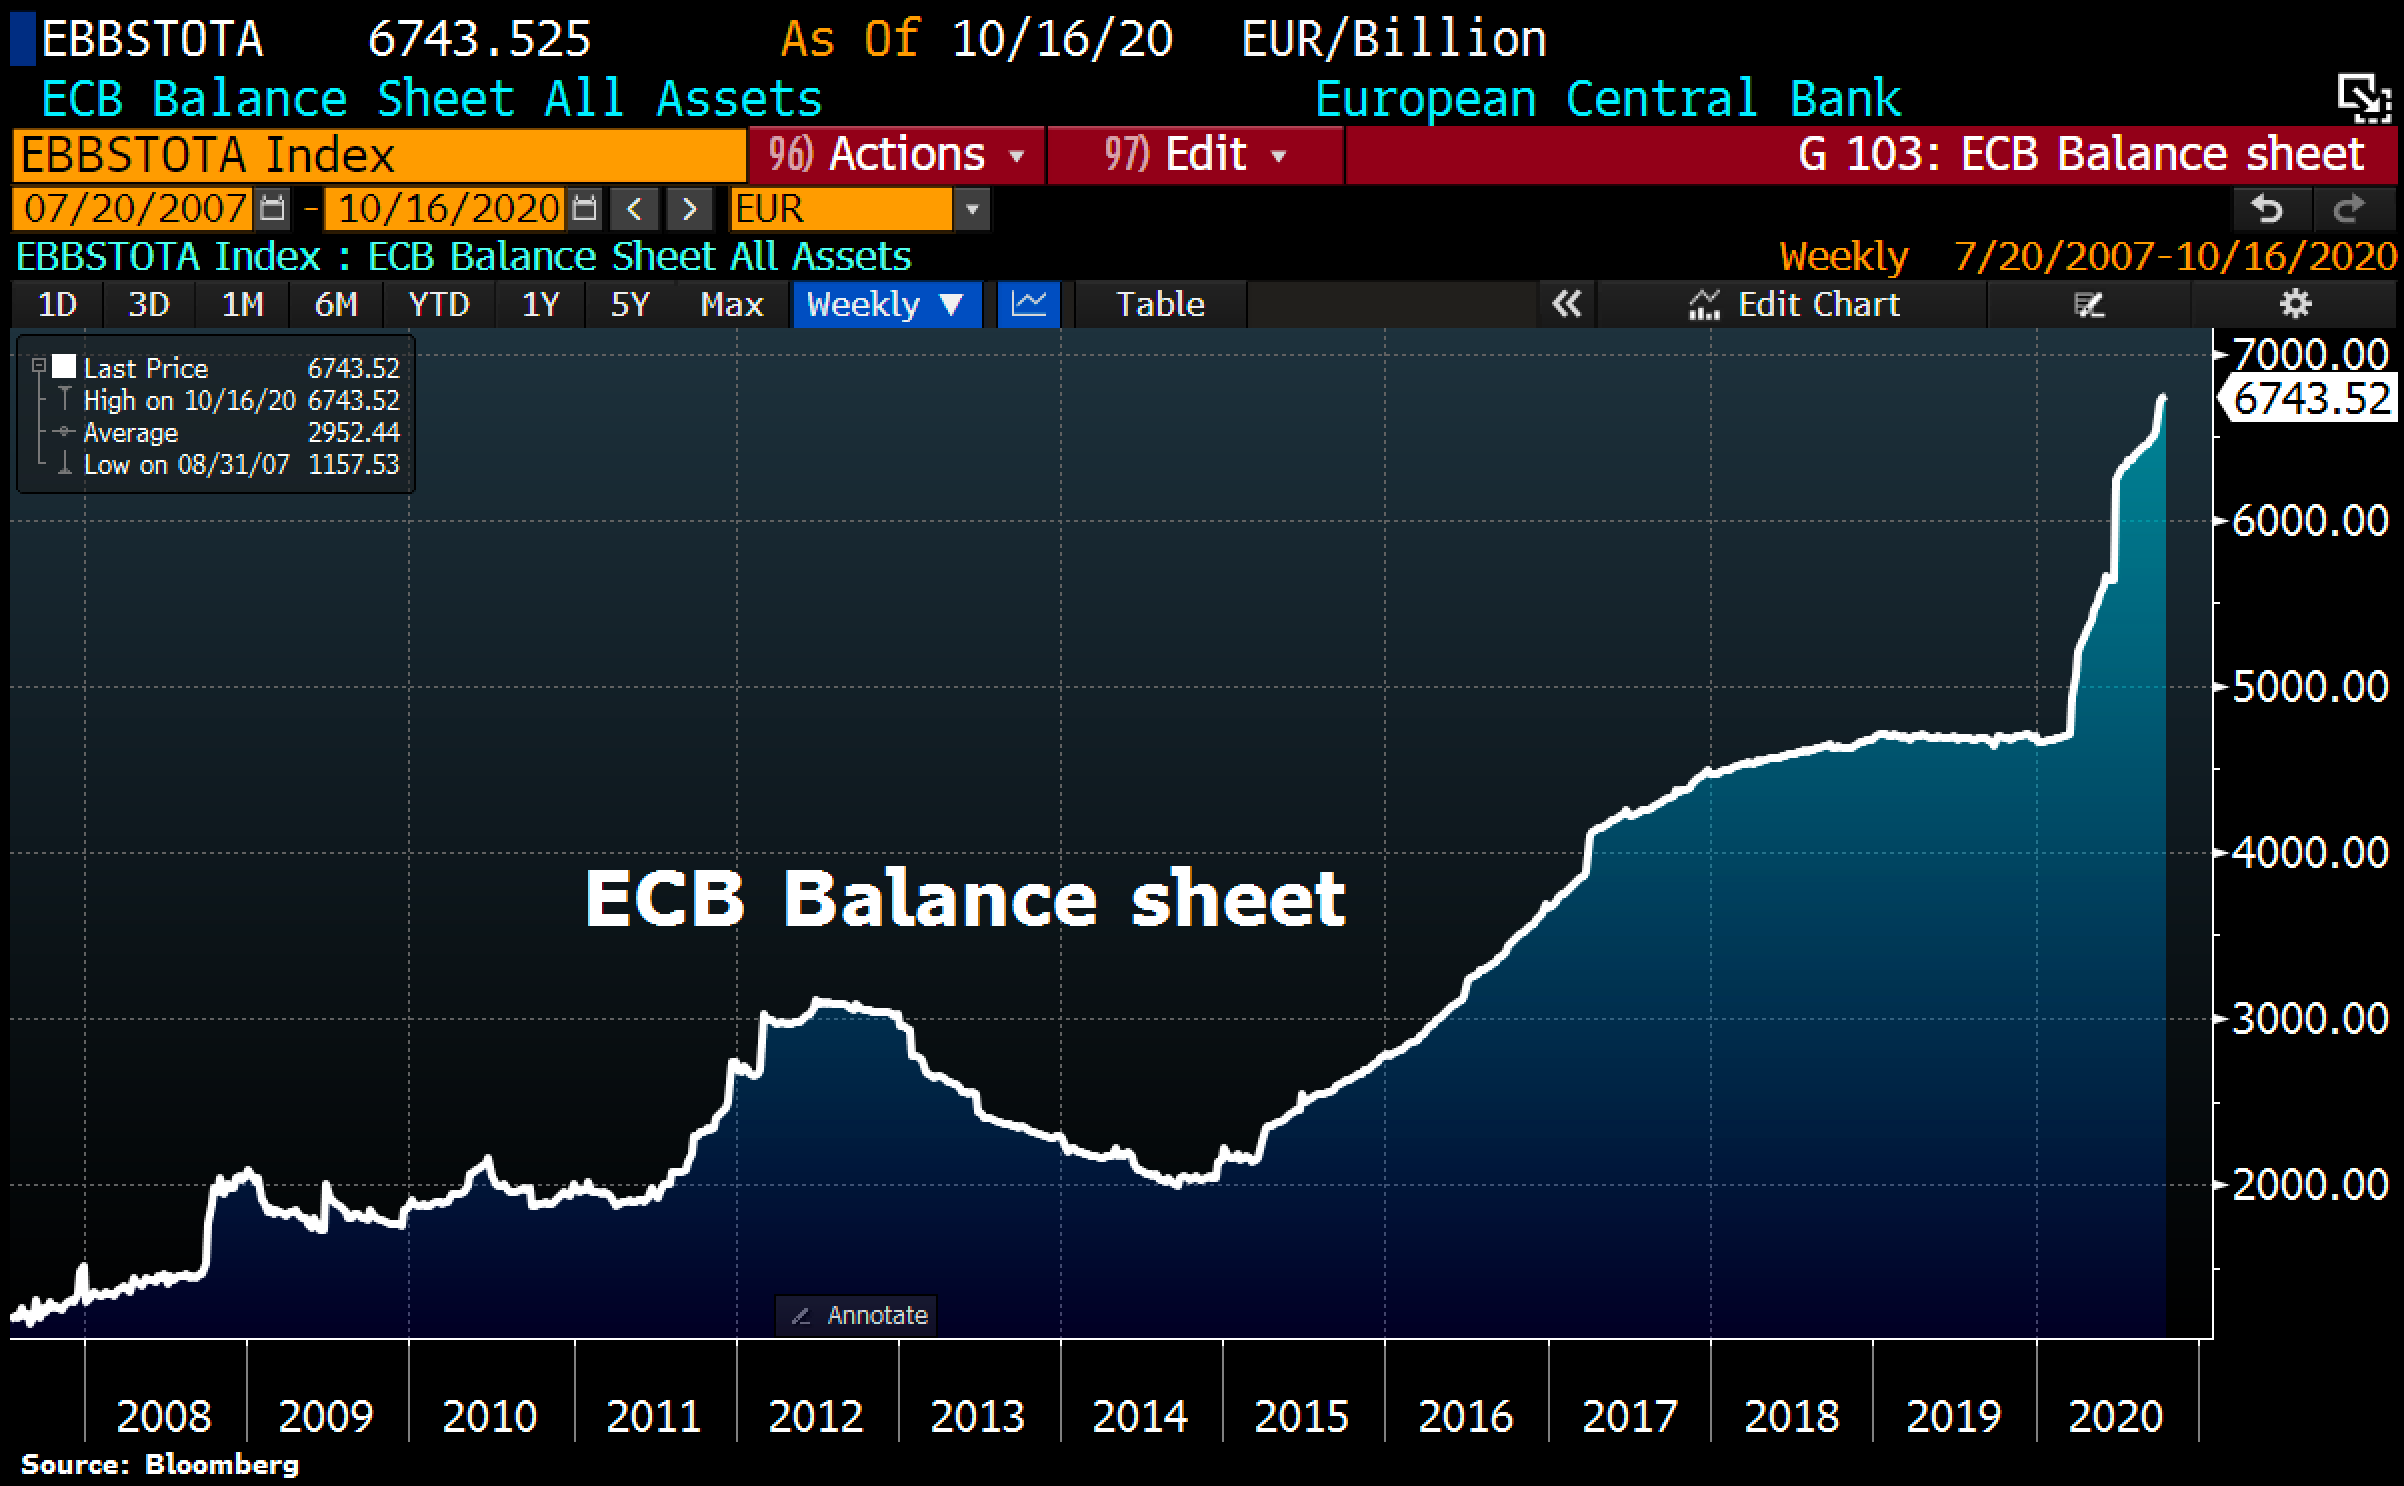
ECB Balance sheet. Source: ©Holger Zschaepitz, Schuldensuehner, 21st of October 2020
The ECB’s balance sheet reached a new all-time high at 6,743.5 billion Euro. Overall, assets increased by 17,8 billion compared to the previous week. Thus the average currency creation of about 10 to 30 billion Euro per week remains firmly in place!

US total debt. Source: ©Holger Zschaepitz, Schuldensuehner, 21st of October 2020
Looking at the exploding US debt, it also makes it clear that there can not be any reversal anymore. We all know the curve of an exponential function. For more than a year now, US debt has been rising almost vertically, as have the debts of all other countries. The next debt-financed stimulus package in the US is, of course, only a matter of time, independently who ends up as the new president. The US citizens, and ultimately the world’s population, will have to pay the bill through hidden inflation and currency devaluation.
Exponential debt growth coupled with an exponential balance sheet expansion by central banks leads to exponential wealth inequality and is also likely to cause an exponential increase in bitcoin. Those who still rely on fiat money for wealth preservation of value and retirement are living in a utopia.

Used car prices. Source: ©Tavi Costa @Crescant Capital, 18th of October 2020.
The rising inflation can also be seen in the prices for used cars. Consumers have been pushing into the used car market since last spring, bidding prices to unprecedented levels. Of course, this is most often created by supply problem.
Ultimately, however, it is only important that these rising prices bring about a change in perception. As a result, used car buyers prefer to buy now rather than later. Behind this is the legitimate fear that prices may have become even more expensive in a few months. At the same time, demand for new cars and hence demand for leasing and financing products have collapsed to a nine-year low, which in turn is likely to have a very unfavorable impact on the real economy. Rising prices for agricultural products and raw materials like copper speak a similar language.
All in all, this confirms once again the thesis of the crack-up boom, because the global recession in the real economy goes along with a continuous credit expansion and leads slowly but surely to ever faster price increases. In the face of excessive credit expansion, consumer inflation expectations will accelerate to the point where currencies eventually become worthless and the economic system collapses.
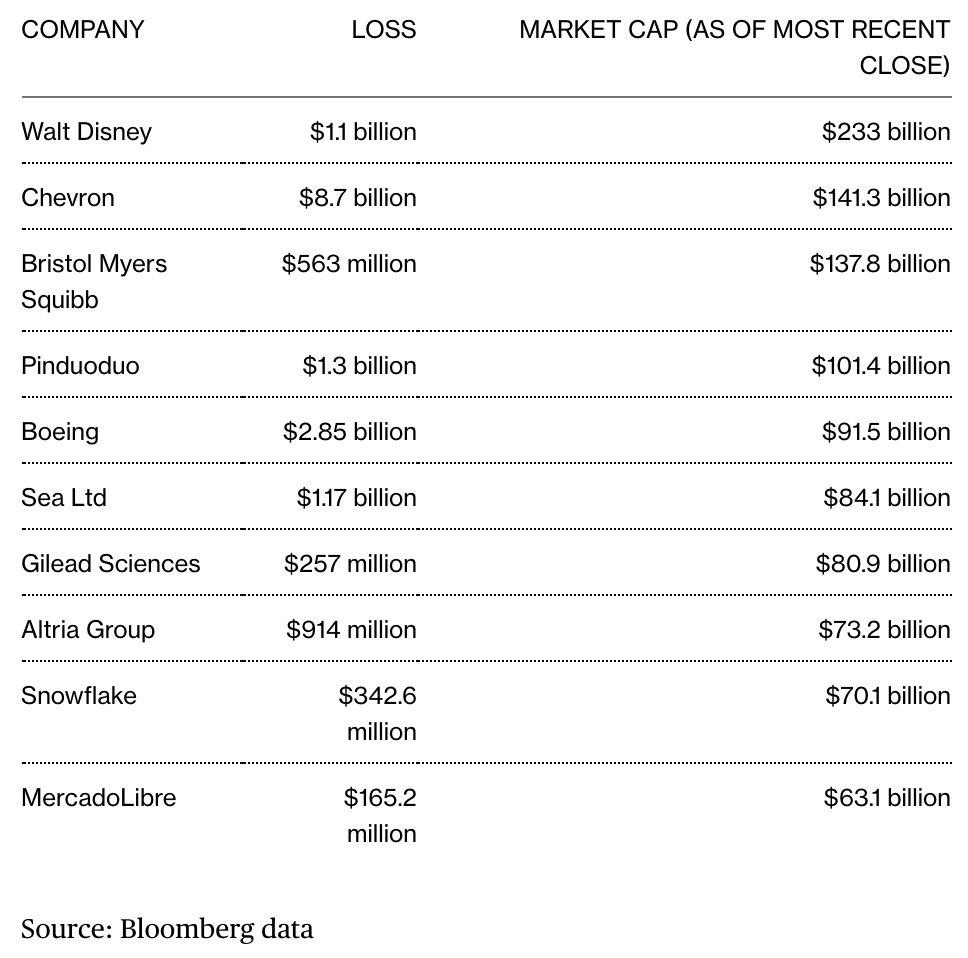
Record Number of U.S. Corporate Giants Lost Money in Covid Pandemic. Source: Bloomberg as of October 14th, 2020.
Unsurprisingly, many large U.S. listed public companies are trading unprofitably. For example, 43 out of 345 companies with a market capitalization of more than US$25 billion have recorded cumulative losses in the last 12 months. This represents a tripling compared to the beginning of the year.

Expected corporate insolvencies in Germany. Source: Deutsche Bundesbank as of October 14th, 2020.
The German Bundesbank even expects an increase in insolvencies of more than 35% after the suspension of the obligation to file for insolvency expires by end-2020. According to this, the number of corporate insolvencies is expected to jump from 4,700 in the first quarter of 2020 to a peak of 6,250 in the first quarter of 2021!
Conclusion Bitcoin – Strong Performance
In other words, we can expect the following:
- Unlimited monetary stimulus
- Further fiscal stimulus
- Record fiscal deficits
- Runaway national debt levels
- Negative real rates for several years
- Dollar debasement and loss of purchasing power
- Higher inflation
- Currency wars
- Geopolitical conflicts
- Lack of Fed options
- Ongoing uncertainty surrounding Covid-19
All of these are still in play and all are fundamentally positive and very bullish for gold, silver and especially bitcoin. Bitcoin is on the way of becoming a lifeboat in this hopeless mess. Already, this year’s performance is more than solid. Compared to gold, bitcoin currently appears undervalued despite the rally over the last few days, since it is still trading well below its all-time high at US$20,000. Currently, bitcoin would need to rise by at least 54% to match the success of gold (new all-time high this summer).
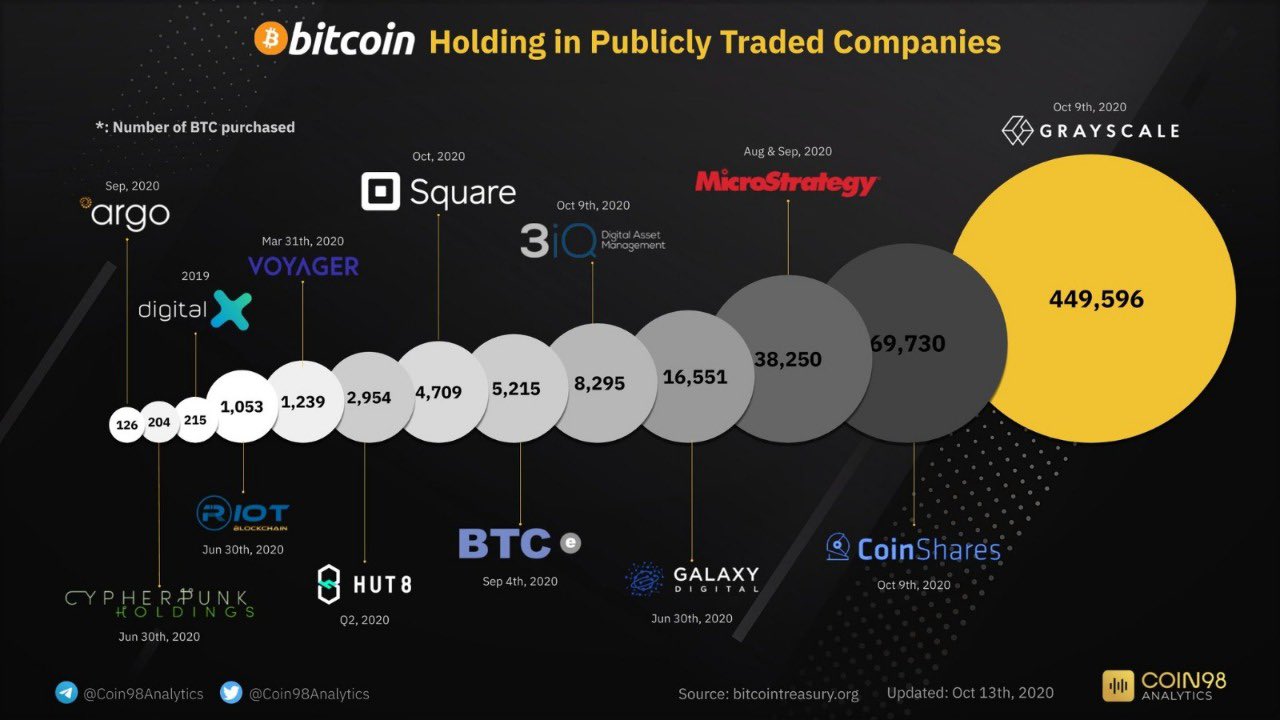
In particular, the increasing number of large listed companies that have now made significant investments in Bitcoin supports the growing demand. As a result, Bitcoin is gaining more and more acceptance.
Technically speaking, bitcoin has entered the strong resistance zone between US$13,000 and US$14,000. In the short term, the rally is intact, so further increases are realistic. Depending on how the weeks before and after the US election turn out in the financial markets, there could be another pullback and hence a good buying opportunity.
Long-term bullish, but short-term overbought
The long-term outlook for Bitcoin is extremely positive and very bullish. Significant price increases against all fiat currencies are only a matter of time. In the medium term, however, the all-time high at US$20,000 must first be overcome. Until then, the bitcoin bulls still have a lot of work to do.
In the short term, a week and a half before the US election, much is conceivable and possible. If financial markets come under more significant pressure in the context of the elections, bitcoin will also pull back below US$12.000. The overbought situation still allows for an increase towards US$14,000, but the risk of a pullback due to the overbought setup and a wave of profit taking increases daily. Purchases are not recommended at the moment. However, profit taking is also not a good idea, because the chance that bitcoin will now continue to push directly up to US$20,000 cannot be dismissed. Hence, let your winnings run and add in case of a more significant pullback towards and below US$12,000.
Analysis sponsored and initially published on October 23rd, 2020, by www.celticgold.eu.
We post real time entries and exits for Bitcoin and crypto-assets in our free Telegram channel.
If you like to get regular updates on our gold model, precious metals and cryptocurrencies you can subscribe to our free newsletter.

