


Bitcoin – Recovery Until Early Summer
Bitcoin is entering a critical phase after months of heavy correction and renewed geopolitical shocks. Despite persistent weakness, oversold conditions, extreme pessimism, and supportive seasonality suggest that a recovery attempt should be near. Bitcoin – Recovery Until Early Summer.
1. Review
Since the panic low on February 6, 2026, at USD 59,930, Bitcoin has been attempting to stabilize for almost two months. So far, this has resulted only in a brief recovery to USD 76,013, which quickly collapsed again amid an extremely challenging geopolitical environment. Overall, Bitcoin continues to move sideways, primarily between USD 65,000 and USD 70,000. Despite the geopolitical turmoil and steep declines in both stock and precious metals markets, price fluctuations in the crypto sector have remained surprisingly moderate.
The sector has now been in a bear market—often referred to as a “crypto winter”—for six months. Consequently, the already minimal risk appetite has barely been affected by external shocks. Nevertheless, Bitcoin remains a risk asset strongly correlated with major U.S. stock indices.
2. Technical Analysis for Bitcoin in US-Dollar
2.1 Weekly Chart – Correction Not Yet Complete
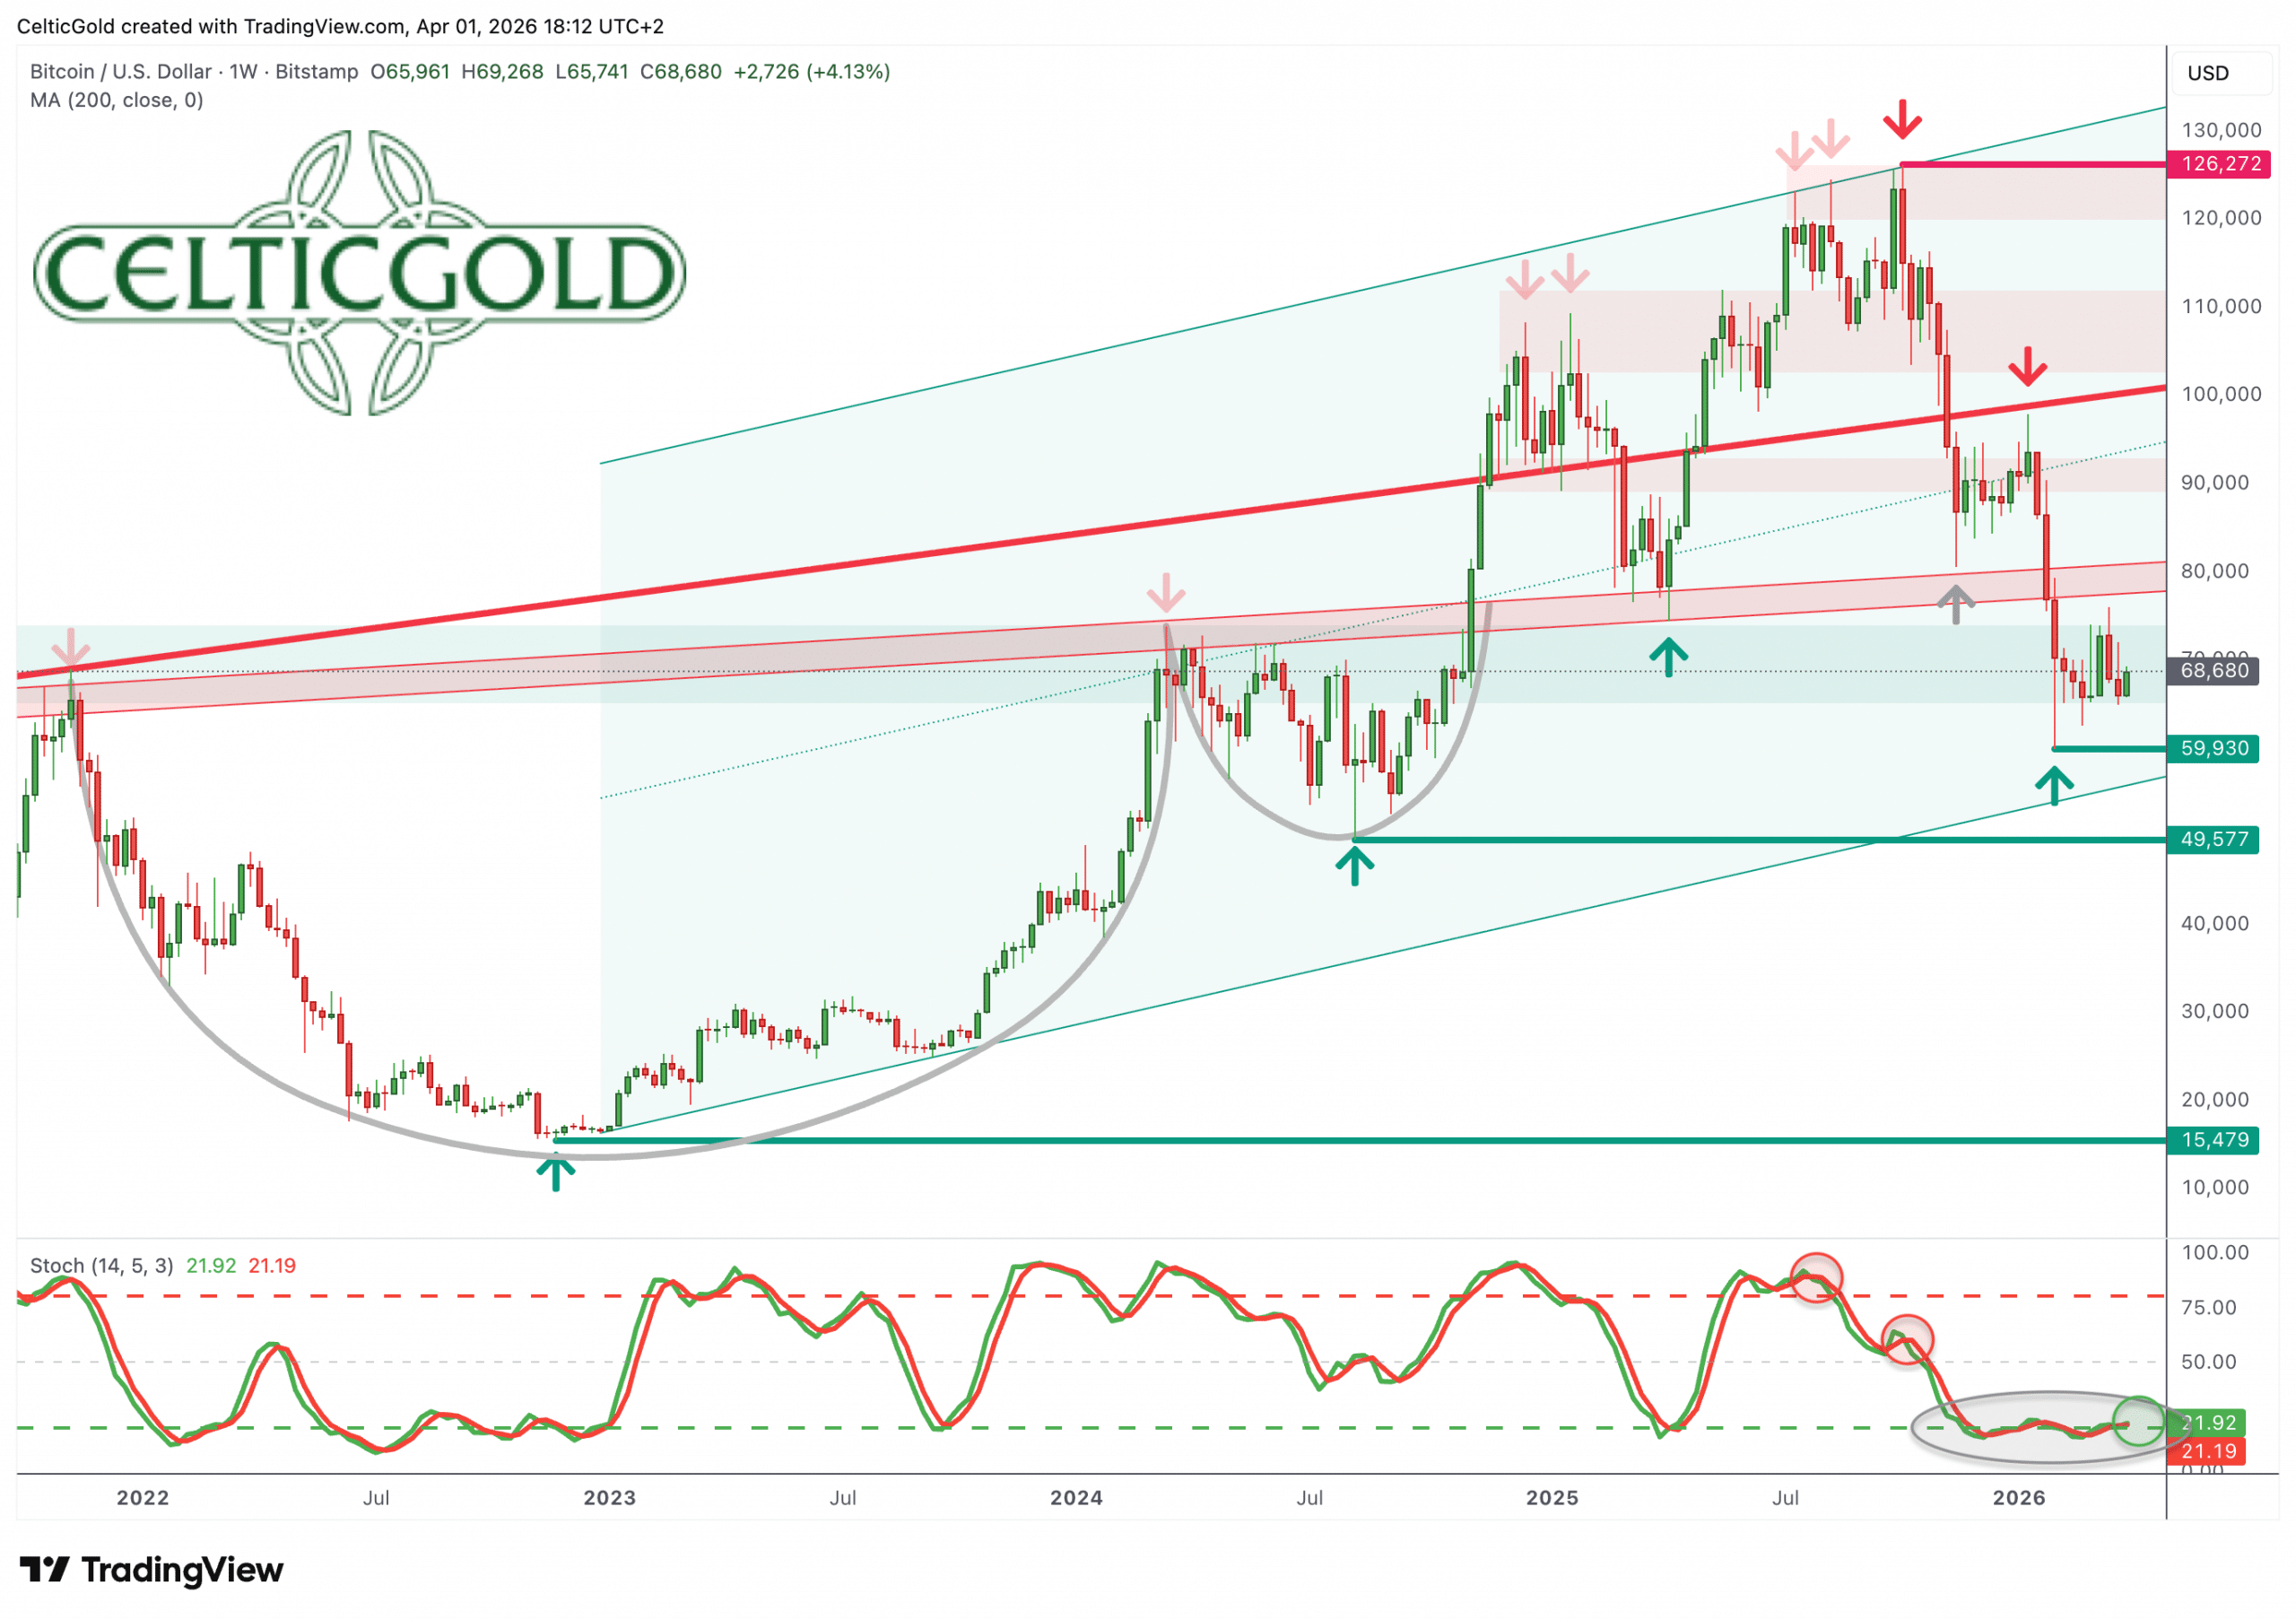
Bitcoin in USD, weekly chart as of April 1st, 2026. Source: Tradingview
From its all-time high of USD 126,272 on October 6, 2025, to the correction low on February 6, 2026, Bitcoin lost approximately 52.5% of its value in just four months. In comparison, previous bear markets showed far deeper declines: around 93% in 2011, 84% in 2018, and 77% in 2022. These periods also lasted at least twelve months, making the current correction appear relatively mild and brief.
If the current crypto winter follows historical patterns, a further downward wave and an extended bottoming phase are likely. For example, in 2022 a mid-June low at USD 17,593preceded the final bottom at USD 15,479 five months later. Accordingly, this correction may continue somewhat longer, even though the steepest drop is probably behind us. The final low is expected to form between USD 50,000 and USD 60,000.
Technically, Bitcoin would then remain within the long-term upward trend channel established since late 2022—a constructive signal overall. The weekly stochastic oscillator is deeply oversold, while the momentum indicator still lacks confirmation of a sustained recovery. The wave structure and two-month sideways movement suggest one more downward swing before a potential rebound. Any recovery attempts, however, have thus far faded quickly.
In summary, the weekly chart remains bearish to neutral. A stronger recovery cannot be ruled out, with short-term potential up to approximately USD 80,000–USD 85,000. Nonetheless, we maintain that Bitcoin has likely not yet reached its final low, expected between USD 50,000 and USD 60,000, likely in late summer or early autumn.
2.2 Daily Chart – Bitcoin Poised for Its Next Recovery Attempt
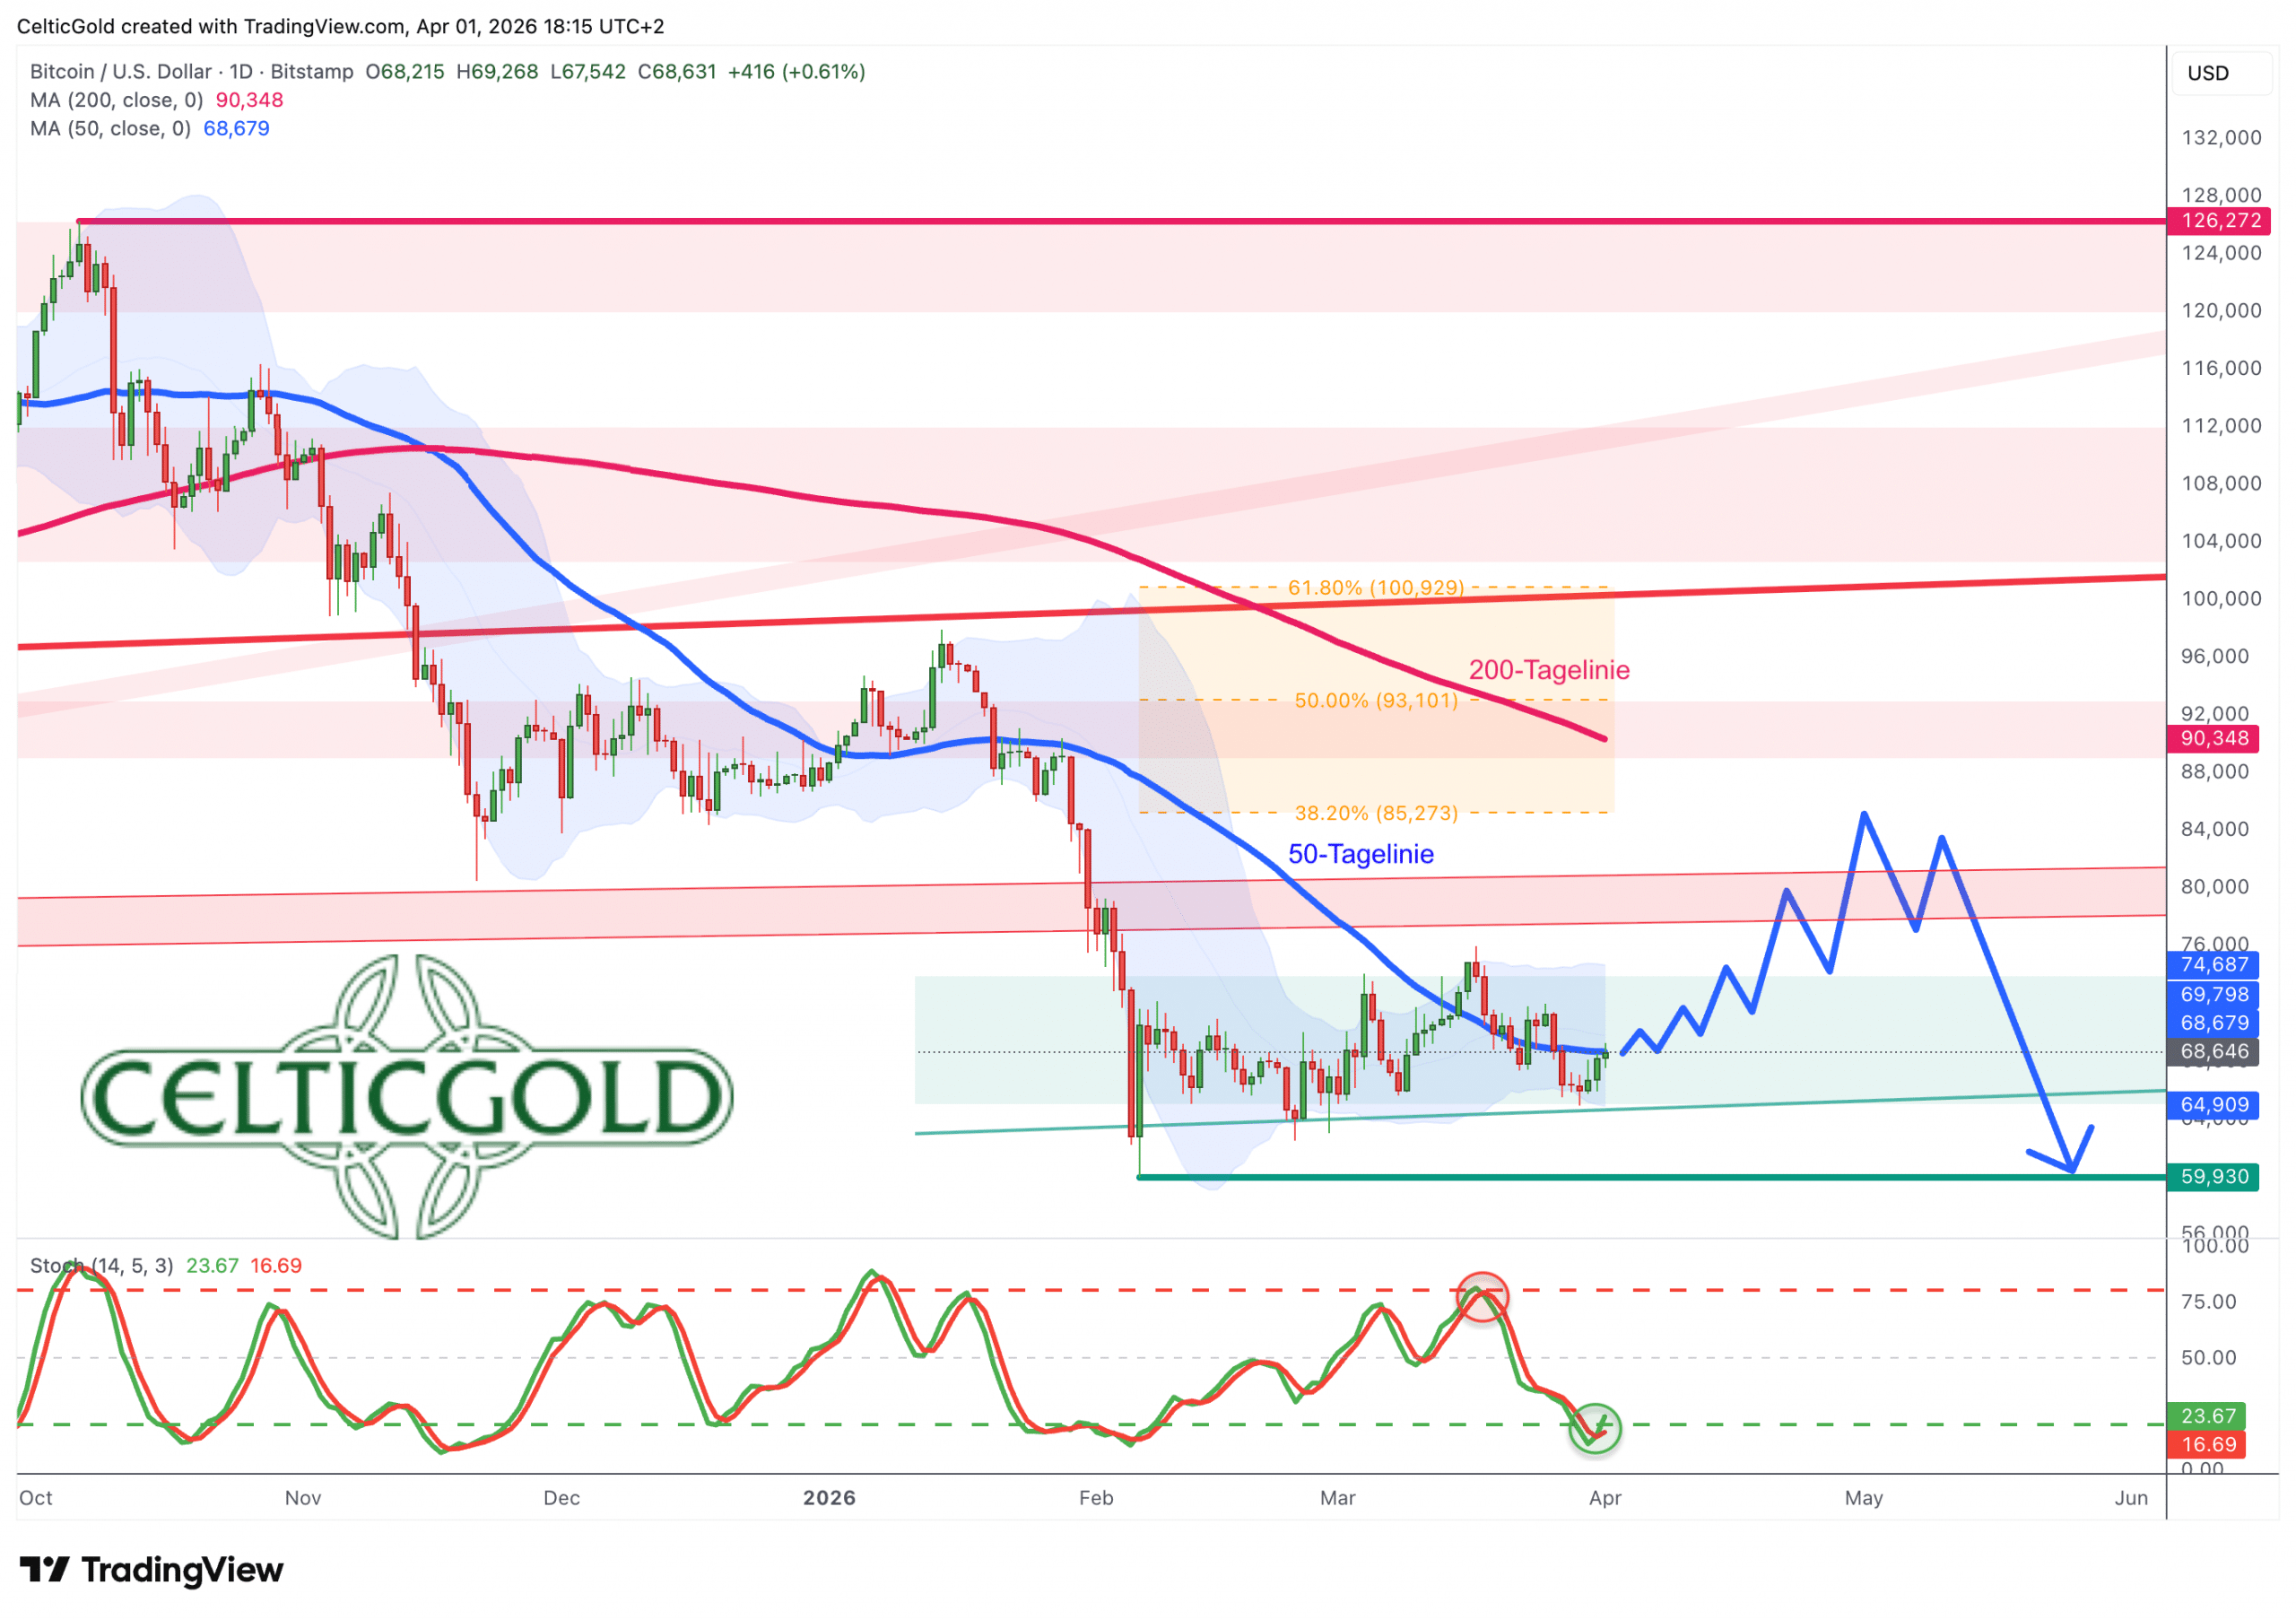
Bitcoin in USD, daily chart as of April 1st, 2026. Source: Tradingview
Over the past two months, Bitcoin has been moving sideways without much momentum. The recent drop from USD 76,013 to USD 64,955 pushed the stochastic oscillator into oversold territory, opening the door for a technical rebound. At present, buyers are attempting to reclaim the 50-day moving average (USD 68,678), followed by resistance at the upper Bollinger Band (USD 74,687). Should Bitcoin overcome these levels, a recovery toward the declining 200-day moving average (USD 90,348) would be possible—and typical from a technical standpoint.
Overall, the daily chart favors a new recovery attempt. While significant resistance levels remain overhead, a rebound after months of weakness appears overdue. On the downside, it is crucial to maintain the support zone between USD 60,000 and USD 66,000; a breakdown below this range would likely trigger further declines.
3. Market Sentiment – Signs of Capitulation
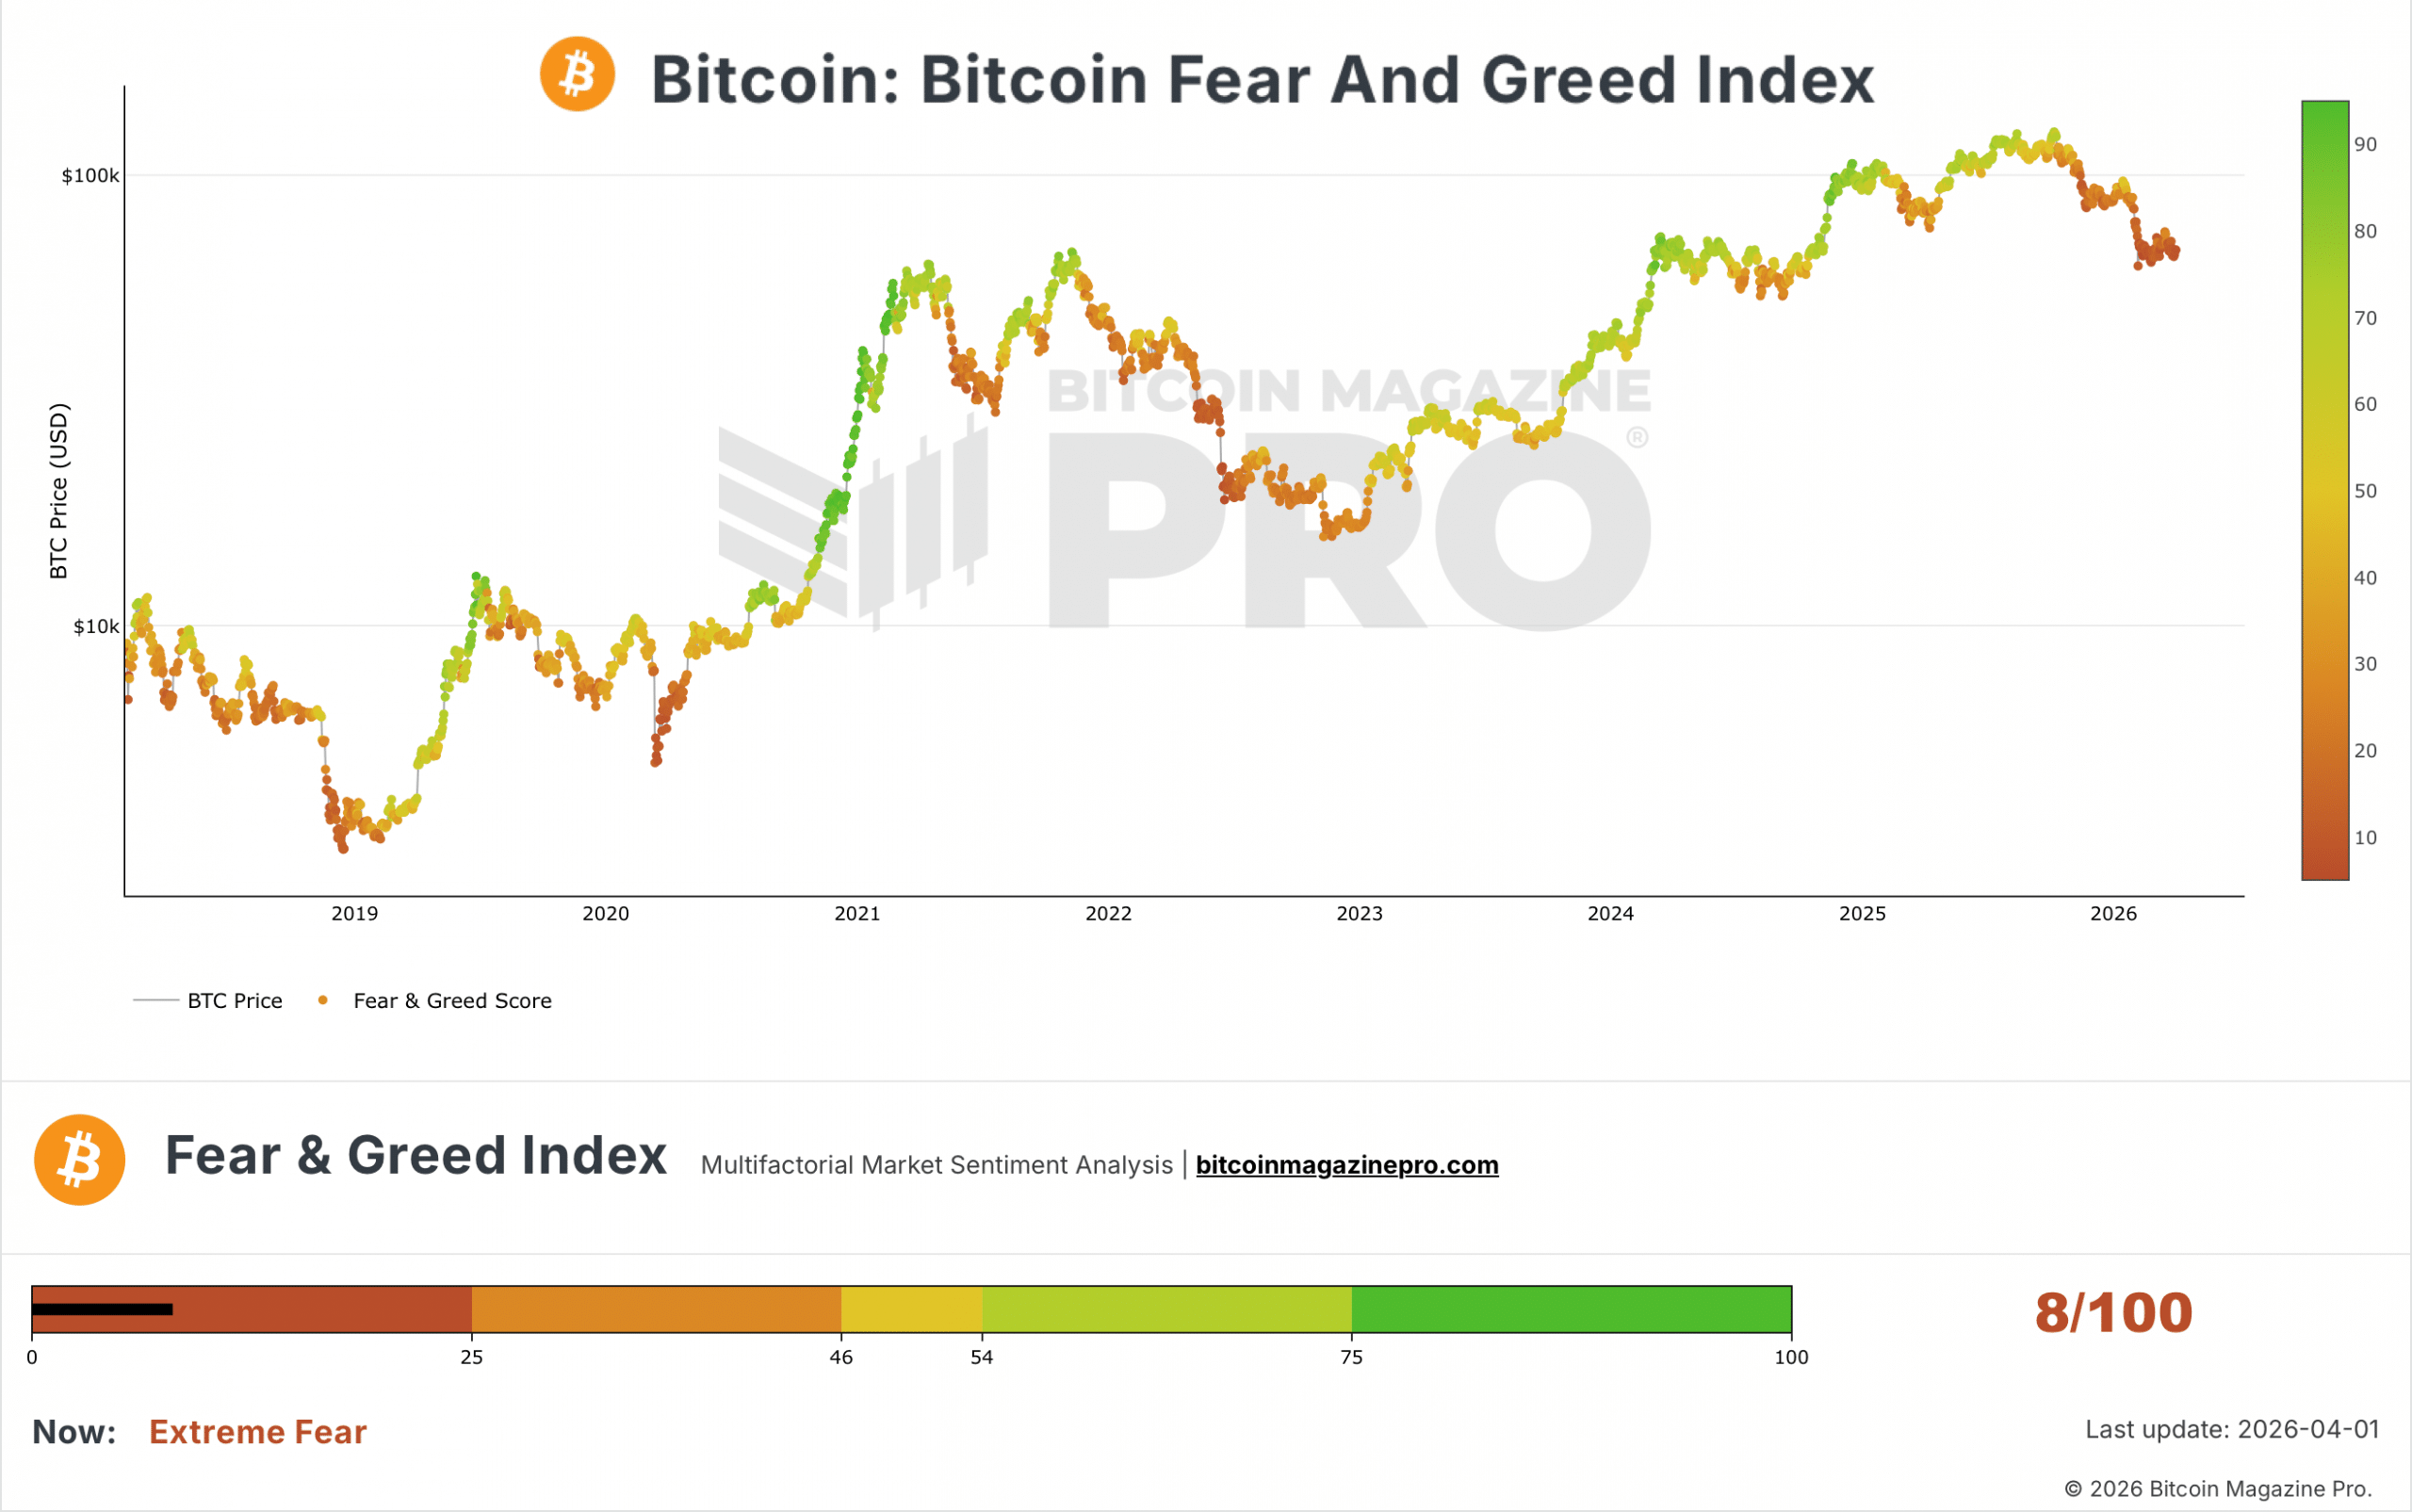
Crypto Fear & Greed Index, as of April 1st, 2026. Source: Bitcoin Magazine Pro.
The Crypto Fear & Greed Index currently sits at only 8 / 100, reflecting deep pessimism across the market. For contrarian investors, such extreme fear readings often signal the potential for a rebound. Although further weakness cannot be ruled out, the probability of a technical recovery is increasing—precisely because confidence is so low.
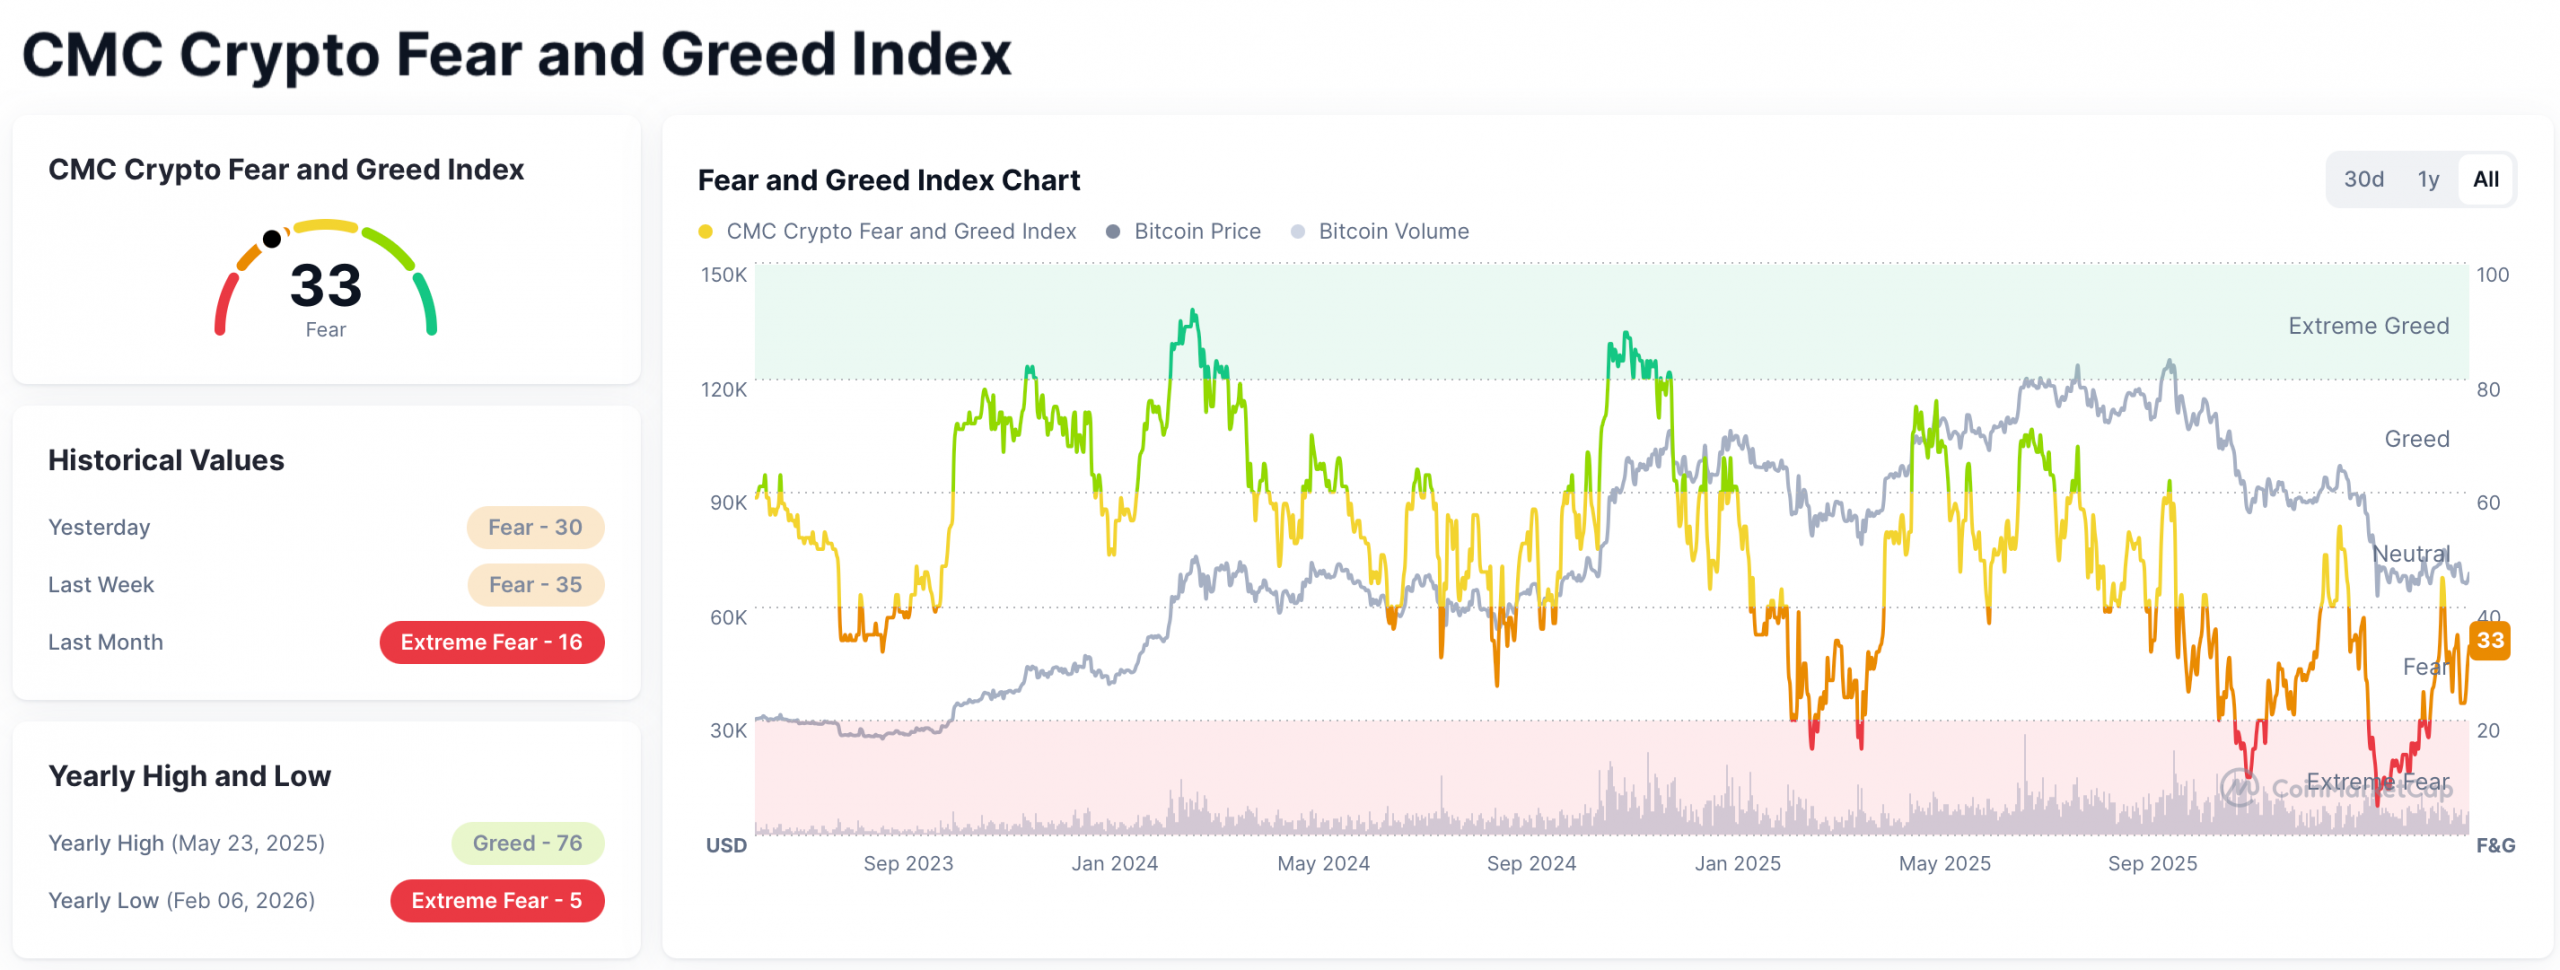
CMC Crypto Fear & Greed Index, as of April 1st, 2026. Source: Coinmarketcap
Meanwhile, CoinMarketCap’s broader CMC Crypto Fear & Greed Index stands at 33 / 100, confirming widespread caution but not yet showing an extreme value. Combined indicators—volatility, momentum, social media sentiment, survey data, and BTC trend activity—suggest continued consolidation rather than panic.
Overall, sentiment points toward an impending recovery phase.
4. Seasonality – Recovery Expected Through Early Summer
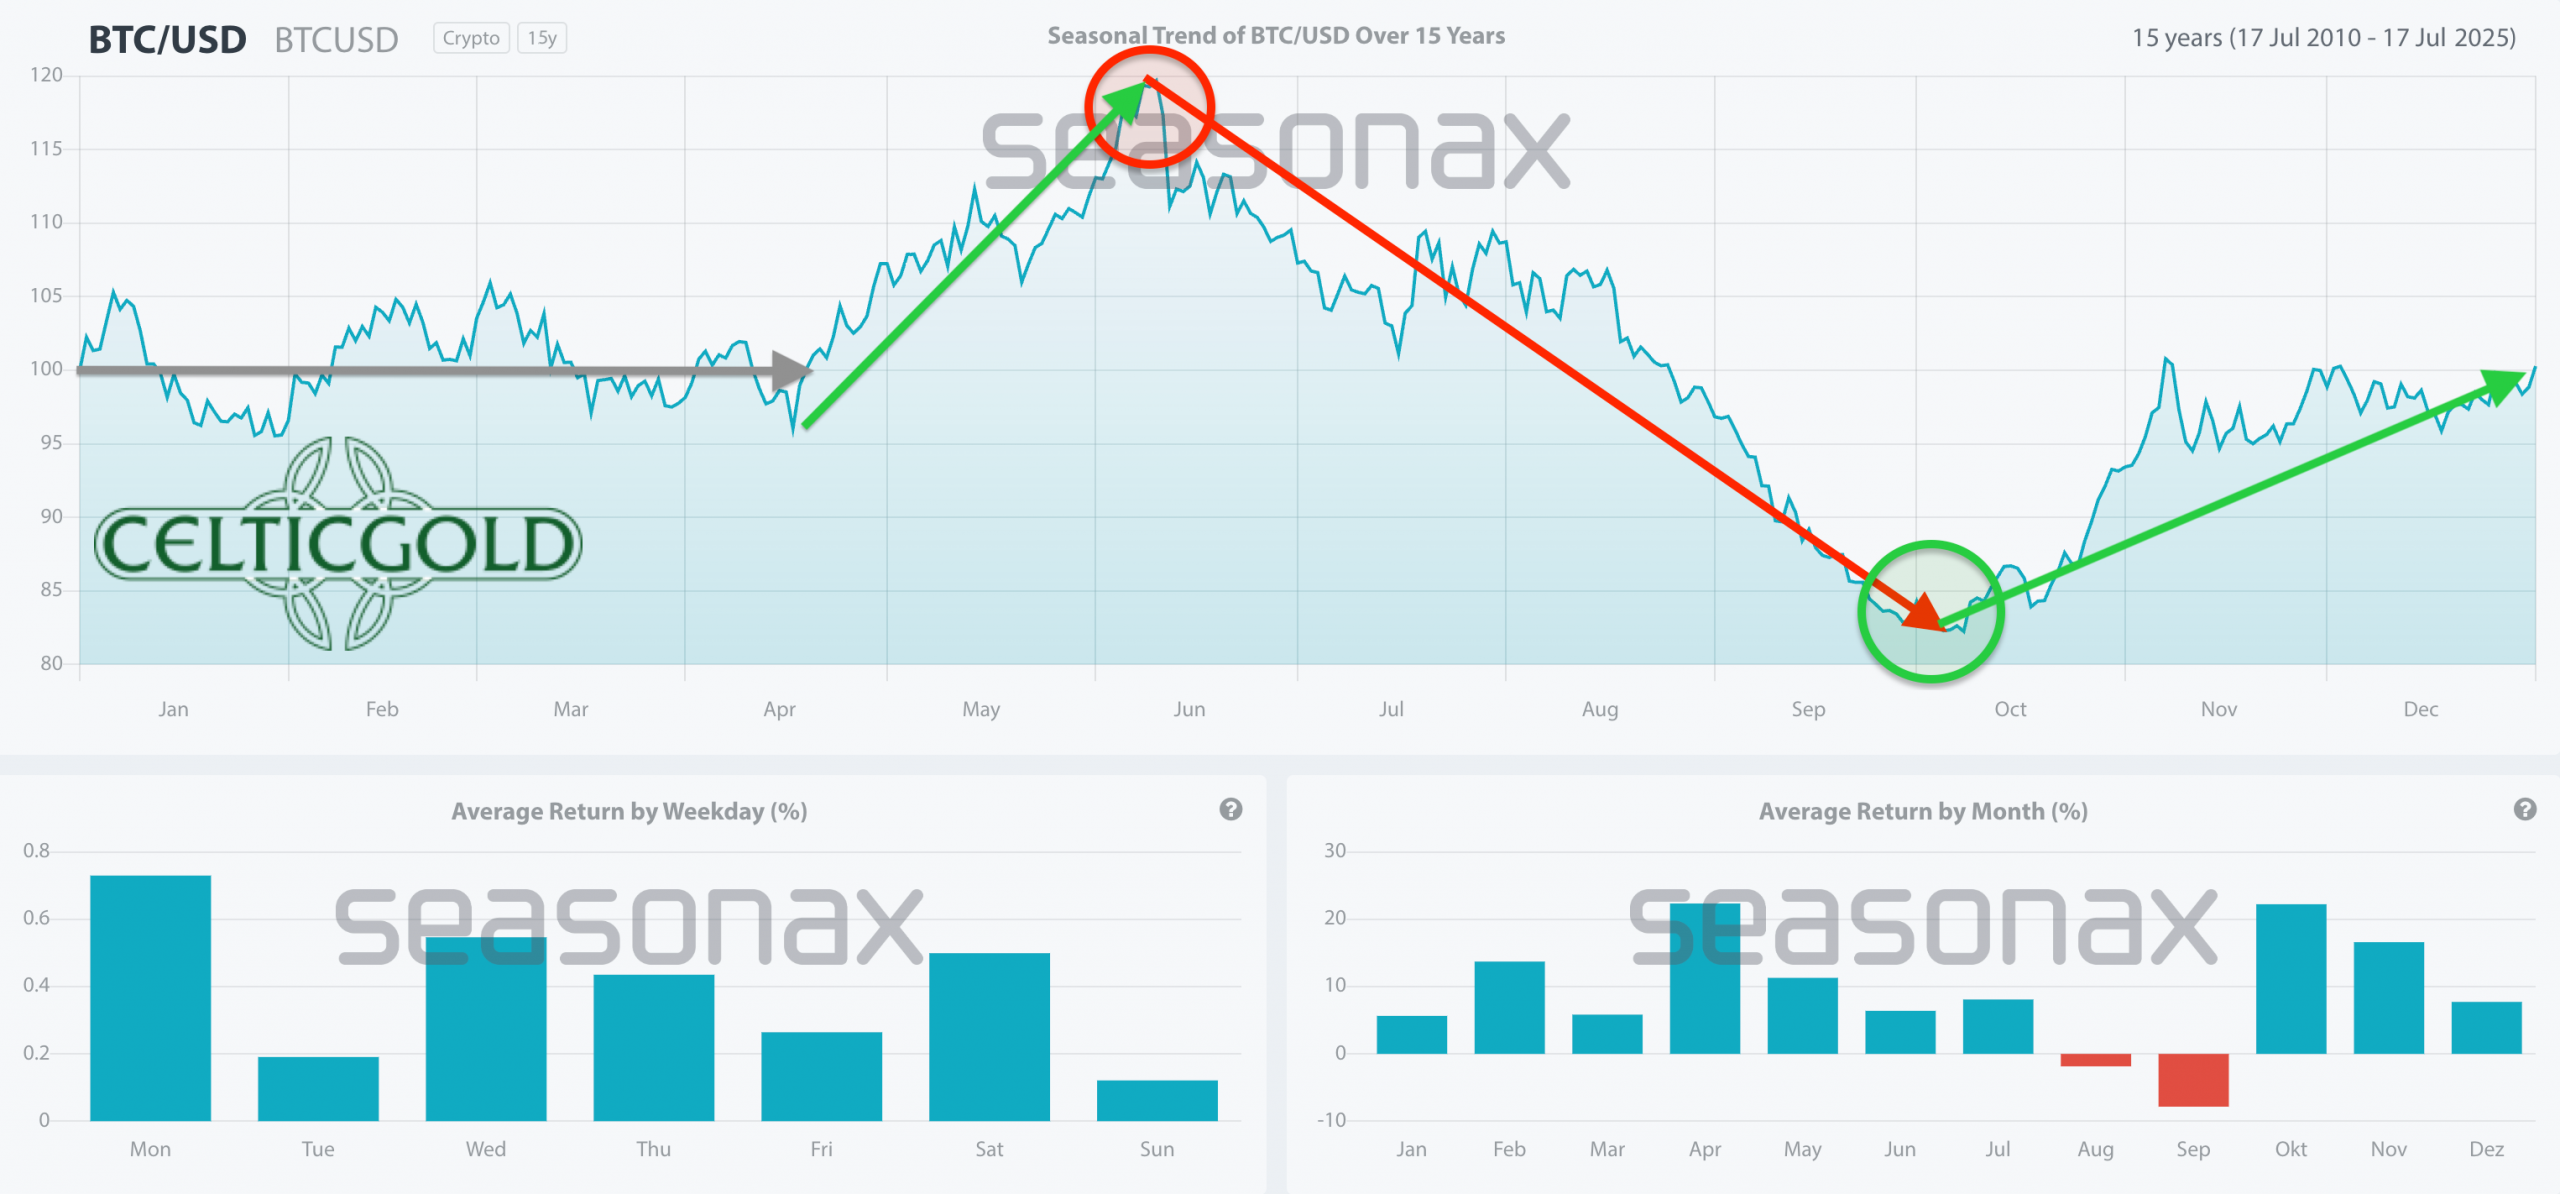 Bitcoin Seasonality as of April 1st, 2026. Source: Seasonax
Historically, Bitcoin’s seasonal pattern has been neutral from February to early April. However, longstanding seasonal trends—observed over the past 15 years—turn bullish from mid-April through June. Thus, if Bitcoin follows its typical pattern, a recovery phase should emerge in the next few months.
Seasonality thereby offers additional support to the ongoing recovery thesis.
5. Bitcoin vs. Gold (Bitcoin/Gold Ratio)
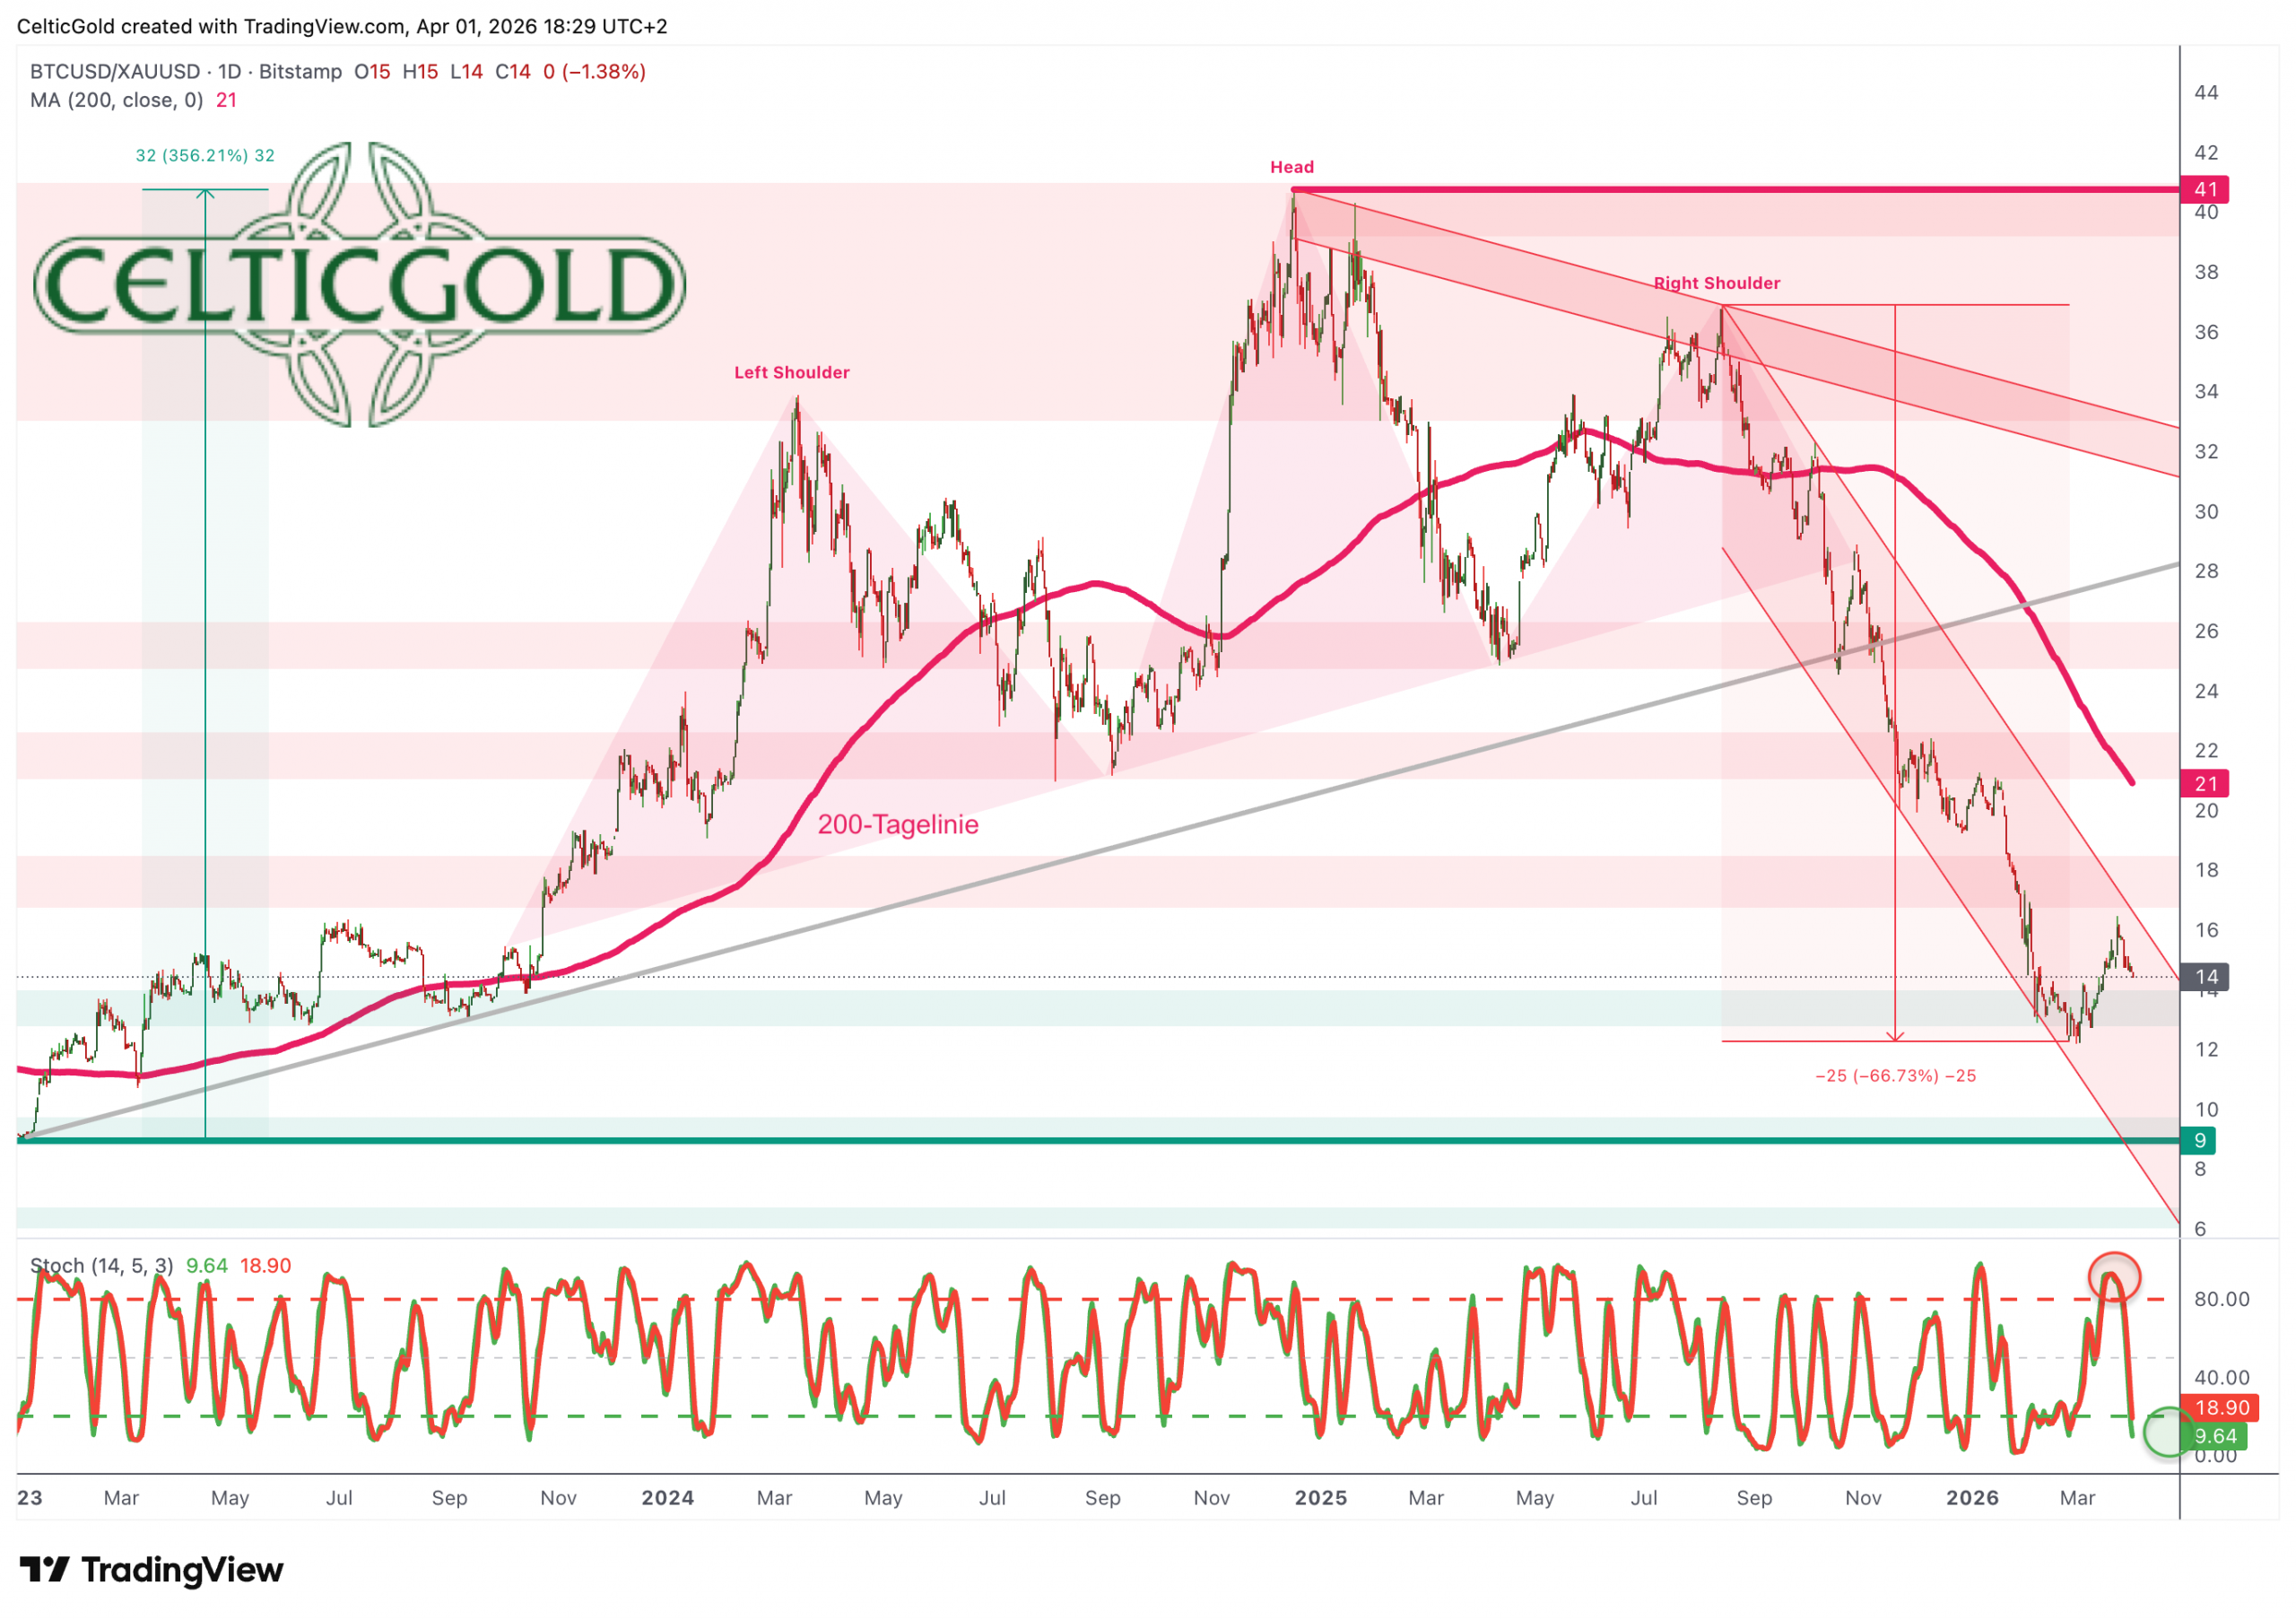
Bitcoin/Gold-ratio, daily chart as of April 1st, 2026. Source: Tradingview
With Bitcoin trading around USD 68,300 and gold near USD 4,720 per troy ounce, one Bitcoin currently equals roughly 14.5 ounces of gold, or inversely, 0.069 BTC per ounce of gold. In March, Bitcoin recovered modestly against gold after the ratio fell sharply from 37 to 12—largely due to gold weakness rather than crypto strength.
As long as the crypto winter persists and the gold bull market continues, the Bitcoin-to-gold ratio is likely to trend lower. A medium-term target near 10 appears reasonable, with possible interim rebounds up to around 18. In short, the ratio currently suggests a potential technical countermovement in Bitcoin’s favor.
6. Geopolitical Backdrop – Oil War, Quantum Threat, and Monetary Turning Point
The U.S. president is contradicting himself. Source: Daractenus
For over four weeks, the ongoing Iran conflict has rocked global markets. The blockade of the Strait of Hormuz has triggered an inflationary shock, causing sharp declines in equities and gold—down 14% and 24% respectively—while oil prices surged. Bitcoin initially benefited as expatriates used it for capital transfers from Dubai, but soon fell back to roughly USD 65,500.
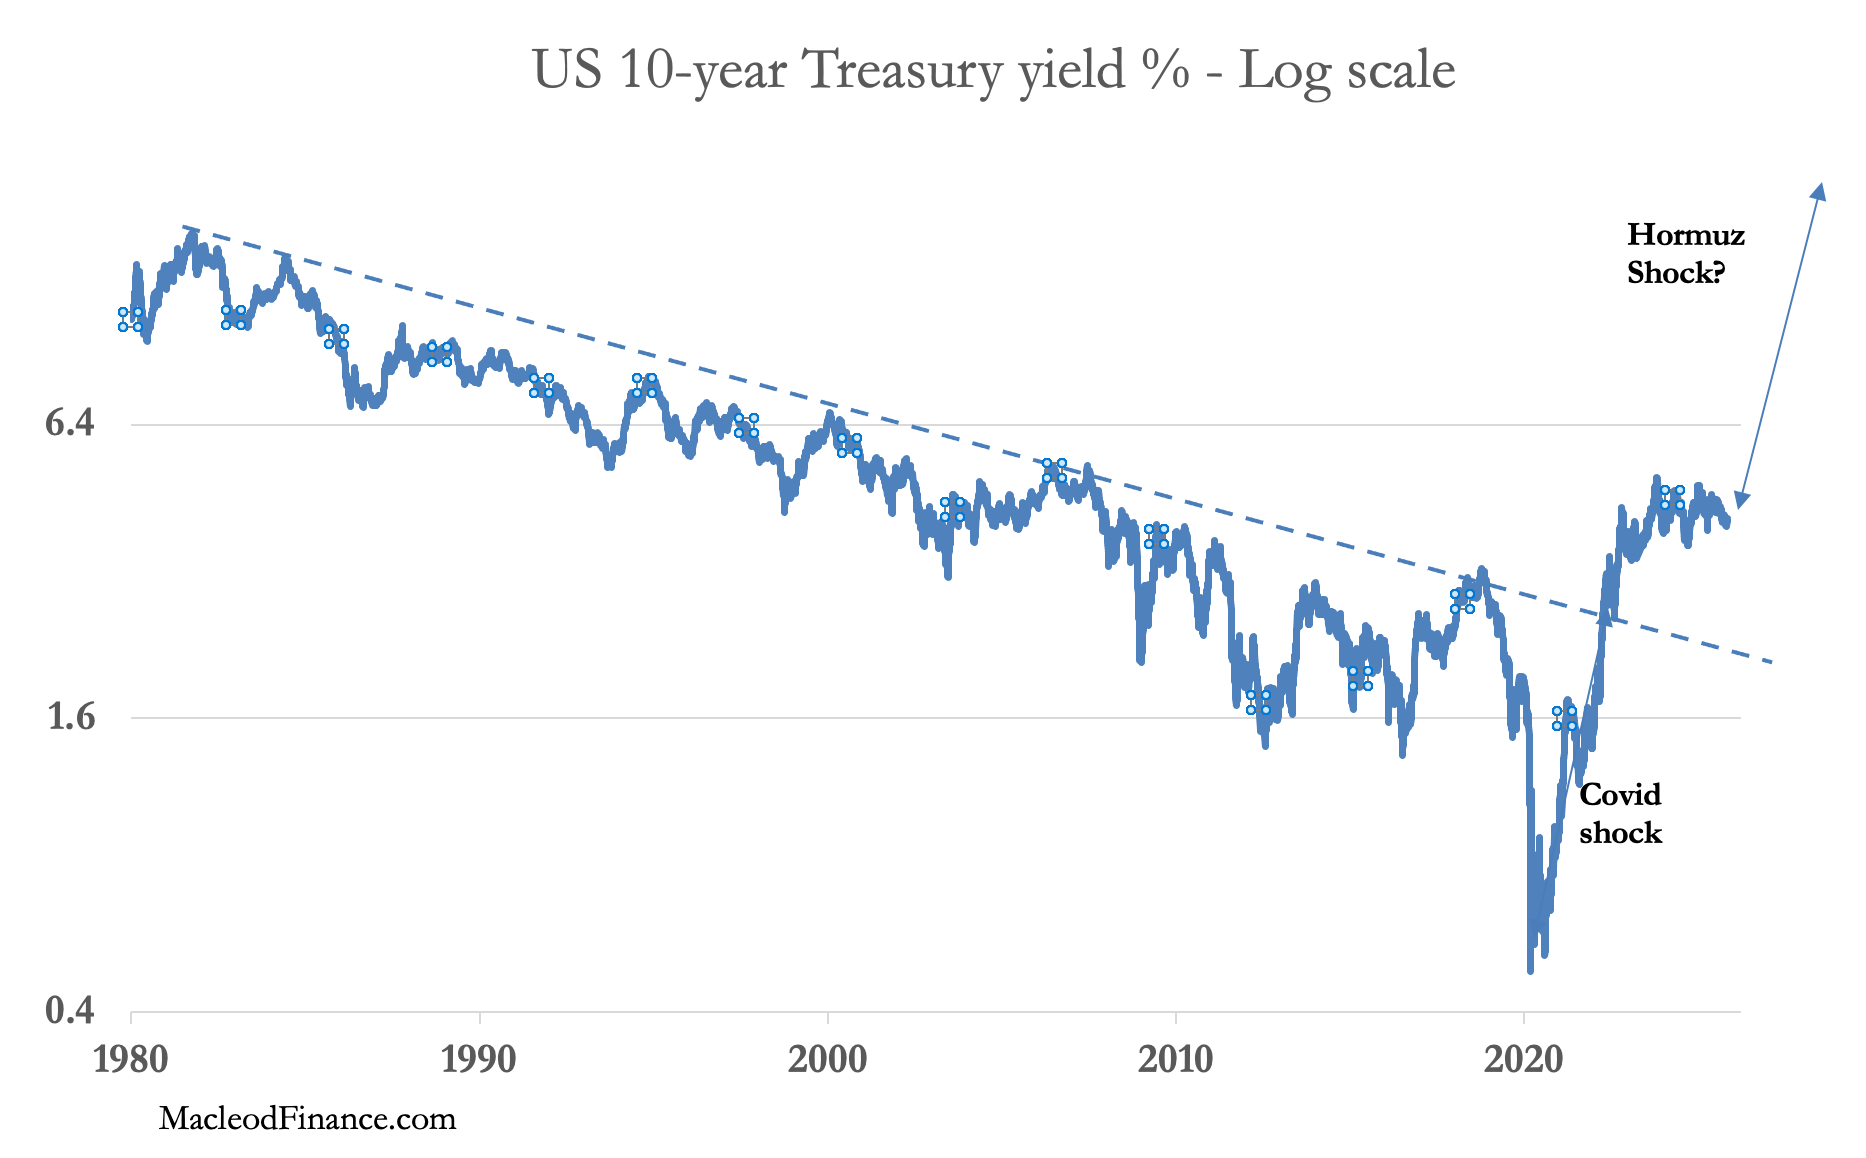
U.S. Treasury yields, as of March 30, 2026. Source: Alasdair Macleod
At the same time, G7 bond yields have soared, with the 10-year U.S. Treasury reaching 4.32%. Rising debt and interest costs highlight the risk of a global “debt avalanche” and persistent real-rate shock—clear signs of tectonic shifts in the global economy. While U.S. officials project stability, escalating geopolitical tensions now threaten both the petrodollar system and global trade.
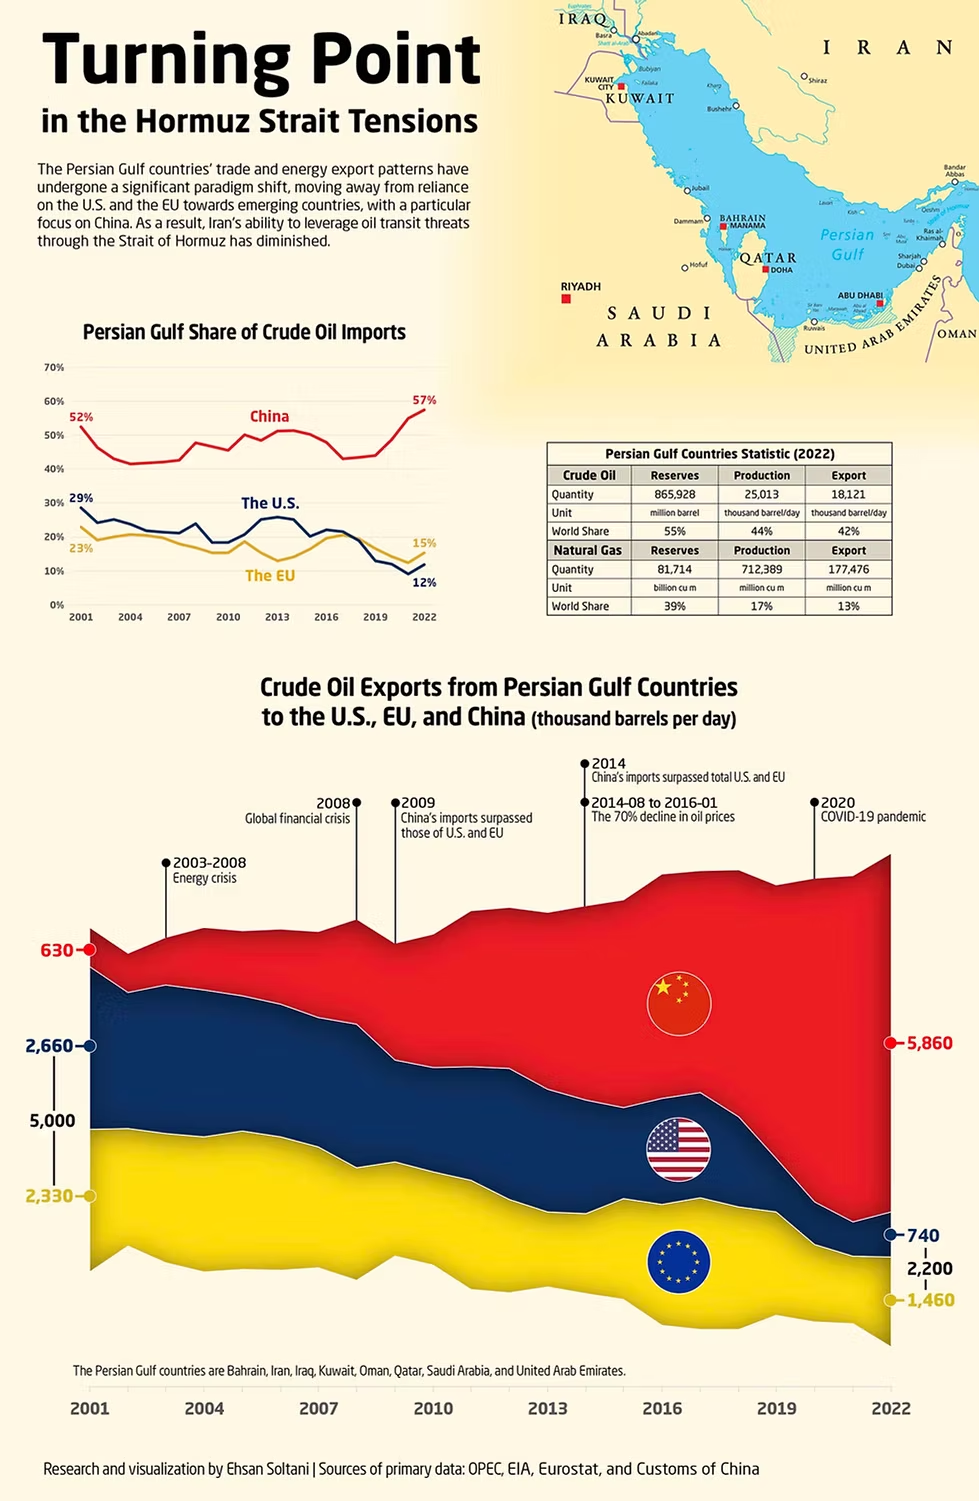
The Strait of Hormuz. Source: Ehsan Soltani
The Strait of Hormuz, through which about 20 million barrels of oil pass daily, has become a strategic flashpoint—especially for China, which now imports more than 30% of Gulf oil exports. Disruptions could spark a worldwide energy crisis, hitting Asia the hardest. Amid inflation and energy shortages, fiat currencies increasingly appear as “political promises”—viable only until belief fades.
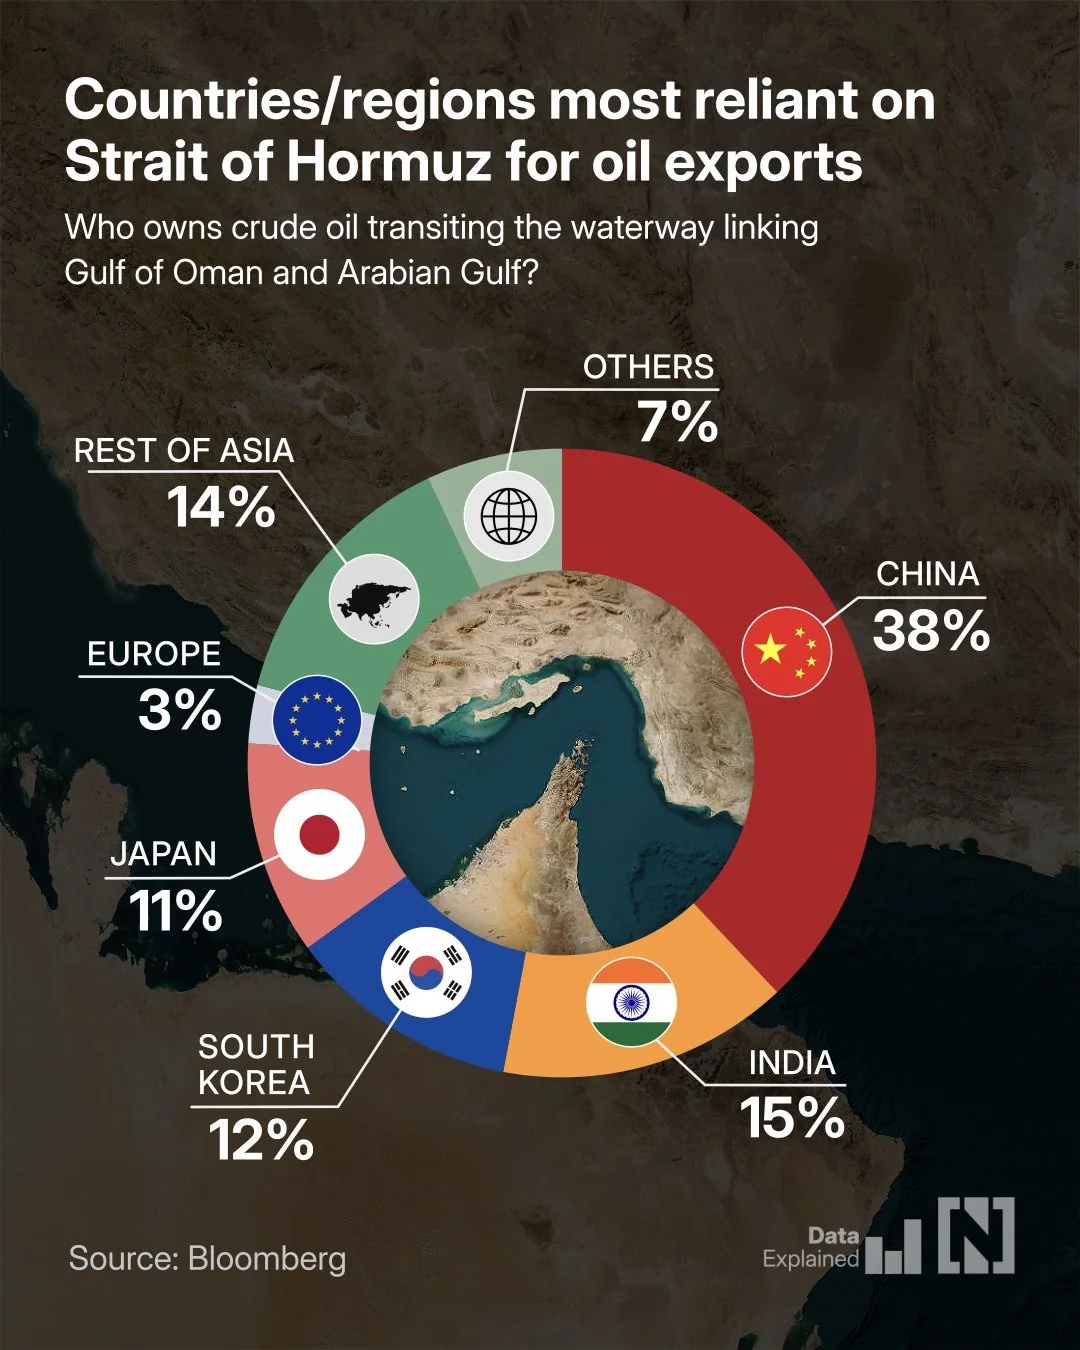
Countries most dependent on the Strait of Hormuz. Source: Bloomberg
Despite supply interruptions, oil prices remain below historic crisis levels due to futures-market management, Gulf inventories, pre-war production surpluses, and U.S. energy independence. Yet the geopolitical risk premium continues to drive global prices higher, prompting the Federal Reserve to temper rate-cut expectations.
Interestingly, Bitcoin has shown resilience during this risk-off phase, acting less like a speculative tool and more like a real-time geopolitical barometer. Its correlation with U.S. equities remains strong, but its role in global capital movements continues to evolve.
Meanwhile, the emergence of quantum computing threats looms as the next challenge for digital assets. Google recently warned that future machines may break current cryptographic standards far more easily than anticipated, urging accelerated adoption of post-quantum cryptography (PQC). While implementation may take years, projects like QRL, Abelian, and Algorand are already developing quantum-resistant frameworks—initiating the next critical “hard fork of trust.”
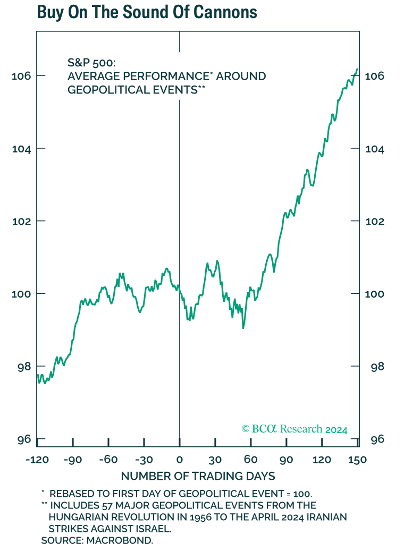
Buy when the cannons roar. Source: BCA Research 2024
Bitcoin thus stands at an inflection point—not only reflecting worldwide instability but also redefining itself from a rebellion asset to a tool of capital structure. Its future depends on addressing governance and security issues before they become existential risks.
7. Conclusion – Recovery Until Early Summer
Despite global unrest—or perhaps because of it—Bitcoin appears to be nearing a turning point. The combination of an oversold market, extreme pessimism, supportive seasonality, and the likelihood of further monetary expansion amid escalating debt all point toward a recovery lasting into early summer.
Nevertheless, the downward correction remains intact until Bitcoin sustainably breaks key resistance levels. As the final low of this crypto winter is still pending, volatility will endure. Assuming the Middle East crisis doesn’t worsen dramatically, we anticipate a near-term rebound toward USD 75,000–USD 80,000, possibly even USD 85,000, before one final capitulation phase concludes this cycle.
The “April 6th, 2026, Bitcoin – Recovery Until Early Summer” analysis is sponsored and initially published on April 1st, 2026, by www.celticgold.eu. Translated into English and partially updated on April 6th, 2026.
Join us in our free Telegram channel for daily charts, real time data and a great community. If you like to get regular updates on precious metals, commodities, and bitcoin, subscribe to our free newsletter.
Disclosure:
This article and the content are for informational purposes only and do not contain investment advice or recommendations. Every investment and trading move involves risk, and readers should conduct their own research when making a decision. The views, thoughts, and opinions expressed here are the author’s alone. They do not necessarily reflect or represent the views and opinions of Midas Touch Consulting.

