


Gold – Breather nearing its end
Gold nears the end of its consolidation phase after a stellar rally to new all-time highs, with silver surging ahead amid physical supply squeezes. This analysis reveals bullish chart setups, cooling sentiment, and macro tailwinds positioning precious metals for a structural bull run into 2026. Gold – Breather nearing its end.
1. Review
At the end of August 2025, gold, as expected, broke out of its four-month consolidation phase to the upside. Subsequently, gold prices rose almost continuously for two months. At the end of this brilliant rally, the gold price finally reached a new all-time high of USD 4,380 on October 21, which remains to this day.
However, a double top formed at the USD 4,380 mark, whereupon a sharp correction to USD 3,886 followed within just five trading days. The gold market initially recovered only slowly from this counterattack by the bears. Only from mid-November did a temporary recovery to around USD 4,245 succeed, which was quickly followed by the next sharp sell-off to USD 4,004.
Again, the gold bulls needed a few days to regroup before heading upwards again in the last week of November. In the process, the breakout from the consolidation triangle of the previous five weeks succeeded. Despite this positive development in itself, the bulls have so far been running unsuccessfully against the next resistance zone between approximately USD 4,240 and USD 4,265. Under sometimes wild fluctuations, the market has been moving back and forth around the USD 4,200 mark for almost two trading weeks now.
However, the psychologically important mark of USD 4,000 seems to be in no danger and serves as a new foundation “in the worst case.” Overall, the healthy consolidation at a high level has not yet been completely overcome. However, it seems to be only a matter of time before the next rally push to the upside comes on the gold market.
Silver takes the lead
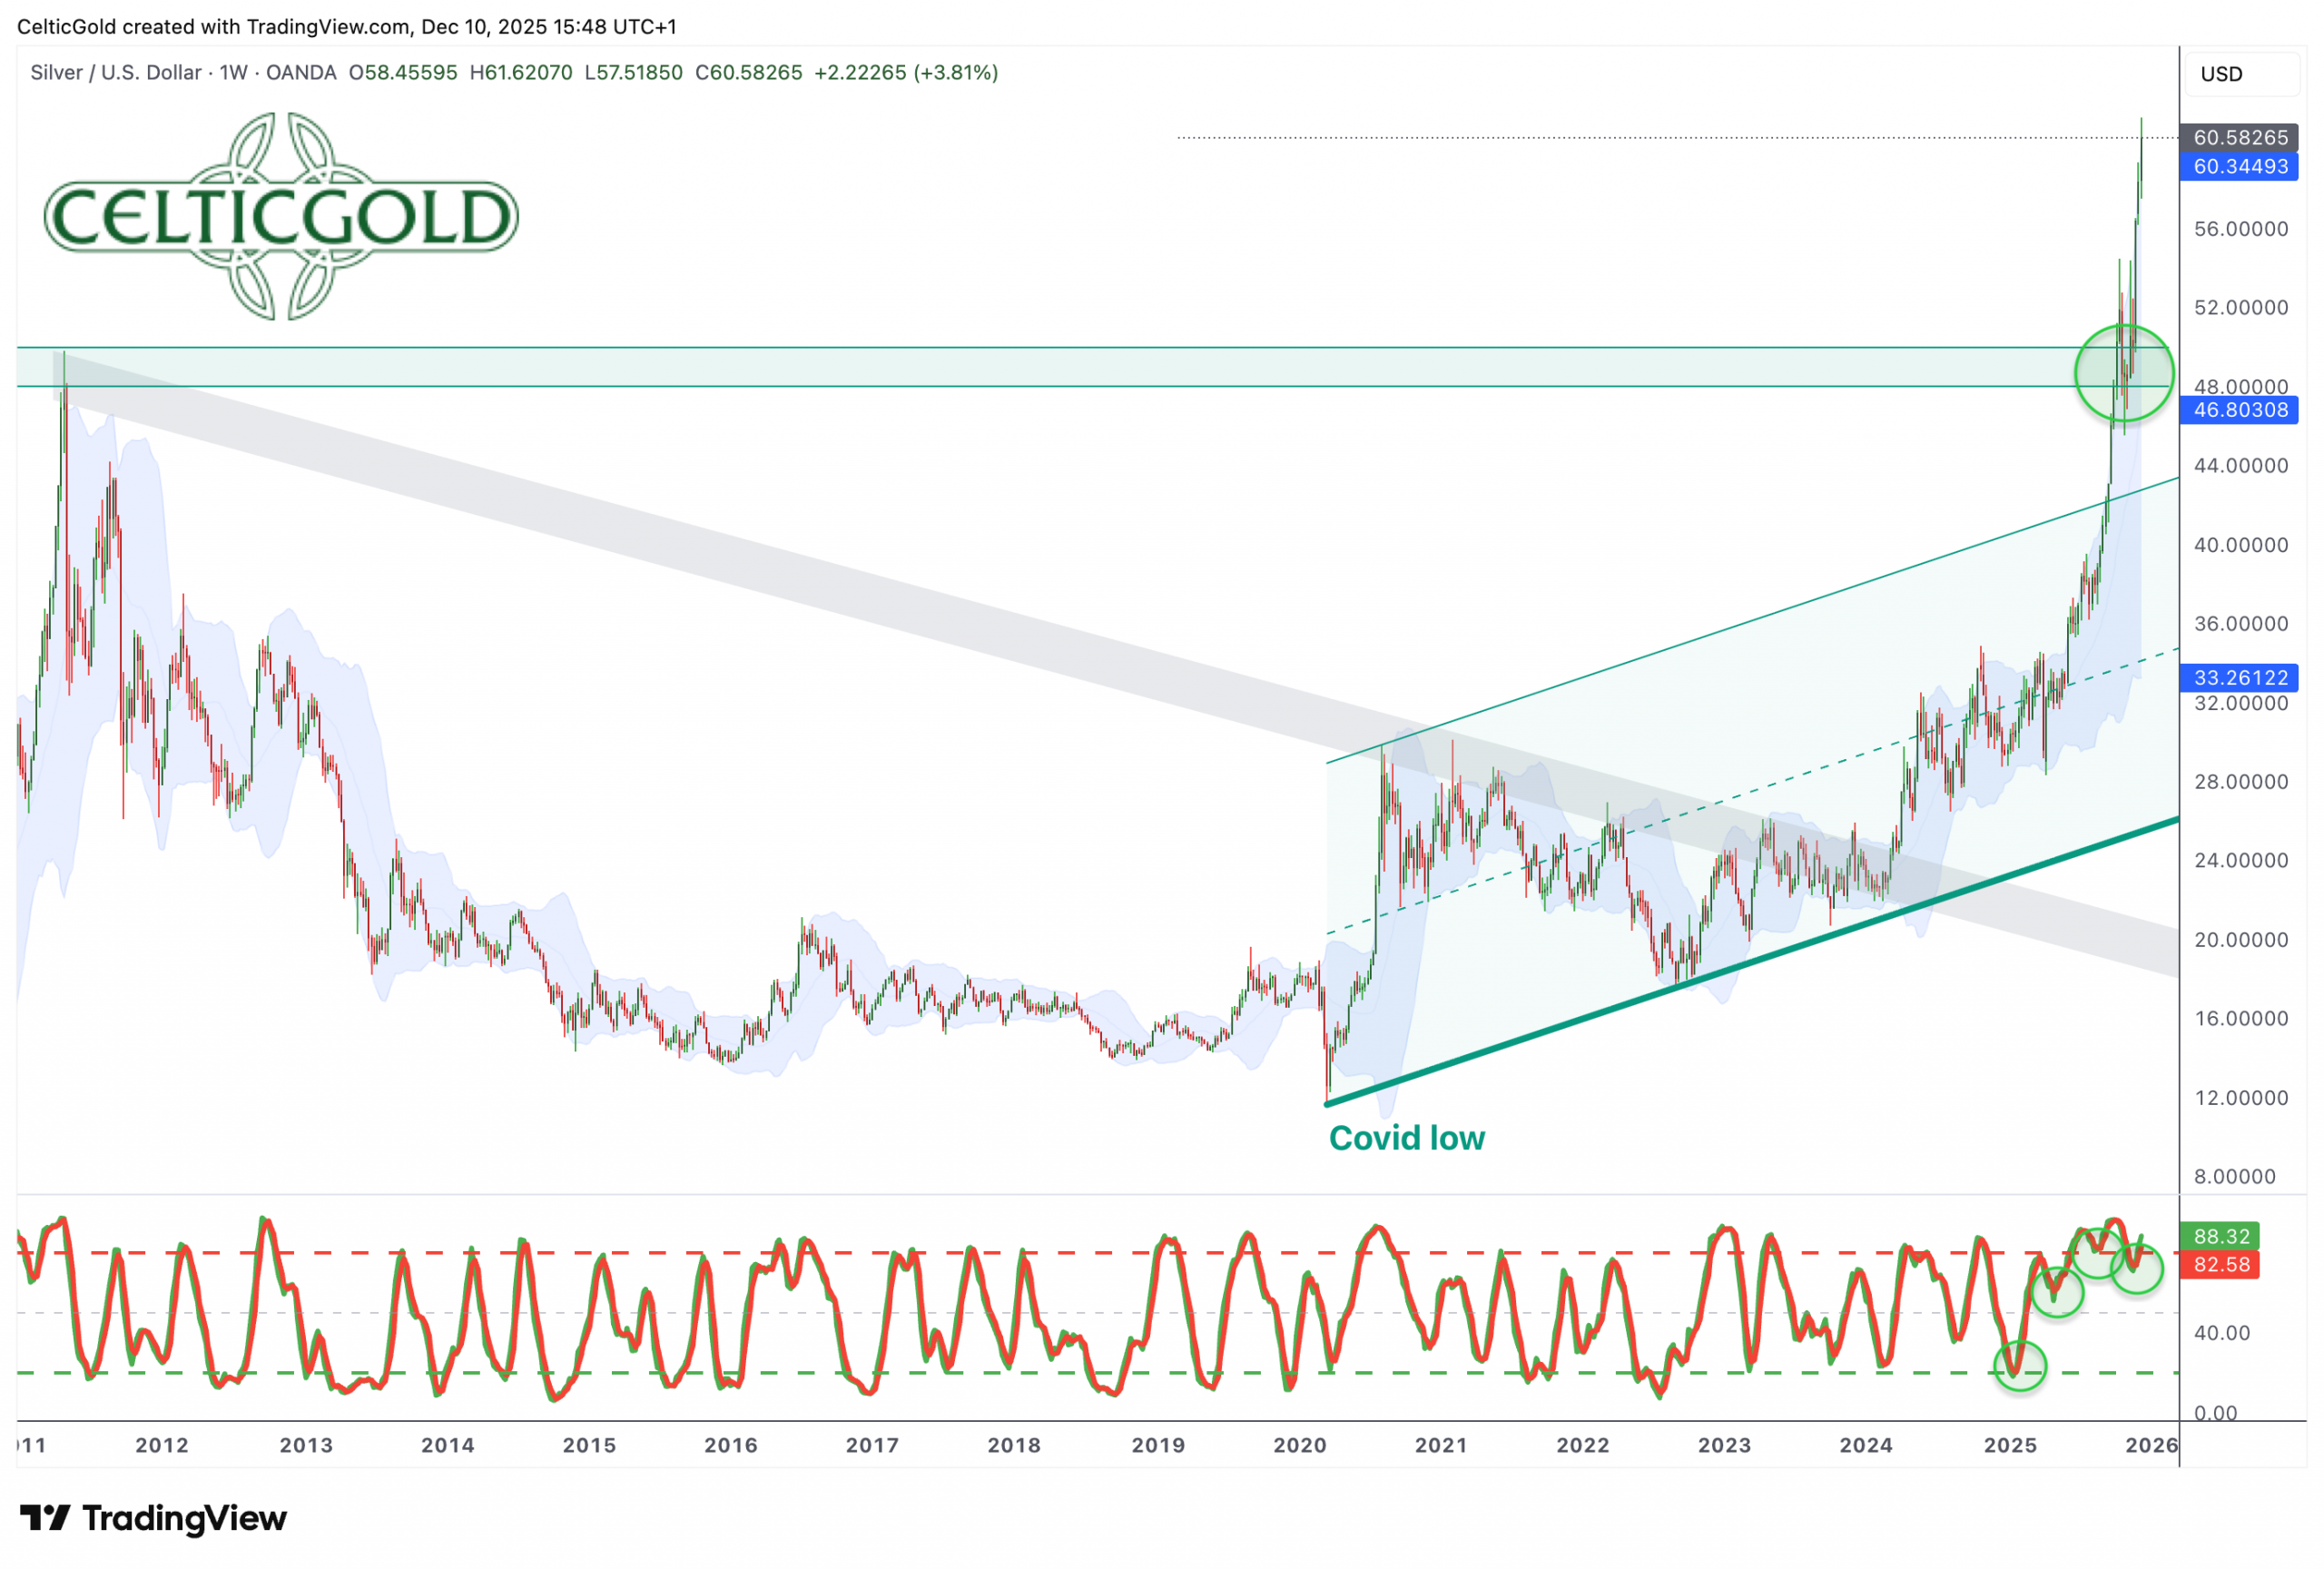
Silver in US-Dollar, weekly chart as of December 10th, 2025. Source: Tradingview
While the gold price is consolidating with a clearly bullish undertone, the silver price has spectacularly gained ground with its historic breakout above the 45-year resistance mark at USD 50 and has clearly taken the lead in the precious metals sector. Driven by acute bottlenecks in the physical market and growing delivery requirements on the major precious metal exchanges in New York, London and Shanghai, the silver price was able to advance to a new all-time high of USD 61.62 in a very short time. New all-time highs are reached almost daily and one ounce of silver costs more than one barrel of oil for the first time!
Most recently, the supply crisis on the derivatives market for silver has further intensified. The trigger was, among other things, an extraordinarily large delivery order for 7,330 contracts – this corresponds to around 1,134 tons of silver worth over USD 2 billion. The most severe “Silver Squeeze” to date, exacerbated by the failure of the CME database, led to a significant expansion of the backwardation between the London spot and the Comex futures price.
Silver’s Structural Squeeze
These developments, which surpass previous records in trading volume and occur in a phase of tight global liquidity, point to structural tensions in the paper silver market. Rumors of extensive deliveries to Shanghai also contributed to the increased volatility.
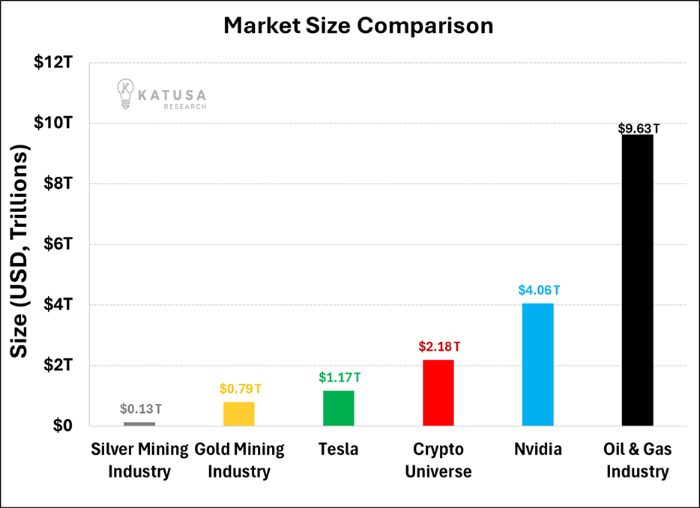
Comparison of market capitalization: Silver mining industry vs. Tesla, Nvidia, oil industry. Source: Katusa Research
The new foundation on the silver market should now be the historical mark of USD 50. Silver prices below this round mark are currently hard to imagine without dramatic distortions in the financial markets. If one also considers the minimal market capitalization of the entire silver mining industry, it becomes clear how much potential has been activated in the silver price and the silver mines thanks to the historic breakout.
2. Chart Analysis – Gold in US Dollars
Weekly Chart: Multi-week consolidation before completion?
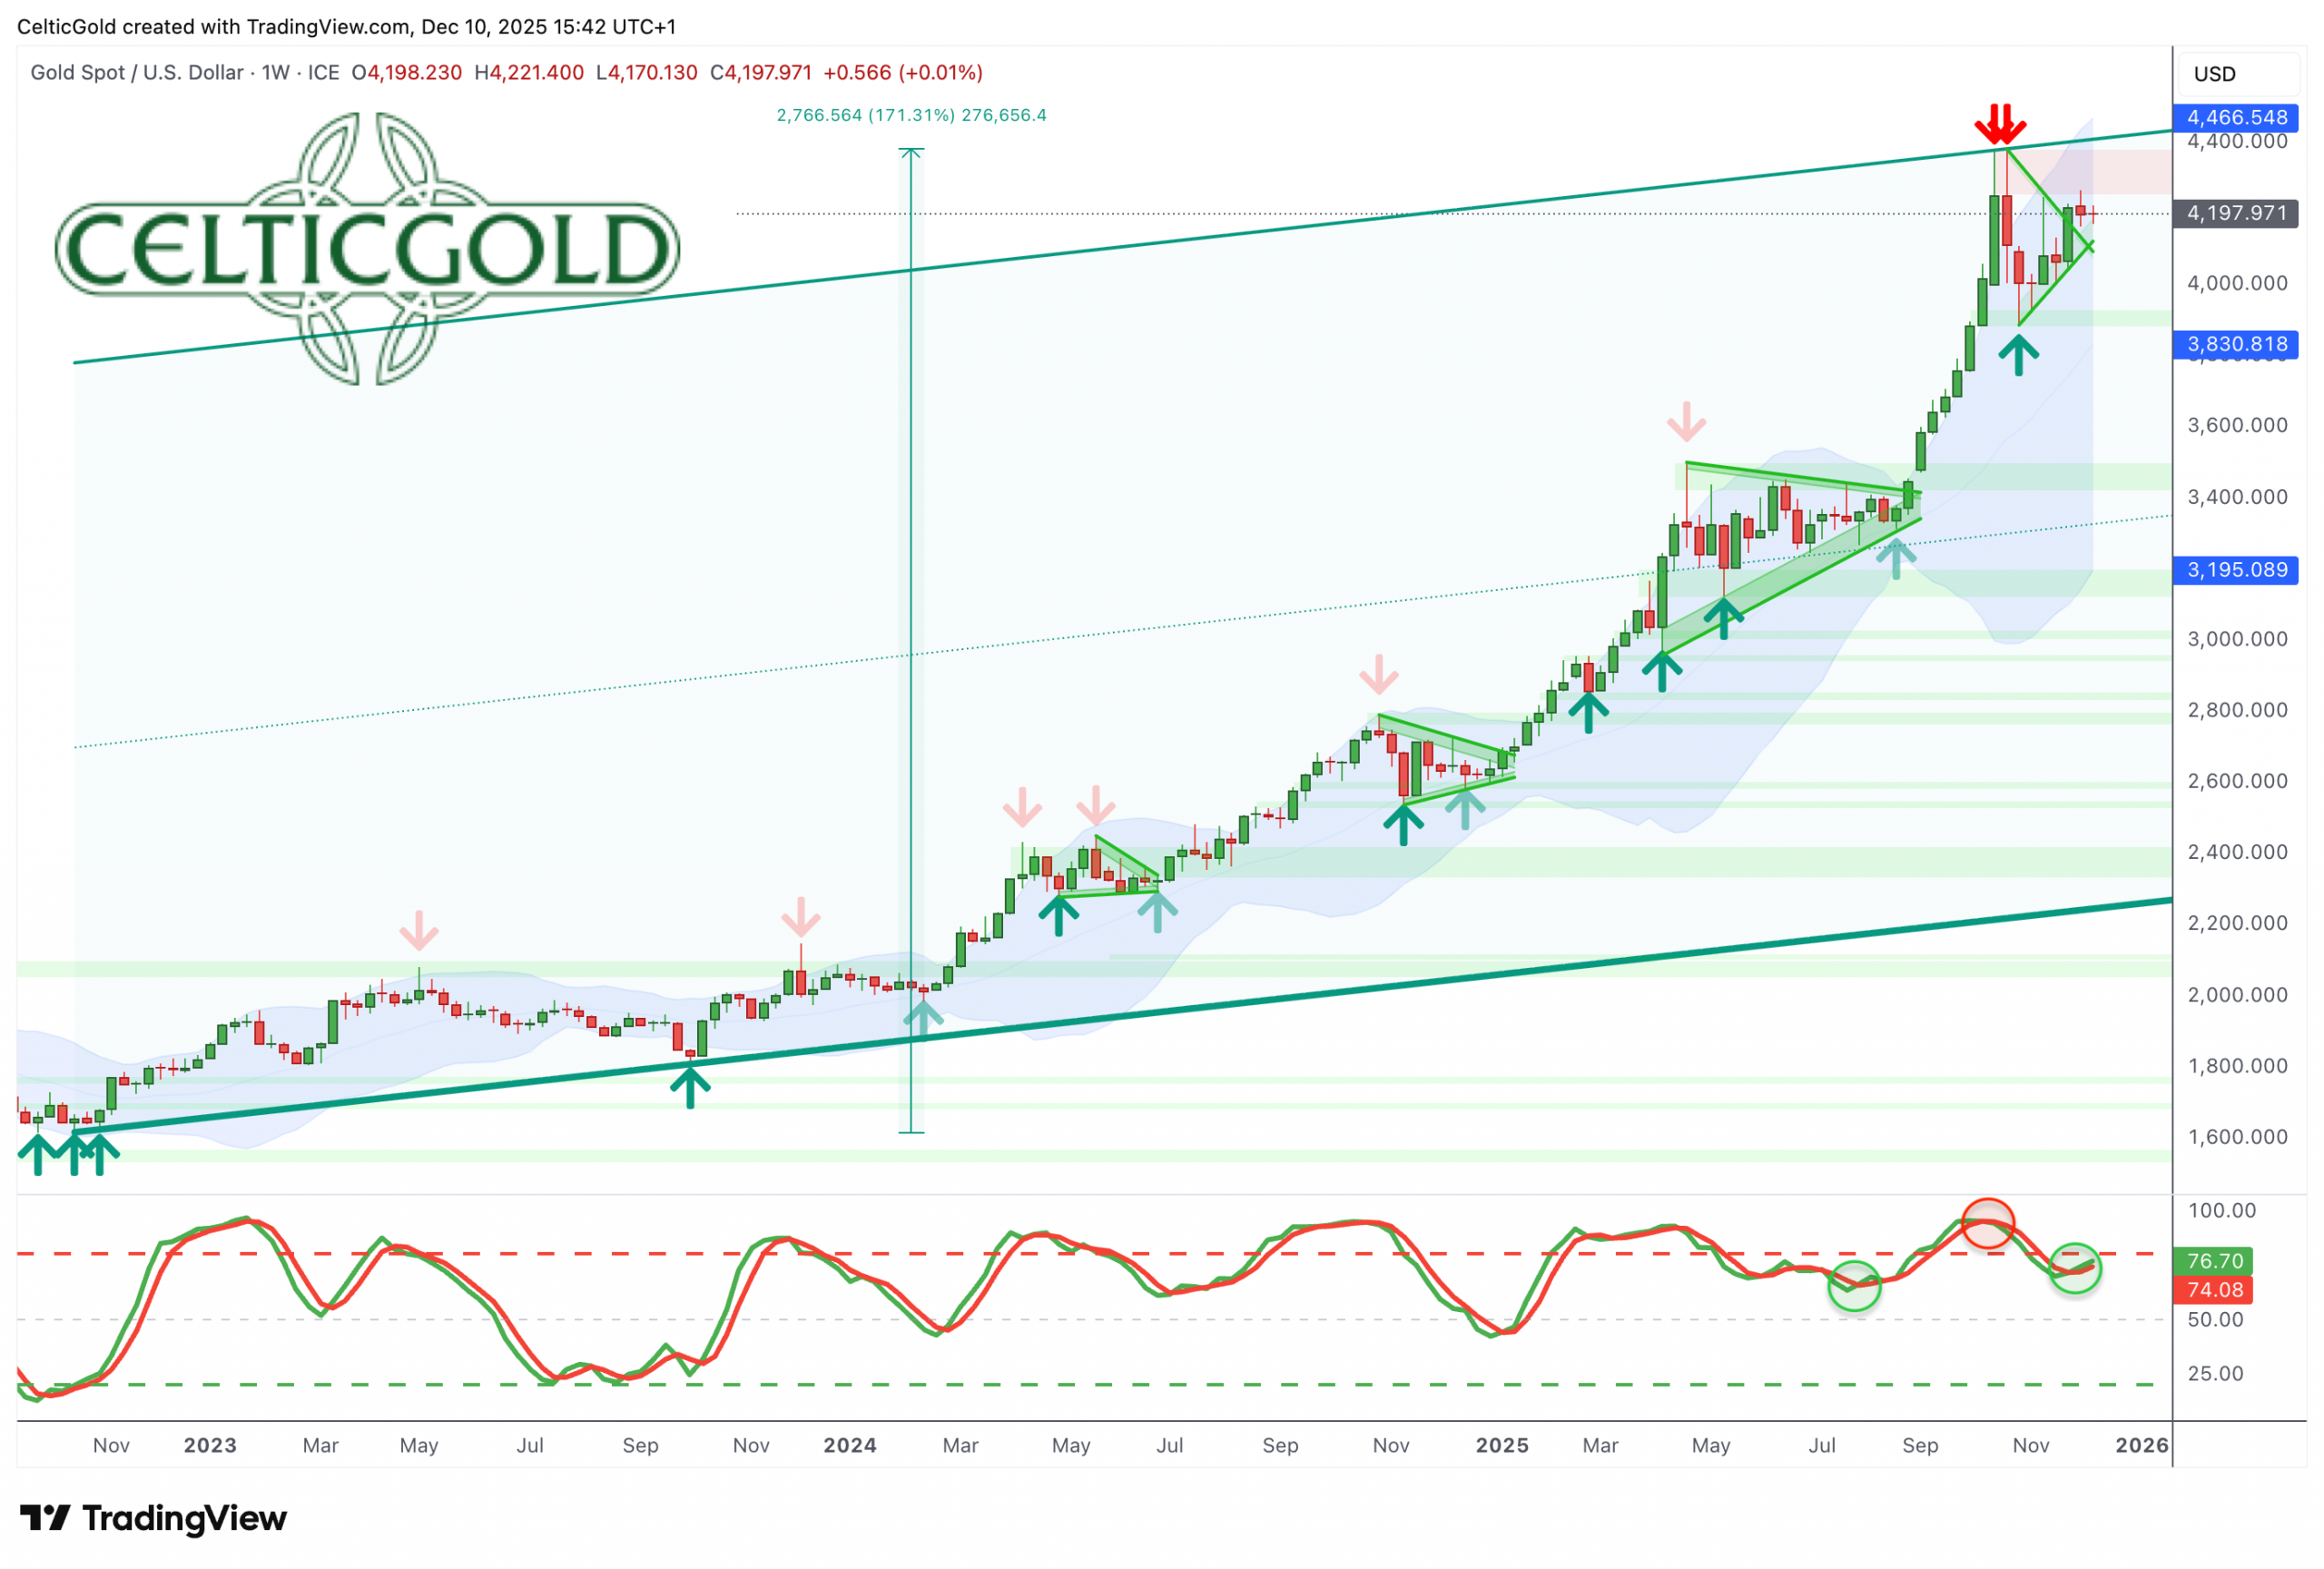
Gold in US-Dollar, weekly chart as of December 10th, 2025. Source: Tradingview
Since the breakout above the striking resistance zone around USD 2,075 in February 2024, the gold price knows no stopping. For almost two years, the quotations have been moving steadily upwards. Starting from the large triple bottom in the fall of 2022 at USD 1,615, the gold price was able to gain an impressive 171%. In the year 2025 alone, the price of the fine ounce rose by USD 1,760 or +67% at its peak. Currently, the annual performance is around +60%.
The gold market is currently in its fourth consolidation phase since the decisive breakout in February 2024. The low point of the sharp sell-off wave at USD 3,886 was neither tested nor undercut. Instead, the gold price has been trading comfortably above this critical mark at currently USD 4,207 for weeks. Thus, the consolidation running since October 21 is again playing out sideways at a high level or in a triangle.
Consolidation Nearing Completion
Since the bears can hardly make up ground on the downside and the silver price is rising sharply at the same time, the end of the consolidation phase should be approaching. However, the bulls need a breakout above USD 4,265 to initiate the next upward wave. If this succeeds, a rapid reunion with the all-time high at USD 4,380 would be very likely. This bullish assumption is supported by the weekly stochastic, which has already turned upwards again below the overbought zone.
Overall, the weekly chart is again showing an increasingly bullish picture and indicates an imminent continuation of the upward trend. In the worst case, the bears could force another pullback into the range between USD 4,100 and USD 4,130. But just such a pullback would be another attractive buying opportunity, because we expect gold prices around and above USD 5,000 by spring 2026.
Daily Chart: Patiently sideways
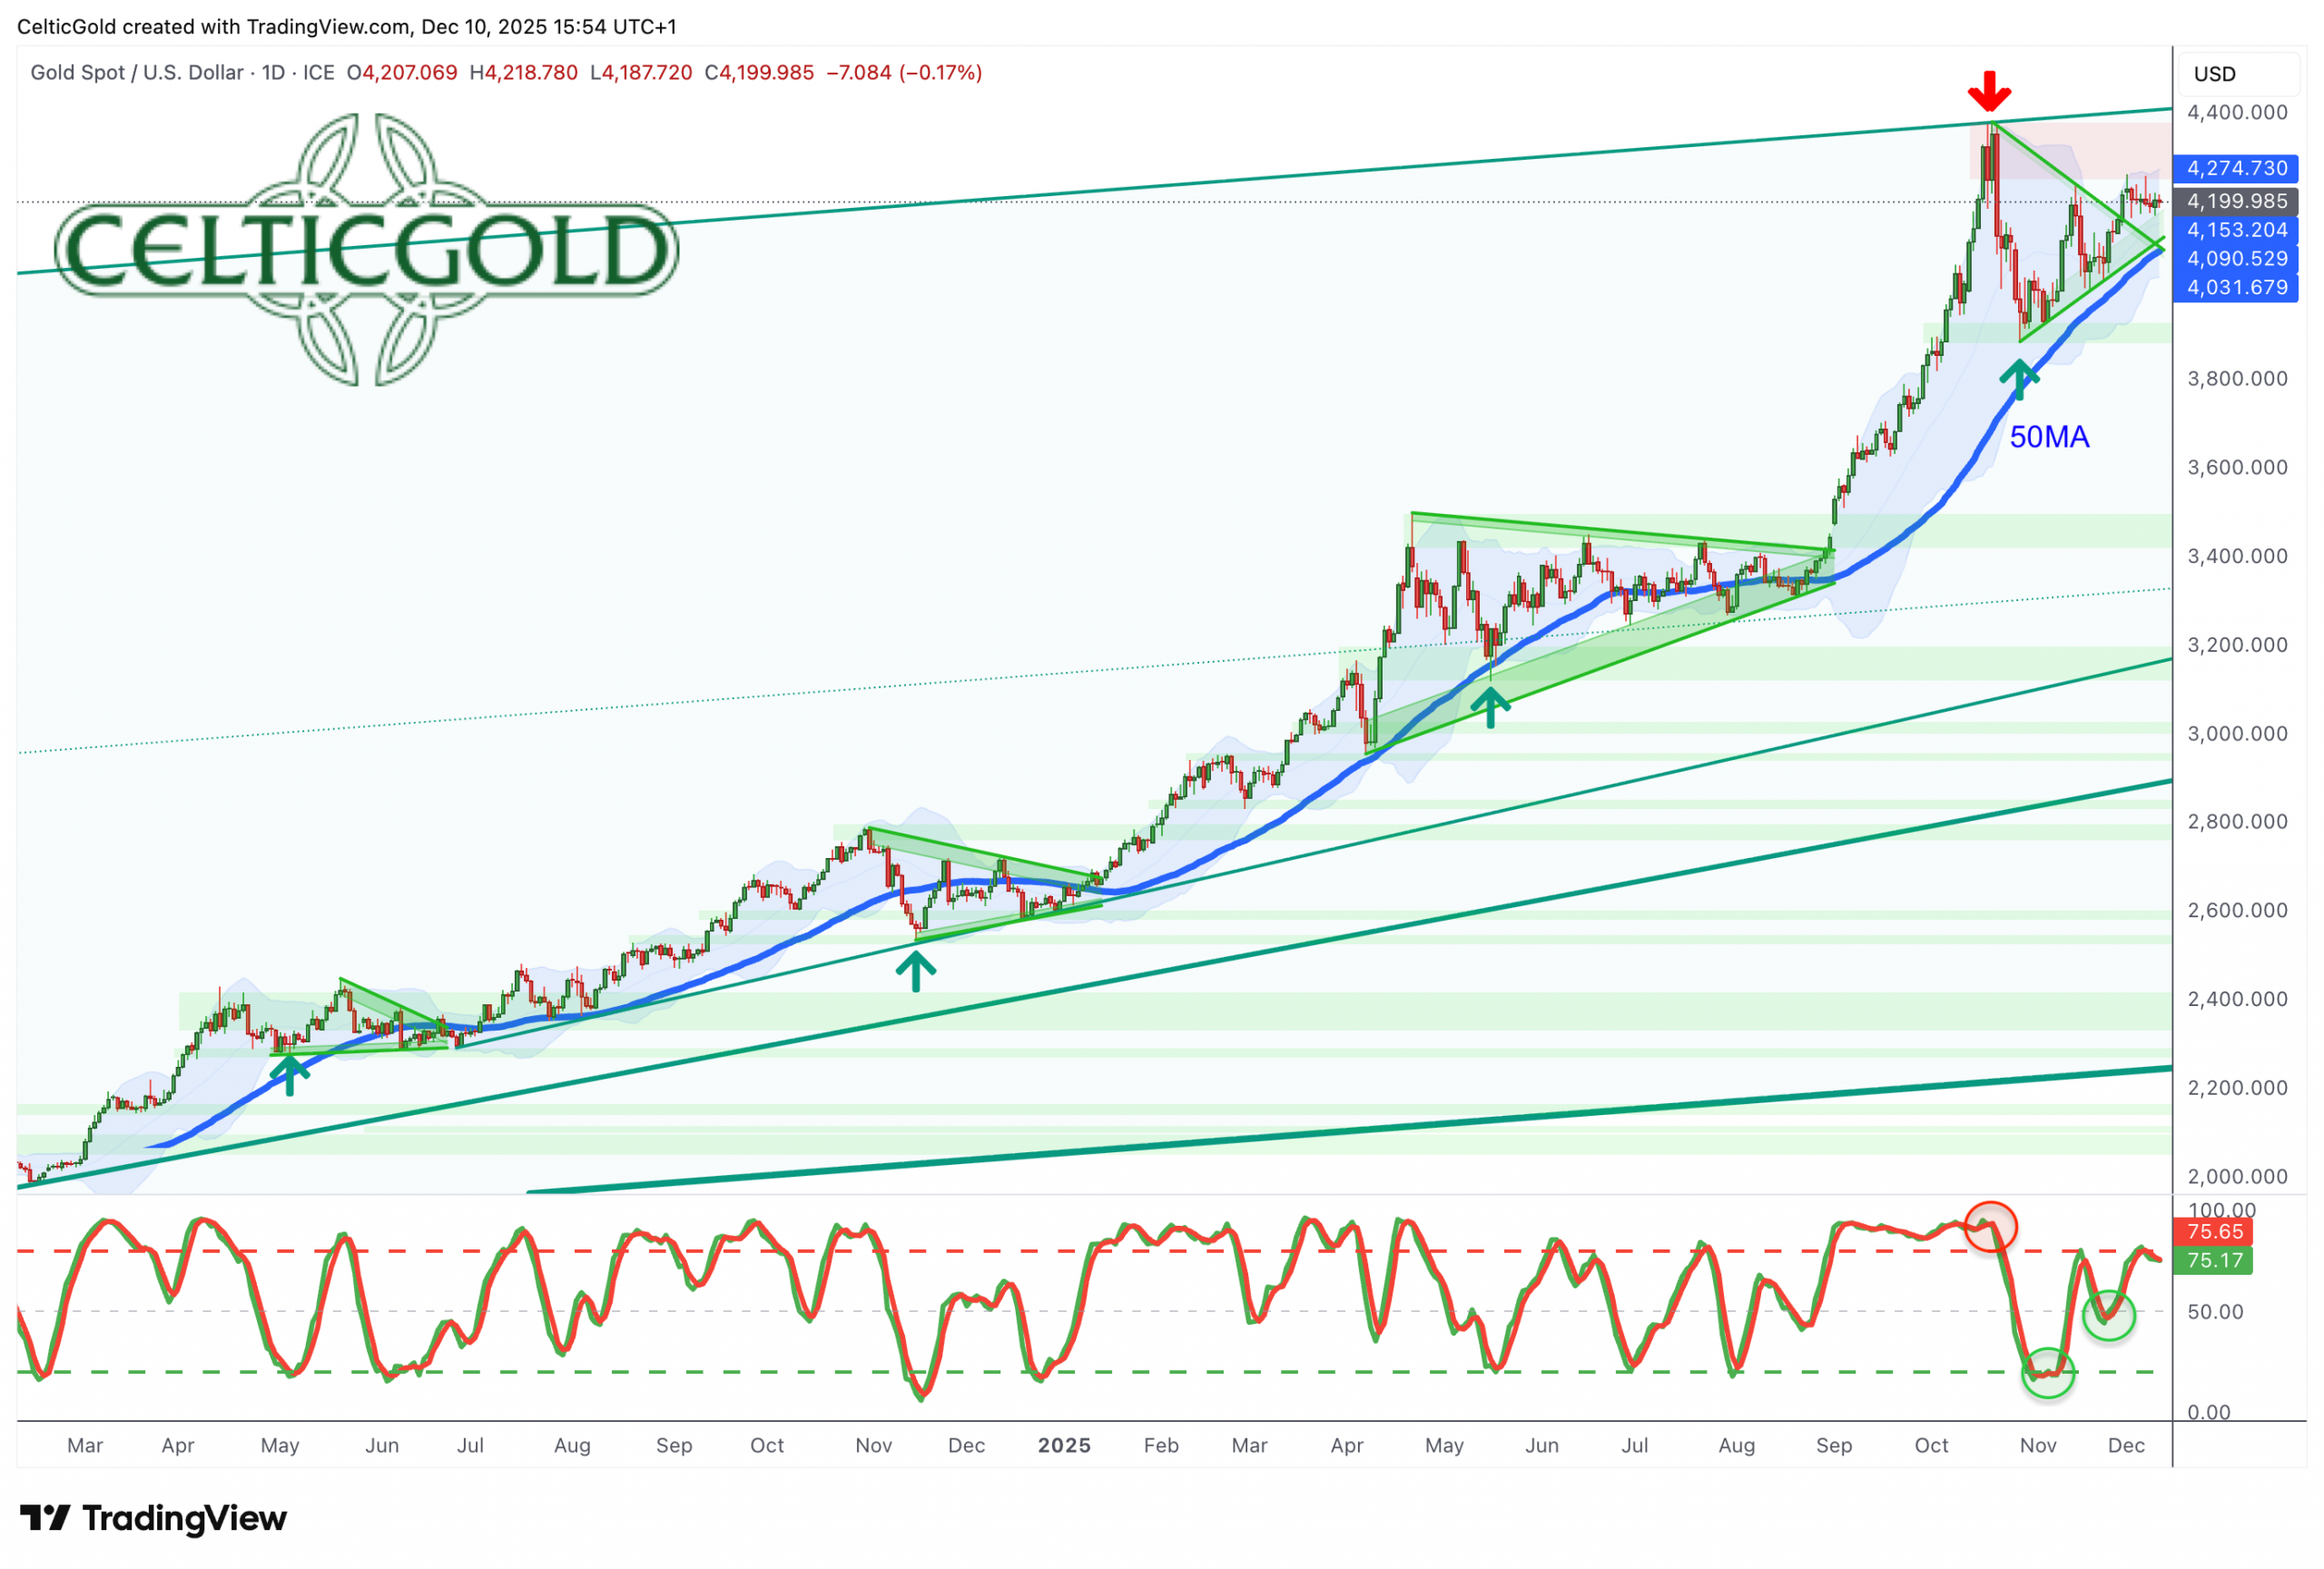
Gold in US-Dollar, daily chart as of December 10th, 2025. Source: Tradingview
Since the sharp correction and the low at USD 3,886 at the end of October, the gold price has been slowly but surely feeling its way towards the large resistance zone between USD 4,240 and USD 4,265. This tough recovery is now making a stable impression, especially because new buyers repeatedly came into the gold market quickly at prices below USD 4,200 in the past two weeks.
At the same time, the rapidly rising 50-day line (USD 4,090) has almost reached the current market action and serves as very solid support. The distance to the 200-day line (USD 3,505), on the other hand, is still relatively large (16.4%). The Bollinger Bands running parallel to each other currently limit the playing field at USD 4,270 on the upside and USD 4,032 on the downside.
In summary, the daily chart is to be rated neutral to slightly bullish. Although the gold price is currently tending to move sideways rather patiently and could start a new upward wave at any time, the breather in the bigger picture is probably not yet over. The momentum – measured by the daily stochastic – remains subdued and is currently not providing any clear impulses. While the music is currently playing on the silver price, the gold price seems to be enjoying the calm.
3. Commitments of Traders for Gold
The publication of the Commitment of Traders (CoT) data was interrupted due to the US government shutdown from October 1 to November 12, 2025. As a result, there is currently no current update on the CoT data, including the positions of the gold hedgers. The Commodity Futures Trading Commission (CFTC) has announced that the reports will be published in chronological order after the resumption of government work in order to catch up on the outstanding data.
These catch-up publications began on November 19, 2025 and will continue in December, with all missed reports being released successively. As long as the publication is not completed, no current gold hedgers positions are available. The CFTC plans to resume the normal publication cycle from January 2026, which means that complete and current CoT data on gold will not be available again until then.
4. Sentiment for Gold – Another cold shower
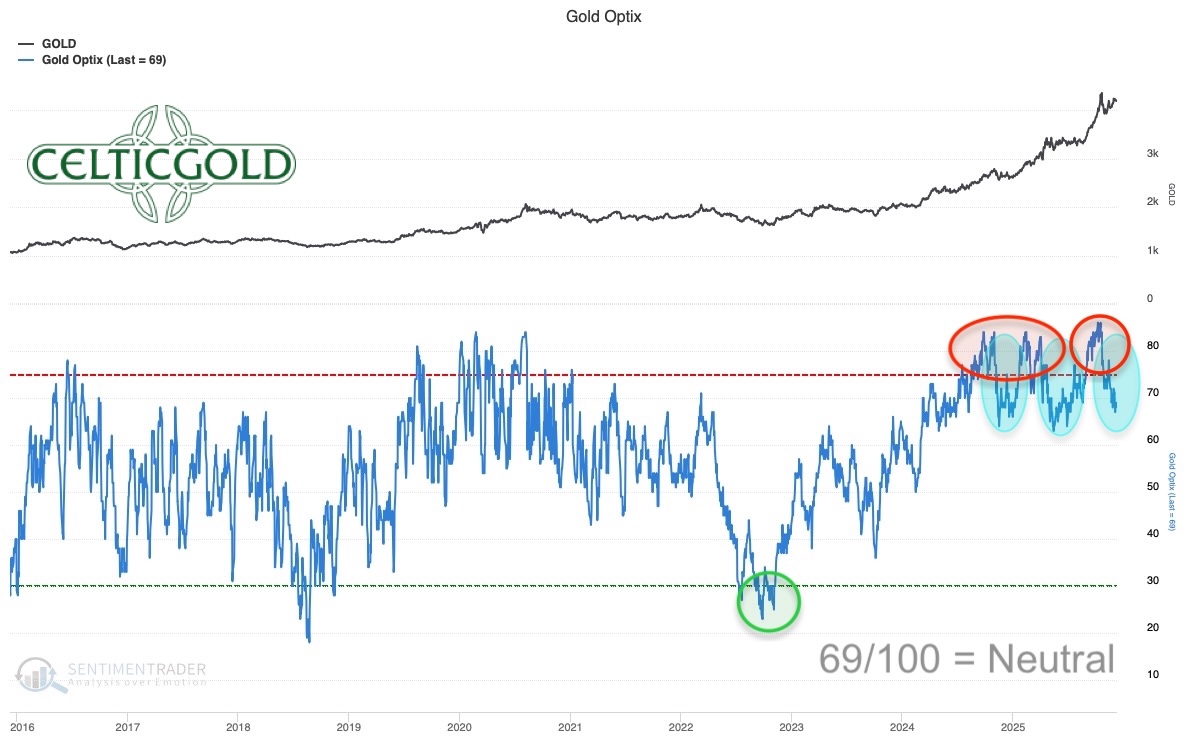
Sentiment Optix for gold as of December 9th, 2025. Source: Sentimentrader
Thanks to the sharp correction of almost USD 500 within just five trading days, the previously euphoric sentiment on the gold market cooled down abruptly at the end of October. In the following weeks, the gold price initially moved sideways and uncertainly, which did not strengthen confidence. Only for about two and a half weeks have the gold bulls been back in charge, and the gold price has been able to move noticeably upwards from the round mark of USD 4,000. Nevertheless, the sentiment indicator Sentiment Optix for the gold market is still trading below the overheated zone at 69.
In summary, the sentiment offers room to move upwards again and does not stand in the way of a continuation of the rally.
5. Seasonality for Gold – Breather nearing its end
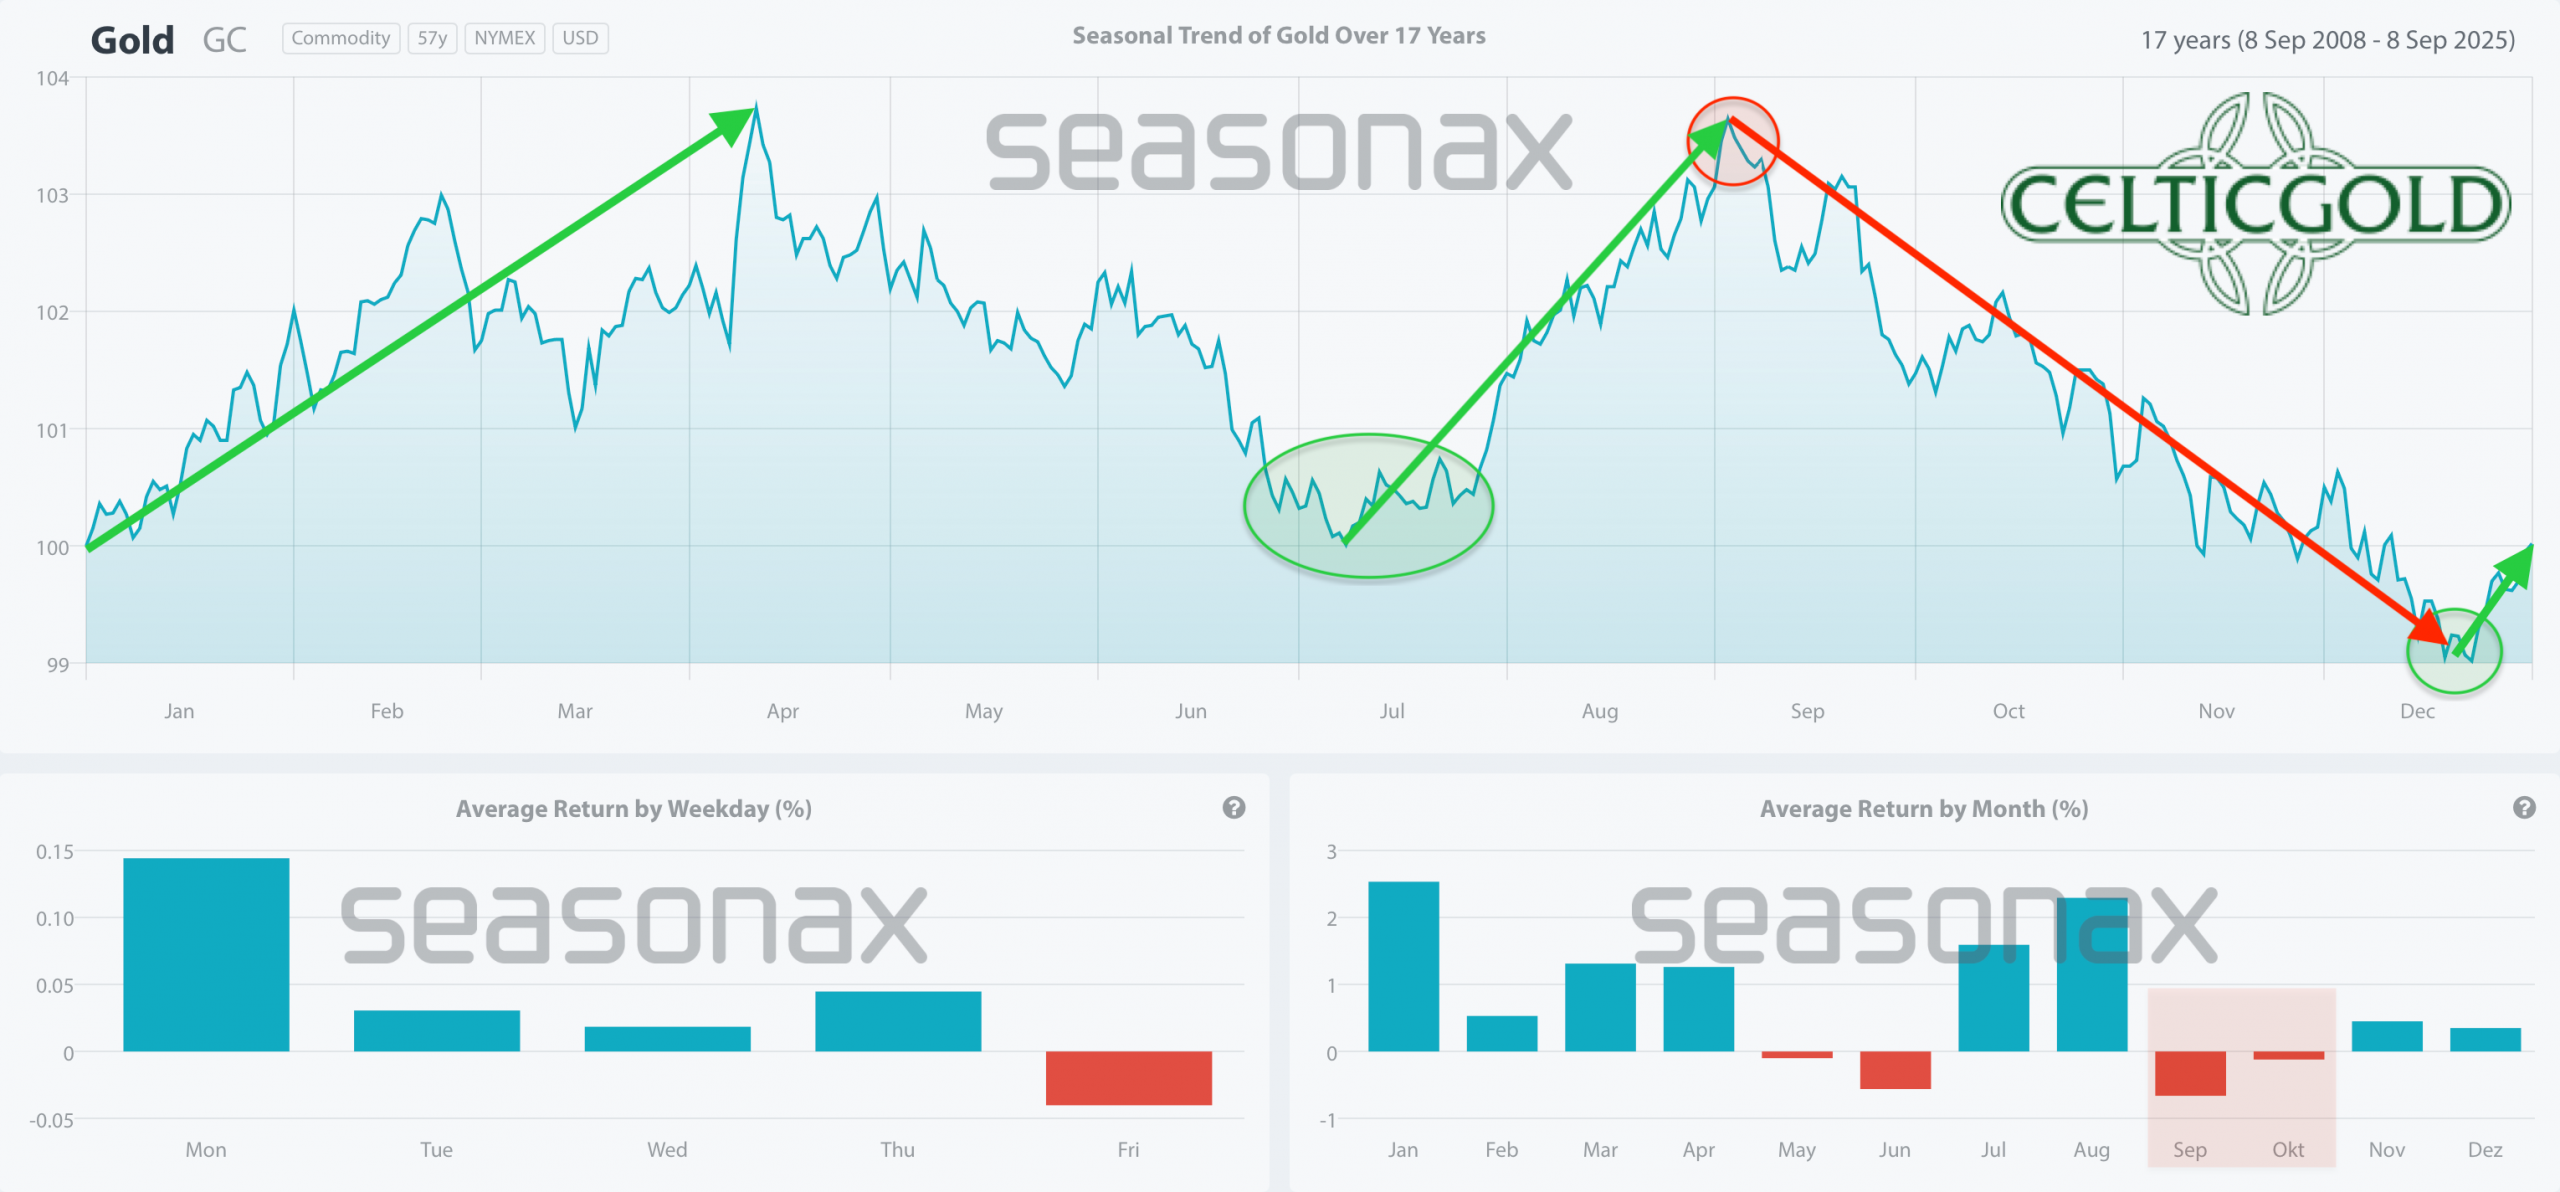 Seasonality for gold over the last 17-years as of September 8th, 2025. Source: Seasonax
Similar to the stock markets, seasonality also shows recurring patterns for the gold price for a long time. After the typical correction and consolidation phase in spring and early summer, the cyclical summer lows usually mark the beginning of a summer rally between mid/end of July and mid-August. This pronounced phase of strength usually reaches its peak in September or at the latest in October.
In the current year, this cycle has shifted slightly backwards, as the striking spring high at USD 3,500 was only formed at the end of April and the subsequent consolidation required four months. Accordingly, an important intermediate high was not to be expected until mid to late October. Starting from the new all-time high at USD 4,380, the gold price is now actually in a multi-week correction phase this year as well, which is expected to last until mid-December.
Traditionally, the trend reversal in the gold price often falls in the period around the last FOMC meeting of the year in mid-December. This event plays a crucial role for the further course, as the US Federal Reserve often makes its monetary policy decision on this date, which influences the interest rate development and thus the attractiveness of gold as an investment. Historical experience shows that a new upward movement usually starts on the gold market towards the end of the year, which then runs into the spring of the following year.
Overall, the seasonal traffic light is currently turning green again!
6. Macro Update – The peak of liquidity – How the age of cheap money dissolves itself
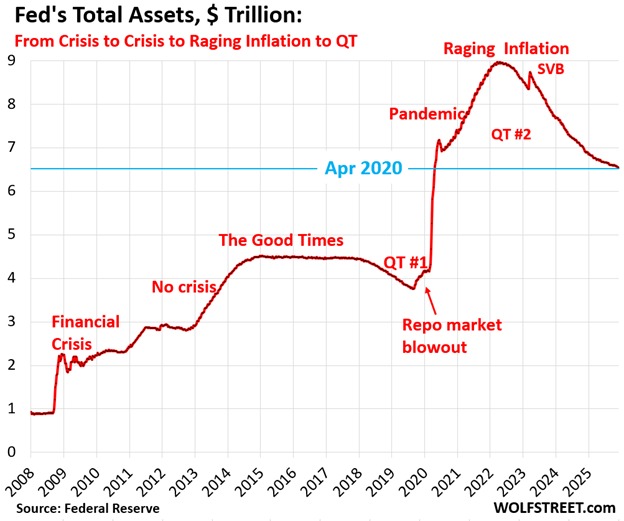
Total assets of the FED, in Bio. USD, as of December 7th, 2025. Source: The Kobeissi Letter
There are historical moments when monetary policy becomes metaphysics. We are at such a point. The world of liquidity – that invisible ocean on which all markets float – is beginning to recede. Thanksgiving week offered a brief moment of glory, but the Fed’s weak “Not-QE” of just USD 120 billion is like a drop in the bucket. Since June alone, approximately USD 570 billion has been sucked out of the financial system, devoured by the black hole of an insatiable fiat universe.
Global liquidity was able to increase by around USD 750 billion to USD 187.31 trillion in the past week. Nevertheless, it remains below the high from November. The pace of growth has recently slowed – due to the Fed’s quantitative tightening, lower liquidity from the Bank of Japan and a slightly stronger US dollar. The upward movement since the end of 2022 seems to be coming to an end. Although the Peoples Bank of China (PBoC) is still keeping the dripping tap on, and the end of “Quantitative Tightening (QT)” in the USA could temporarily offer support. But the market rotation – away from the developed markets, towards the emerging markets – reveals: We are in the late stage of the cycle.
Renaissance of precious metals
At the same time, the signs of an epochal shift are intensifying: physical values against digital promises. Gold, silver and platinum mark new high points of a structural renaissance, which basically means the return to an ancient trust: When everything fluctuates, only the metal holds. Precious metals are no longer a hedge, but a vote of no confidence in the paper age.
Crypto winter and shadow streams
Meanwhile, the liquidity-sensitive cryptosphere is falling into its own tragedy and seems like a faded dream of digital omnipotence fantasies. Within seven weeks, Bitcoin has crashed by USD 47,735 or 36.2% and has clearly fallen below the technically decisive mark of USD 95,000. Despite the new all-time high at the beginning of October and the recent turnaround of prominent skeptics such as Jamie Dimon and Larry Fink, Bitcoin is thus symbolic of the continued fragility of the entire sector. The late enthusiasm of the major bankers for the supposedly “new asset class” seems all the more hollow, as mistrust, regulatory risks and increasing evidence of money laundering and abuse are again burdening the industry.
Even the recent initiative by the CFTC, in which Bitcoin, Ethereum and USDC were approved for the first time as collateral in regulated derivatives trading, has so far failed to initiate a sustainable turnaround in the crypto sector. Although this step strengthens the legitimacy of digital assets, as it integrates them more strongly into the regulated US financial infrastructure and improves market liquidity. At the same time, however, it undermines the independence of the industry by expanding the influence of state supervision and regulation.
Crypto’s Dark Underbelly
The deceptive hope that every pullback is a buying opportunity is turning into a mousetrap for greedy optimists. The crypto winter is no longer a metaphor – it has most likely begun. Possibly, the price slump was not only due to the generally receding liquidity, but presumably also because enormous amounts from opaque Ukrainian money flows were liquidated or reallocated to gold. Behind the glamorous facade of institutional advocacy is a highly speculative market characterized by geopolitical shadow streams, forensically barely traceable money laundering and the reduction of war-related crypto positions. It is remarkable how strongly crypto has developed as a kind of “criminal PayPal” – and how deeply the Ukrainian influence is anchored in it.
Since 2014, several hundred billion euros in financial, military and humanitarian aid have been pumped into Ukraine from the West (EU, USA, G7/NATO states and institutions). Exact sums vary depending on the source, reference date and commitment or disbursement. Of this, at least 30% are likely to have seeped away into dark corruption channels or been exchanged for Bitcoin. A lasting peace in Ukraine would therefore tend to burden Bitcoin.
In the medium to long term, however, the traditional financial system will give way to the cheaper, faster and more efficient blockchain and token system. Presumably, the major financial institutions are using the correction cycle to switch to the digital structures.
Crumbling facade of the bond markets
But it is not only the cryptos that signal the deflation of an overstretched bubble. The interest rate regime itself is also at a historic turning point. When the Bank of Japan recently threatened an interest rate step, it was nothing less than a liberating blow from the age of interest rate nihilism. It is returning to the classic doctrine that short rates must follow the long ones – not the other way around. Rising yields, as paradoxical as it sounds, are the solution, not the problem: They attract capital and stabilize debt sustainability. Japan recognizes what Europe represses.
Worldwide, the yields on outstanding bonds rose significantly recently. In Germany, the 10-year Bund is trading at 2.86%. The facade is crumbling: Rising yields are not background noise, but the tectonic tension that remains quietly for a long time before it is discharged.
Europe’s threat to sell off US Treasuries en masse in the event of a “Trump peace solution” is no longer a mere geopolitical tactic, but financial nuclear deterrence. But whoever shoots, dies first: Without US dollar collateral, Europe’s banks face a liquidity infarction within three days. The mutual captivity of the transatlantic financial order comes to light with brutal clarity.
The “strong” US consumer
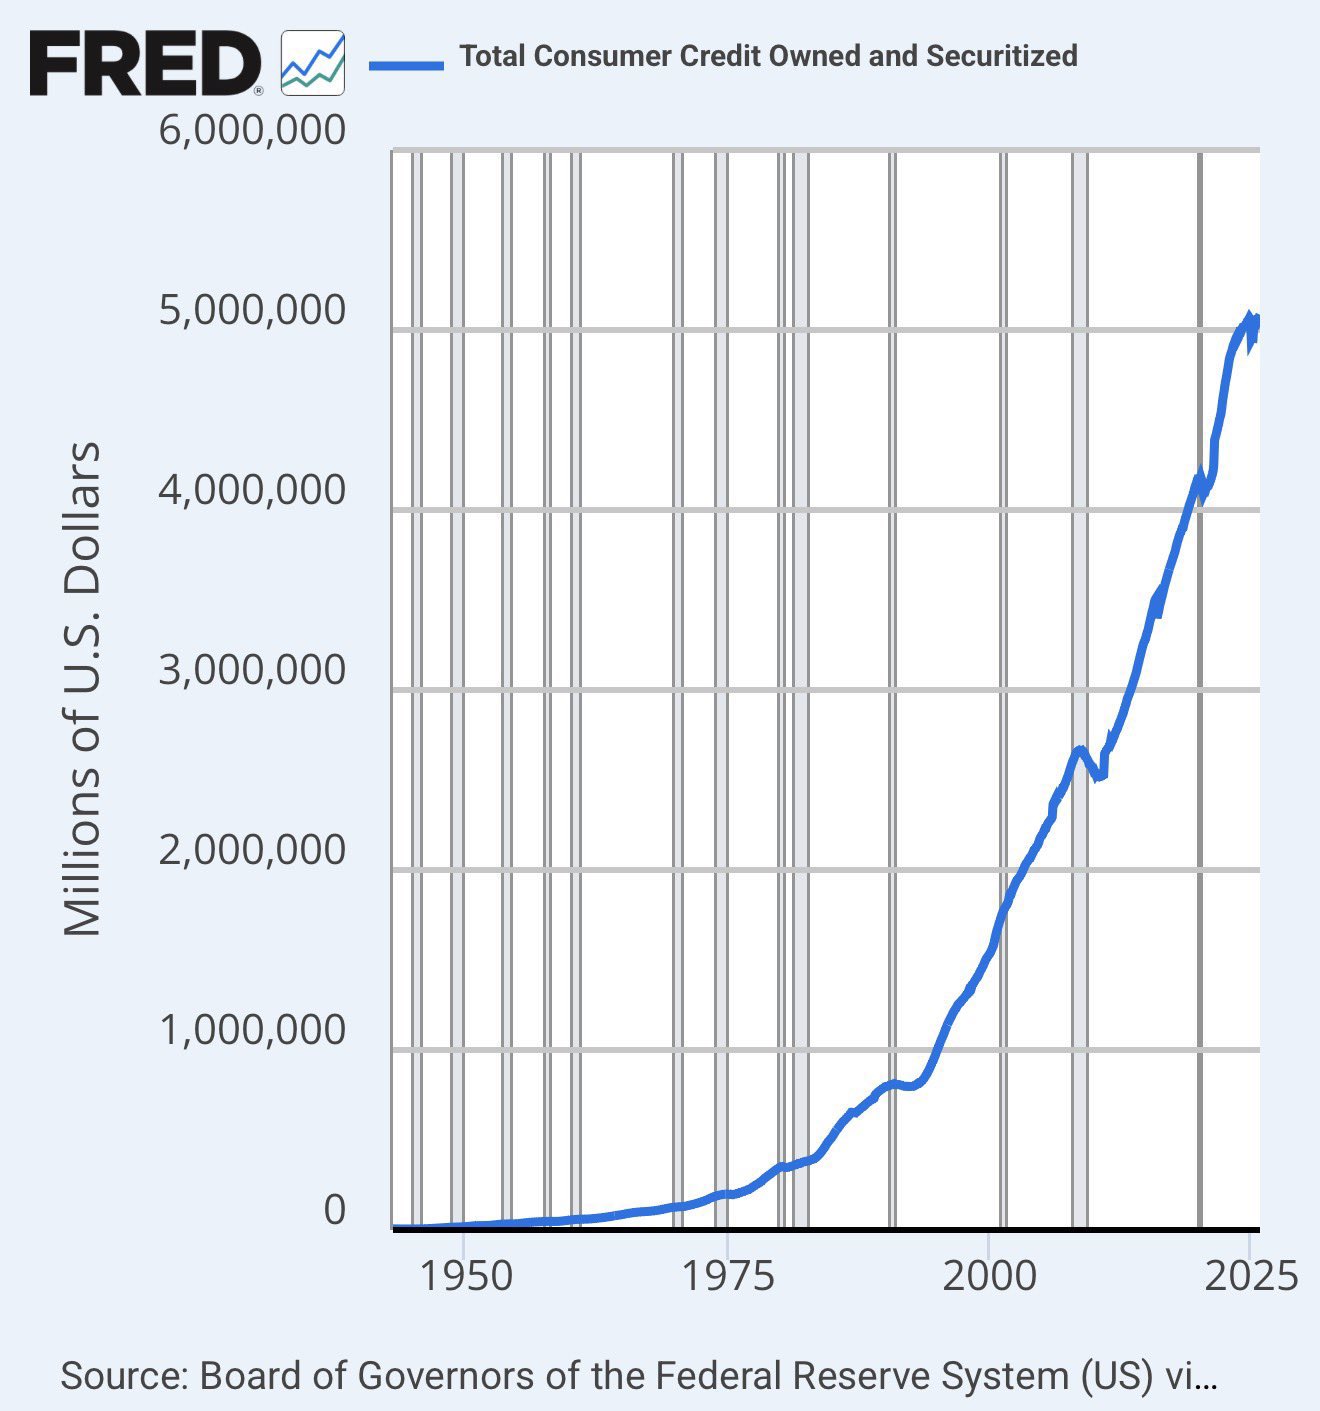 Total consumer credit (owned and securitized), from December 09, 2025. Source: NoLimit
At the same time, consumer debt in the USA is exploding to around USD 5 trillion – the highest level in history. This time, however, Americans are not financing their dreams, but necessities: food, rent, medical care. The “strong consumer” is a mirage; if this last line of credit breaks away, the house of cards that carries 70% of US GDP will topple.
China, in turn, is reducing its US Treasuries to a 17-year low, while hedge funds in the Cayman Islands are filling the vacuum – with 100-fold leverage in the shadow of the repo markets. They have taken the place of the Fed, but without its stability. A spark in Tokyo or Washington is enough, and the entire system collapses in the domino effect of the margins.
The looming Funding Shock 2026

All of this culminates in a depressing diagnosis: 2026 does not threaten a normal downturn, but temporarily a global funding shock. U.S. Treasuries form the epicenter, flanked by Japan’s collapsing carry trade and China’s simmering credit crisis. If one of these axes breaks, the entire credit system trembles – and then follows, almost fatefully, the flood of liquidity again – the reaction that carries everything and at the same time devalues everything.
This is the cycle of creation and destruction of our financial order: first withdrawal, then flooding. The storm is still quiet, but the barometer is falling. Those who read the signs continue to collect gold, silver and platinum.
7. Conclusion – Breather nearing its end
The breathtaking rally in the gold price in September and October had forced a long-overdue breather. After the almost vertical rise and the new all-time high of USD 4,380, the gold market is currently consolidating its massive price gains. As long as the zone around approximately USD 4,100 to 4,130 holds, the rally should soon continue. This is especially true as precious metals now receive strong tailwinds from seasonality well into the spring.
At the same time, the momentum in the precious metals sector has clearly shifted in favor of silver. With the breakout above the historical USD 50 mark and a massive supply squeeze on the futures market, silver has taken the lead and is signaling that the structural precious metal bull market will now continue to gain breadth.
Against the backdrop of a retreating liquidity regime, growing tensions in the credit and bond market, and a fragile crypto sector, physical precious metals appear more than ever as a strategic long-term reserve. In the short term, the consolidation in gold may not yet be over – in the medium term, however, the next major upward wave is only a matter of time. We consider gold prices in the range between approximately USD 5,000 and 5,200 to be realistic by spring 2026.
“December 10th, 2025, Gold – Breather nearing its end” – analysis was initially published on December 10th, 2025, by www.celticgold.de and translated into English on December 10th, 2025.
Feel free to join us in our free Telegram channel for daily real time data and a great community. If you like to get regular updates on our gold model, precious metals and cryptocurrencies you can subscribe to our free newsletter.
Disclosure:
This article and the content are for informational purposes only and do not contain investment advice or recommendations. Every investment and trading move involves risk, and readers should conduct their own research when making a decision. The views, thoughts and opinions expressed here are the author’s alone. They do not necessarily reflect or represent the views and opinions of Midas Touch Consulting.

