


Bitcoin – Some chance for a recovery
Bitcoin and the whole crypto sector are in a bear market for nearly a year now. The selloff has been brutal and any recovery has been short-lived. However, in recent months the correction has slowed down, and Bitcoin continues to find support around 18,000 to 20,000 USD. Bitcoin – Some chance for a recovery.
Review
Since crashing to 17,600 USD in mid-June 2022 Bitcoin prices have only slowly to recovered. Although there was a weak bounce in August to around 25,200 USD, prices have mainly been moving sideways between 18,500 USD and 20,000 USD in recent months.
If you want to report at least something positive, then it is probably the fact that Bitcoin (BTC), in contrast to stock and bond markets as well as the price of gold, has not marked a new low in the last four months. Instead, it has been able to hold above 18,200 USD since mid-June.
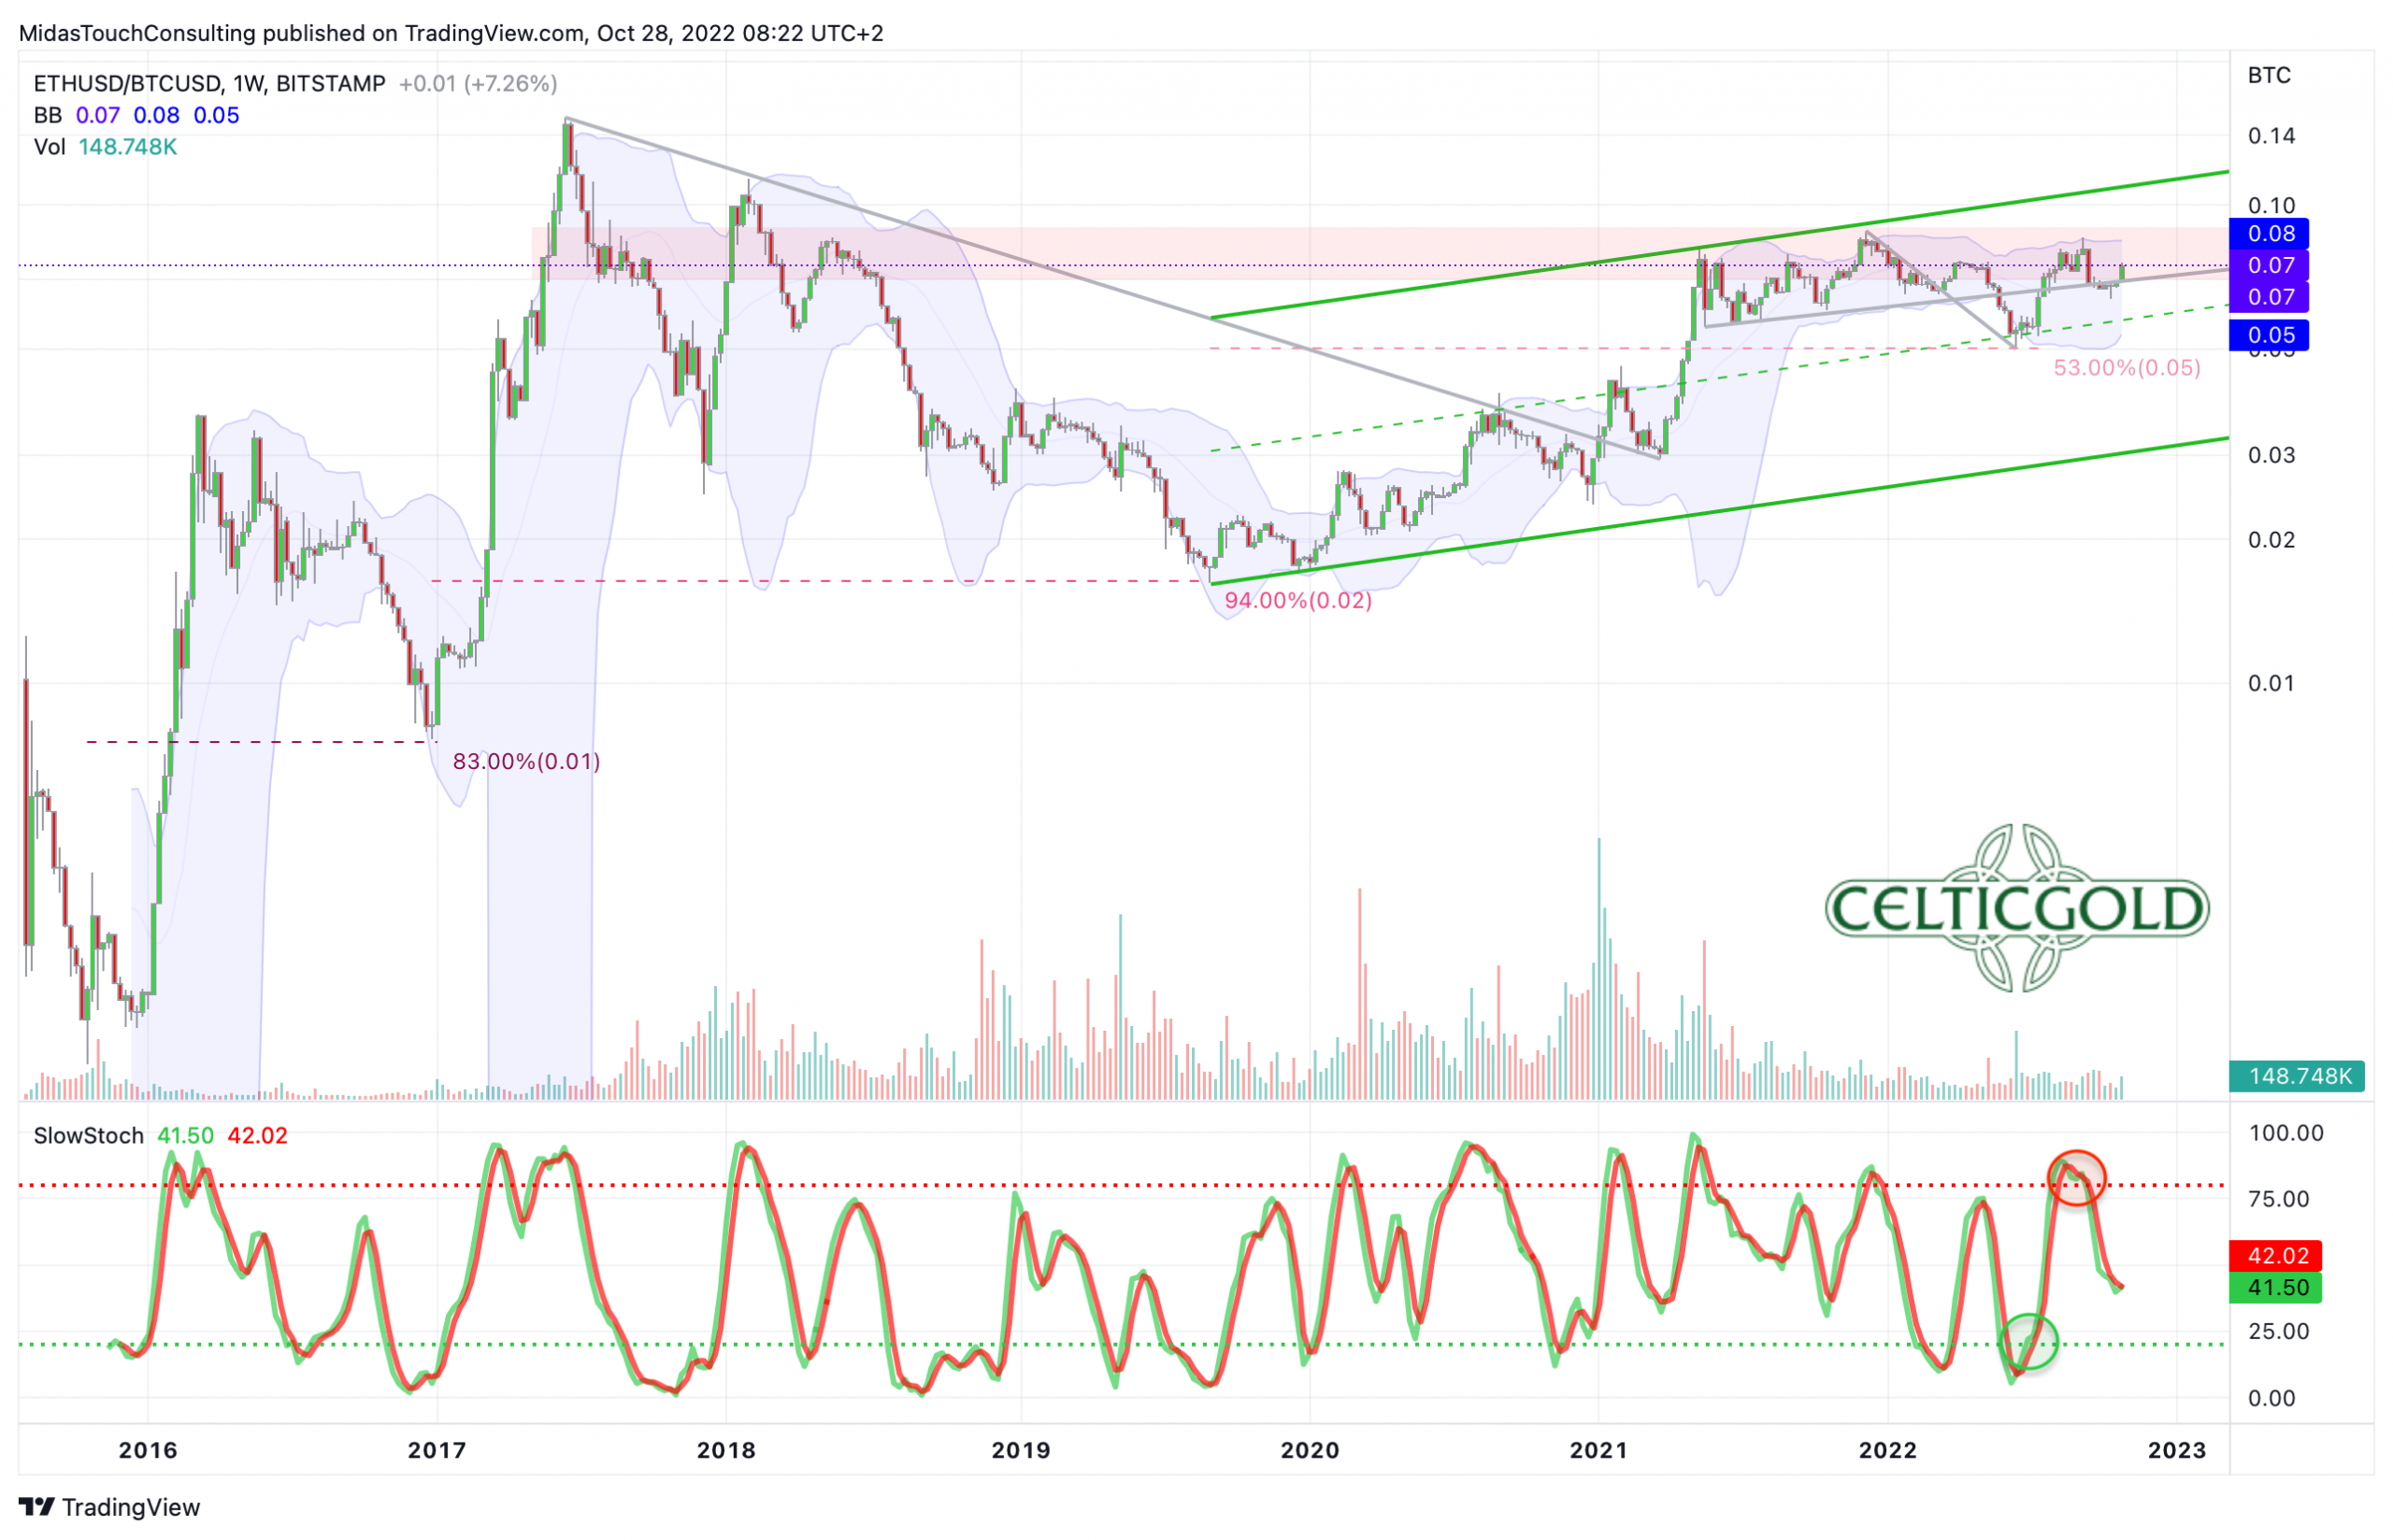
Ethereum/Bitcoin-Ratio, weekly chart as of October 31st, 2022. Source: Tradingview
The fact that Ethereum (ETH) has developed significantly better than Bitcoin since the crash in June is also interesting and positive. Although there is more than justified criticism of the Ethereum network and Bitcoin is still the only one that deserves the title “decentralized”, the market seems to know more. Nevertheless, in terms of market capitalization, Ethereum still lags far behind Bitcoin.
However, the Ethereum/Bitcoin-Ratio makes it clear that Ethereum, which unlike Bitcoin was not designed as a currency and store of value, but for complex smart contracts and decentralized applications, continues to tinker with the breakout against Bitcoin. In fact, due to technological advances, Ethereum now better represents the “blockchain” innovation. And although interest in cryptocurrencies has waned in recent months due to price weakness, Chainanalysis’ Global Index shows that large and long-term crypto investors have held onto their positions.
Technical Analysis For Bitcoin in US-Dollar
Bitcoin Weekly Chart – Still within a clearly defined downtrend channel
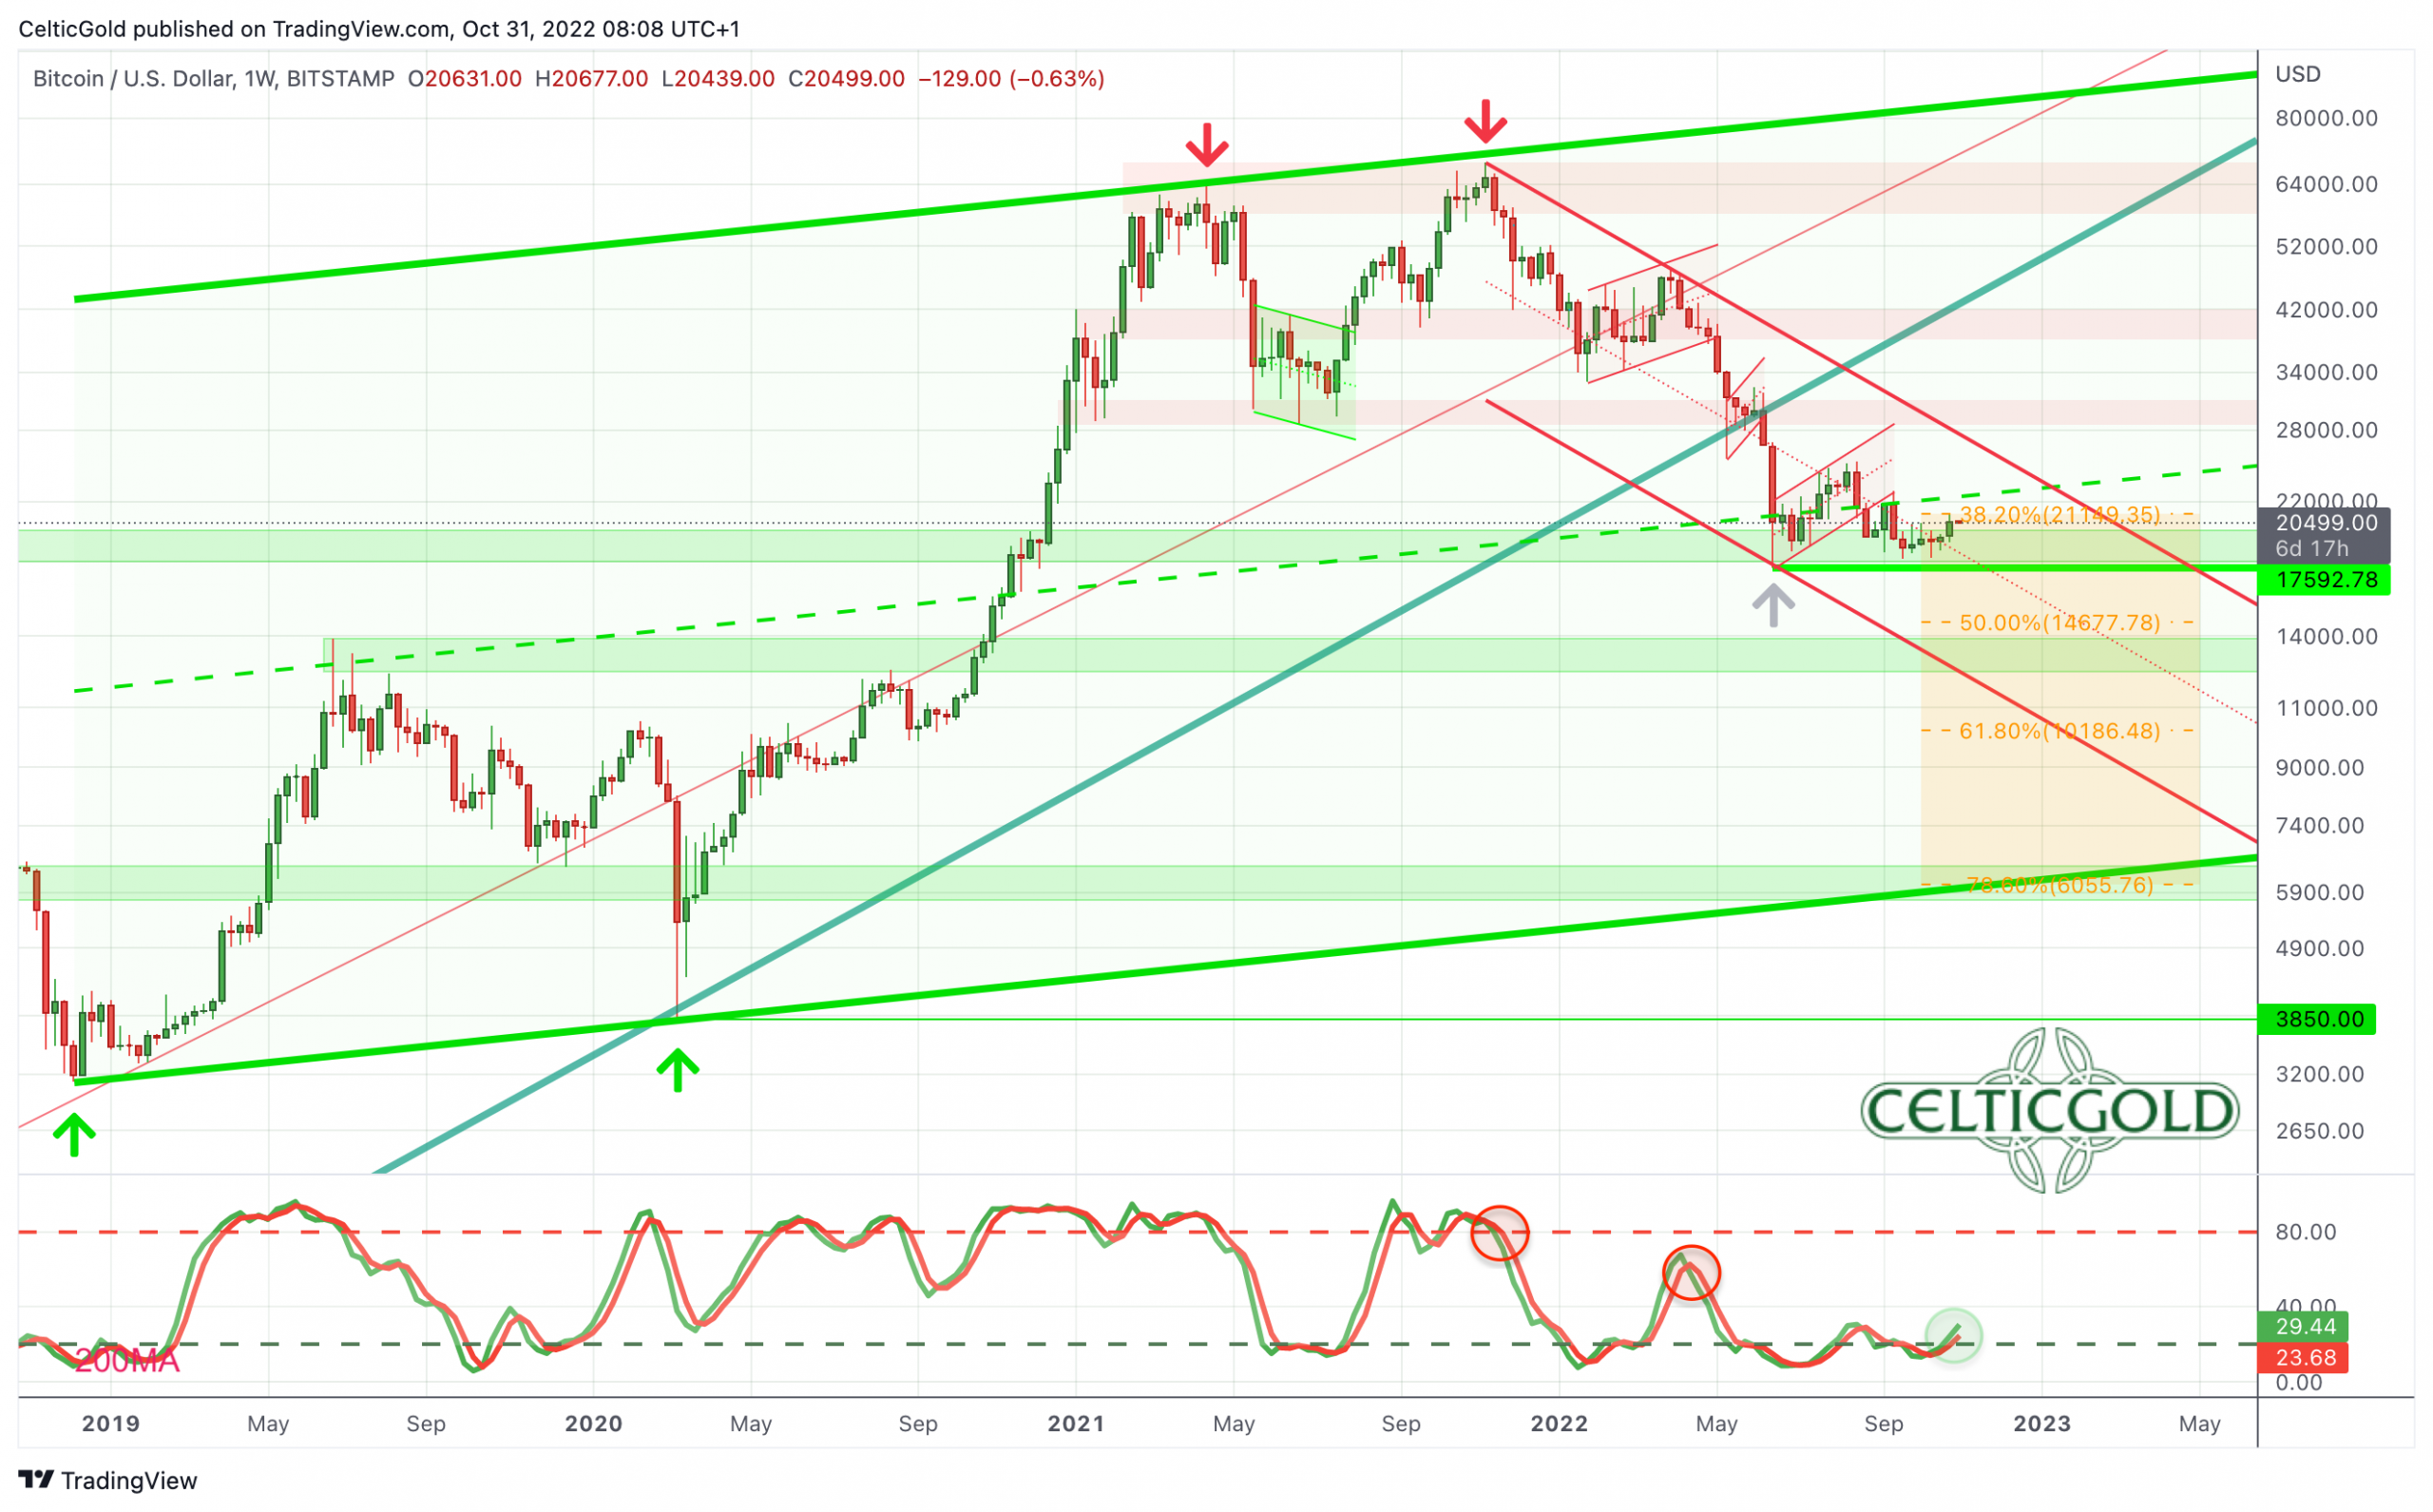
Bitcoin in USD, weekly chart as of October 31st, 2022. Source: Tradingview
In the big picture, Bitcoin is currently trading just below the mid-trend line of its large overriding uptrend channel. Despite the 11-month correction, this trend channel is still intact and would only have to be cast aside with prices below around 6,000 USD.
Since November 2021, however, price action has also been taking place in a clearly defined downtrend channel. Here, Bitcoin is currently trading just above the mid-trend line as well. A recovery within the downtrend channel would currently have room to around 27,500 USD.
Overall, the trend on the weekly chart is still pointing downwards, but the tough sideways phase of the last few months could initially be resolved with a counter-trend recovery or a bounce. The oversold stochastic oscillator would be ideally positioned for this. At the same time, one is well advised not to overestimate any recovery movements. It would be better to wait for evidence that the crypto winter is over, because below 18,000 USD there is still a risk of another price slide of around 30-50% looming.
Bitcoin Daily Chart – Some chance for a recovery
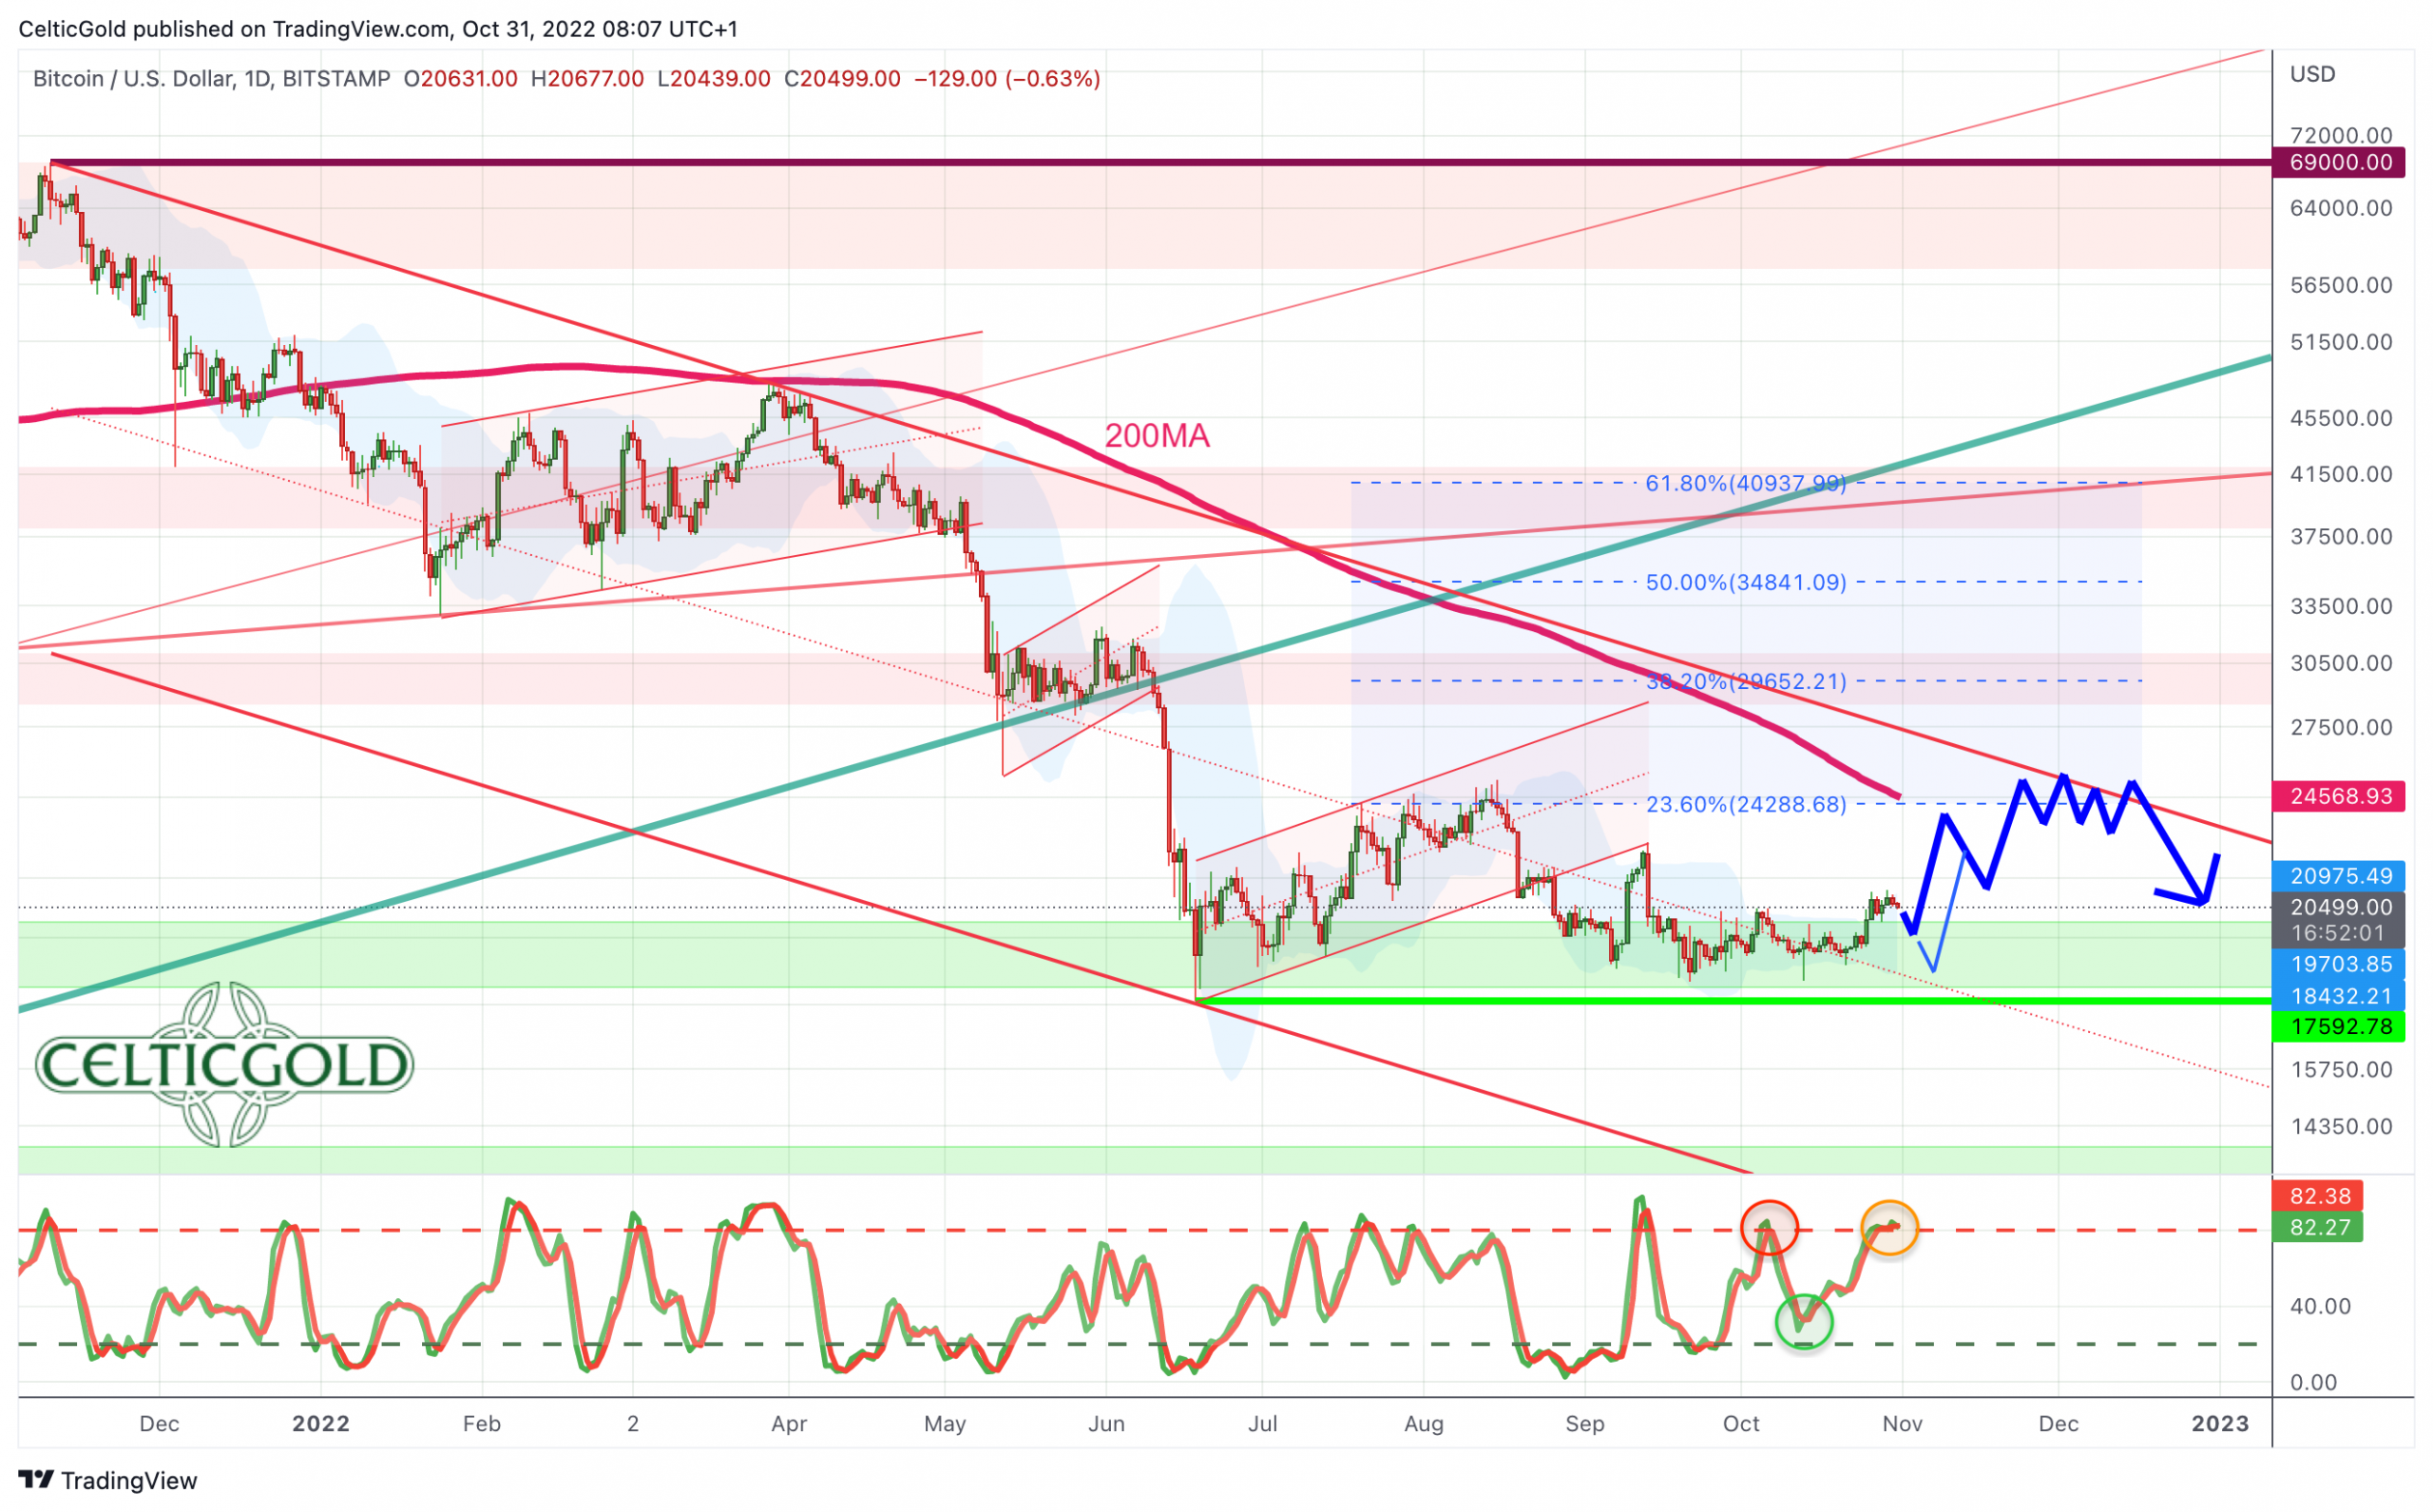
Bitcoin in USD, daily chart as of October 31st, 2022. Source: Tradingview
On the daily chart, the broad support zone between 18,000 and 20,000 USD has held for the past few weeks. Bitcoin bulls are currently trying to break out to the upside. A first attempt failed on Wednesday, but the upper Bollinger band (20,987 USD) has been bent upwards. This gradually creates more space to the upside.
The first target of a recovery would be the rapidly falling 200-day moving average (24,569 USD) and would actually be overdue. As well, a rally towards the upper edge of the downtrend channel around 25,000 to 26,000 USD seems possible. However, the stochastic has already reached its overbought zone again. In this respect, it looks more like a tough challenge for the bulls to advance directly. A pullback towards crucial support around 20,000 USD before another rally attempt is therefore likely.
In summary, the chance for a slightly larger recovery is on the chart. However, prices well above 25,000 USD currently appear rather unrealistic. Nevertheless, if the US dollar actually corrects a little more, Bitcoin and the crypto sector would get a boost.
Sentiment Bitcoin – Fear has been the norm since the beginning of the year
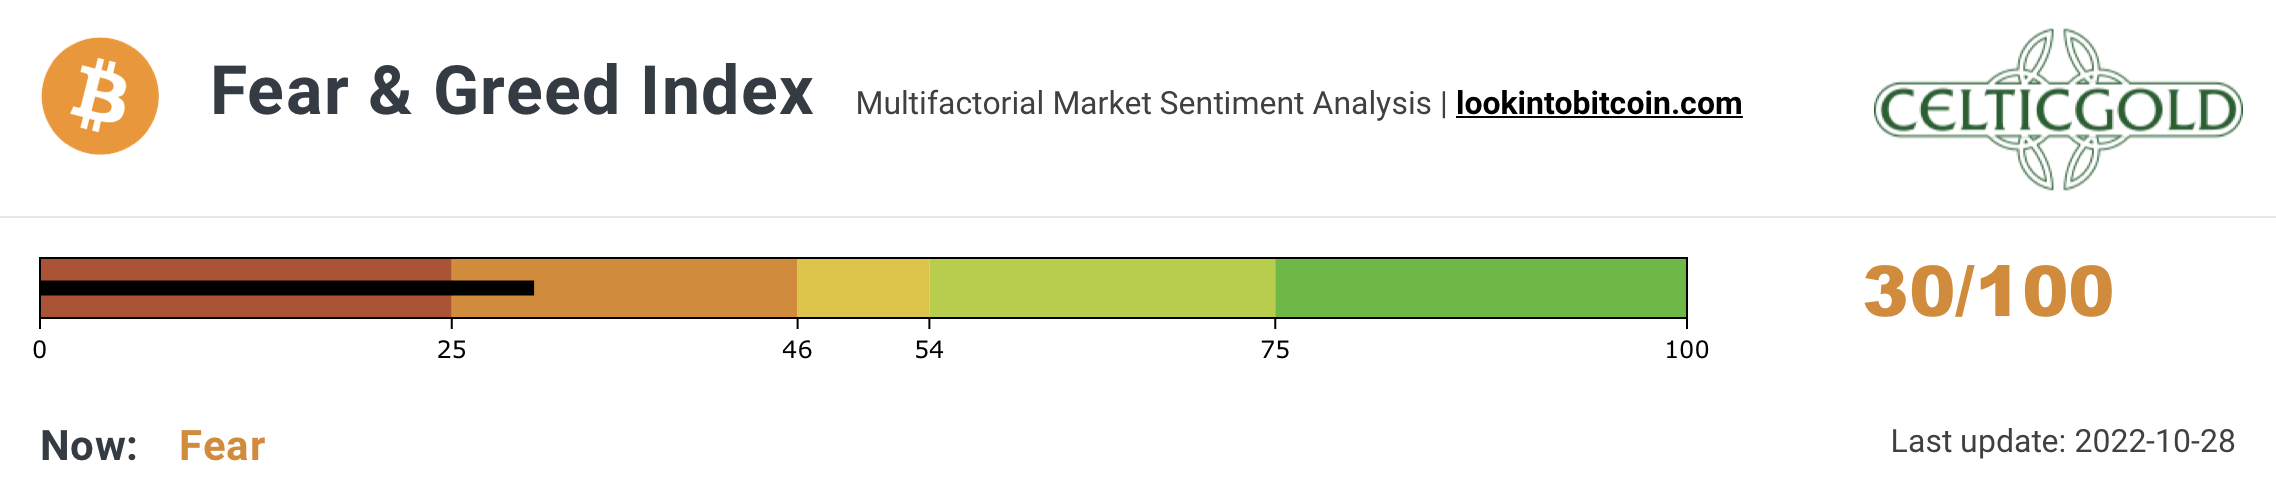
Crypto Fear & Greed Index, as of October 28th, 2022. Source: Lookintobitcoin
The Crypto Fear & Greed Index is currently sitting at 31 and continues to measure high levels of fear in the crypto sector. This has become the norm since the price collapse at the beginning of the year.
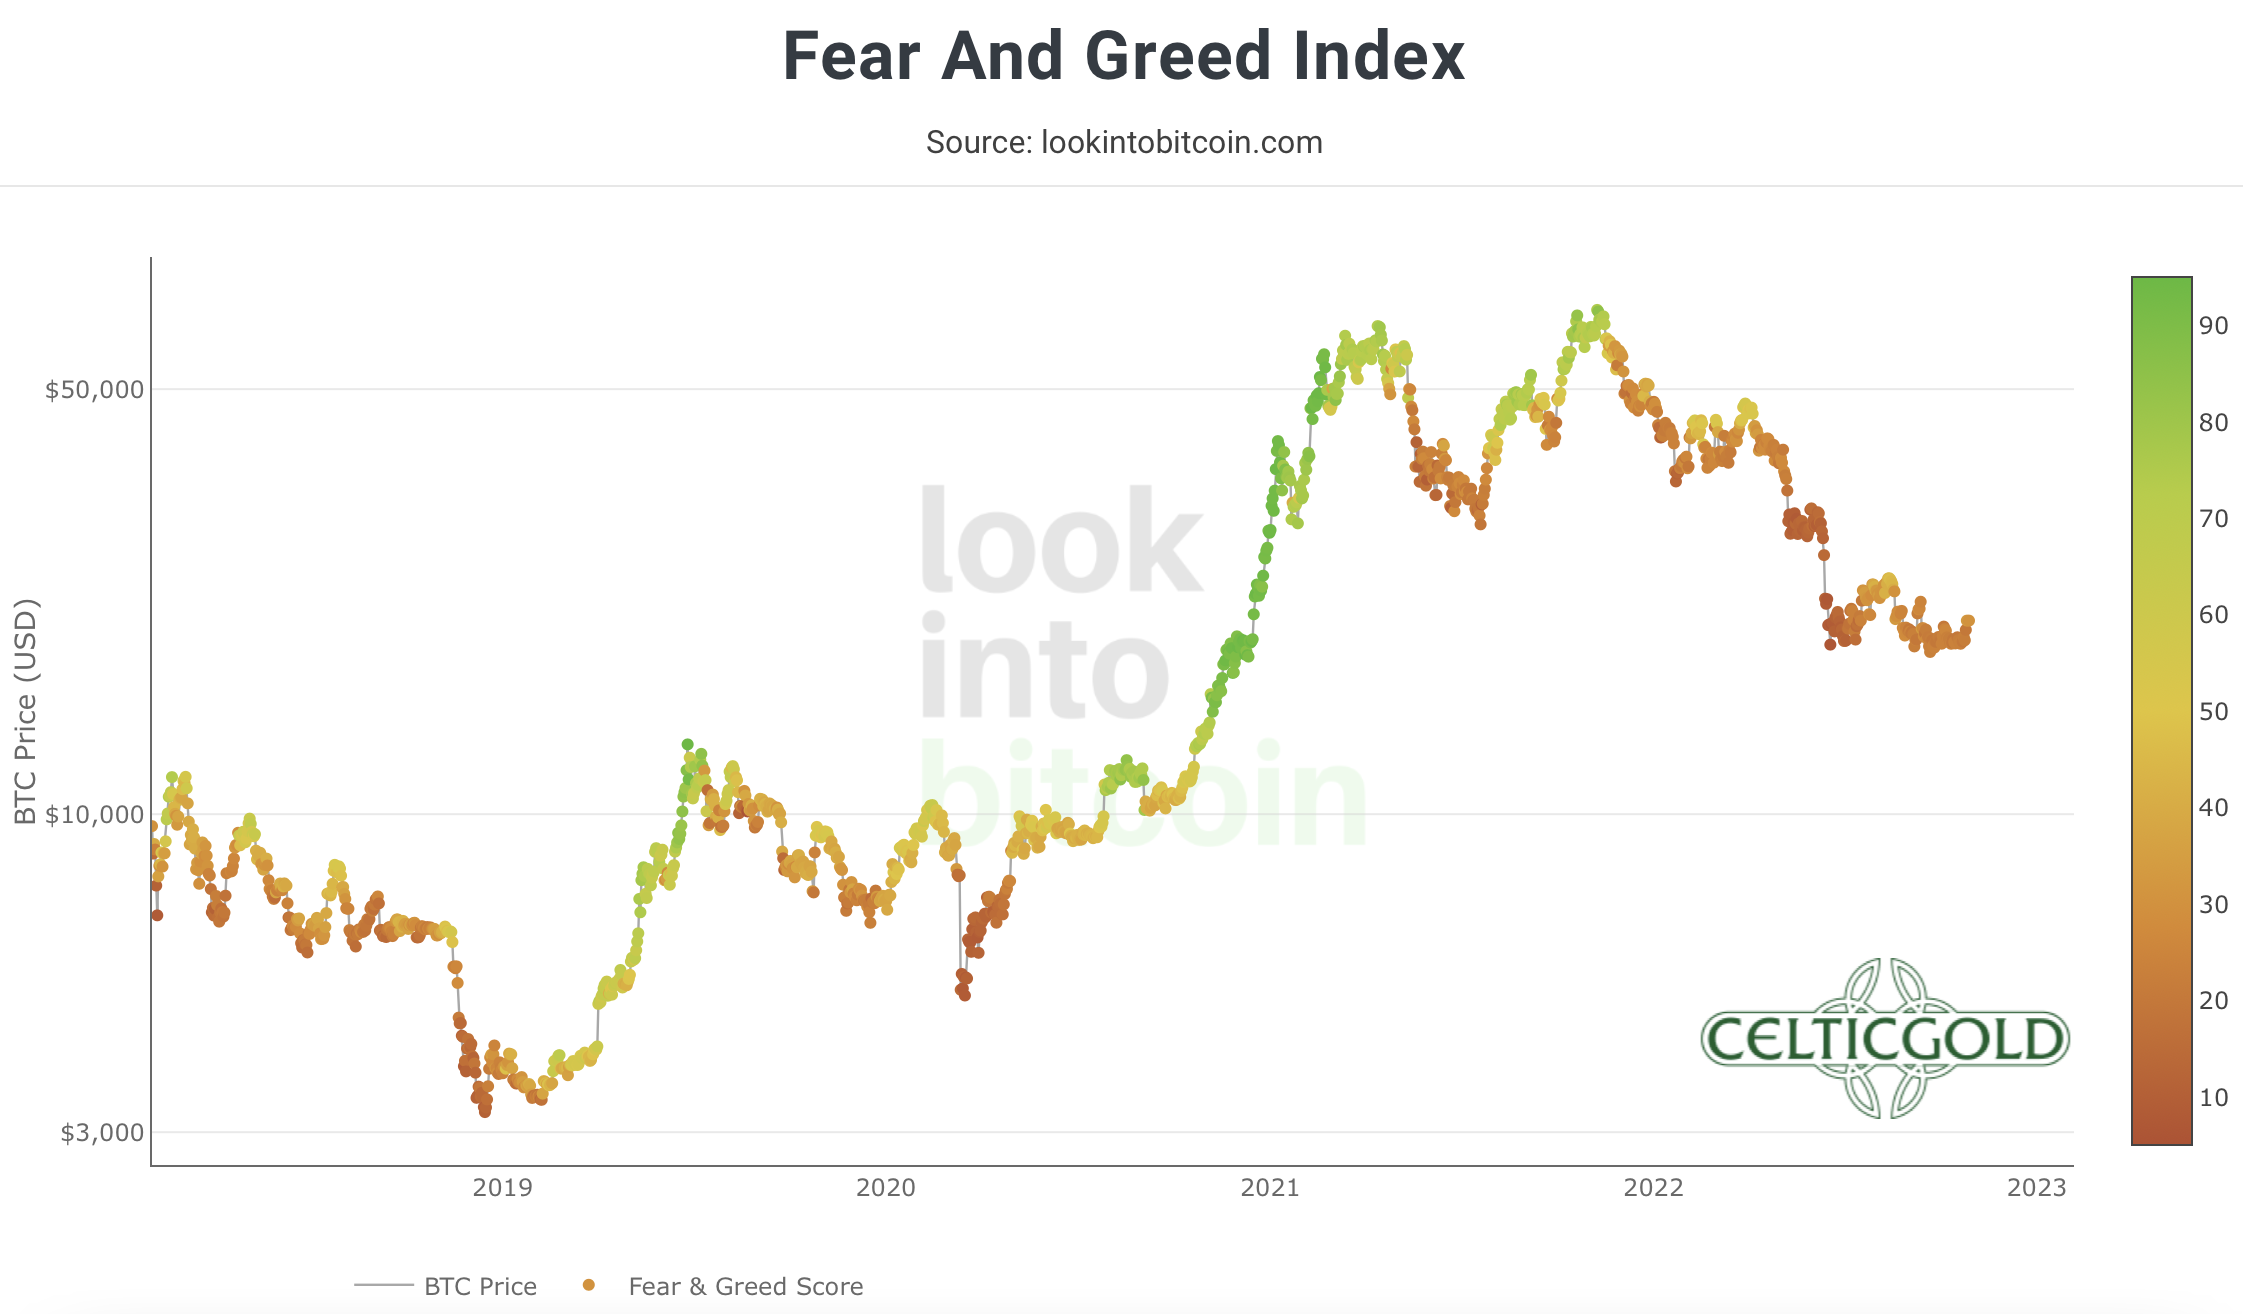
Crypto Fear & Greed Index long term, as of October 28th, 2022. Source: Lookintobitcoin
In the big picture, however, the bombed-out sentiment also provides a contrarian opportunity.
Seasonality Bitcoin – Strong 4th quarter
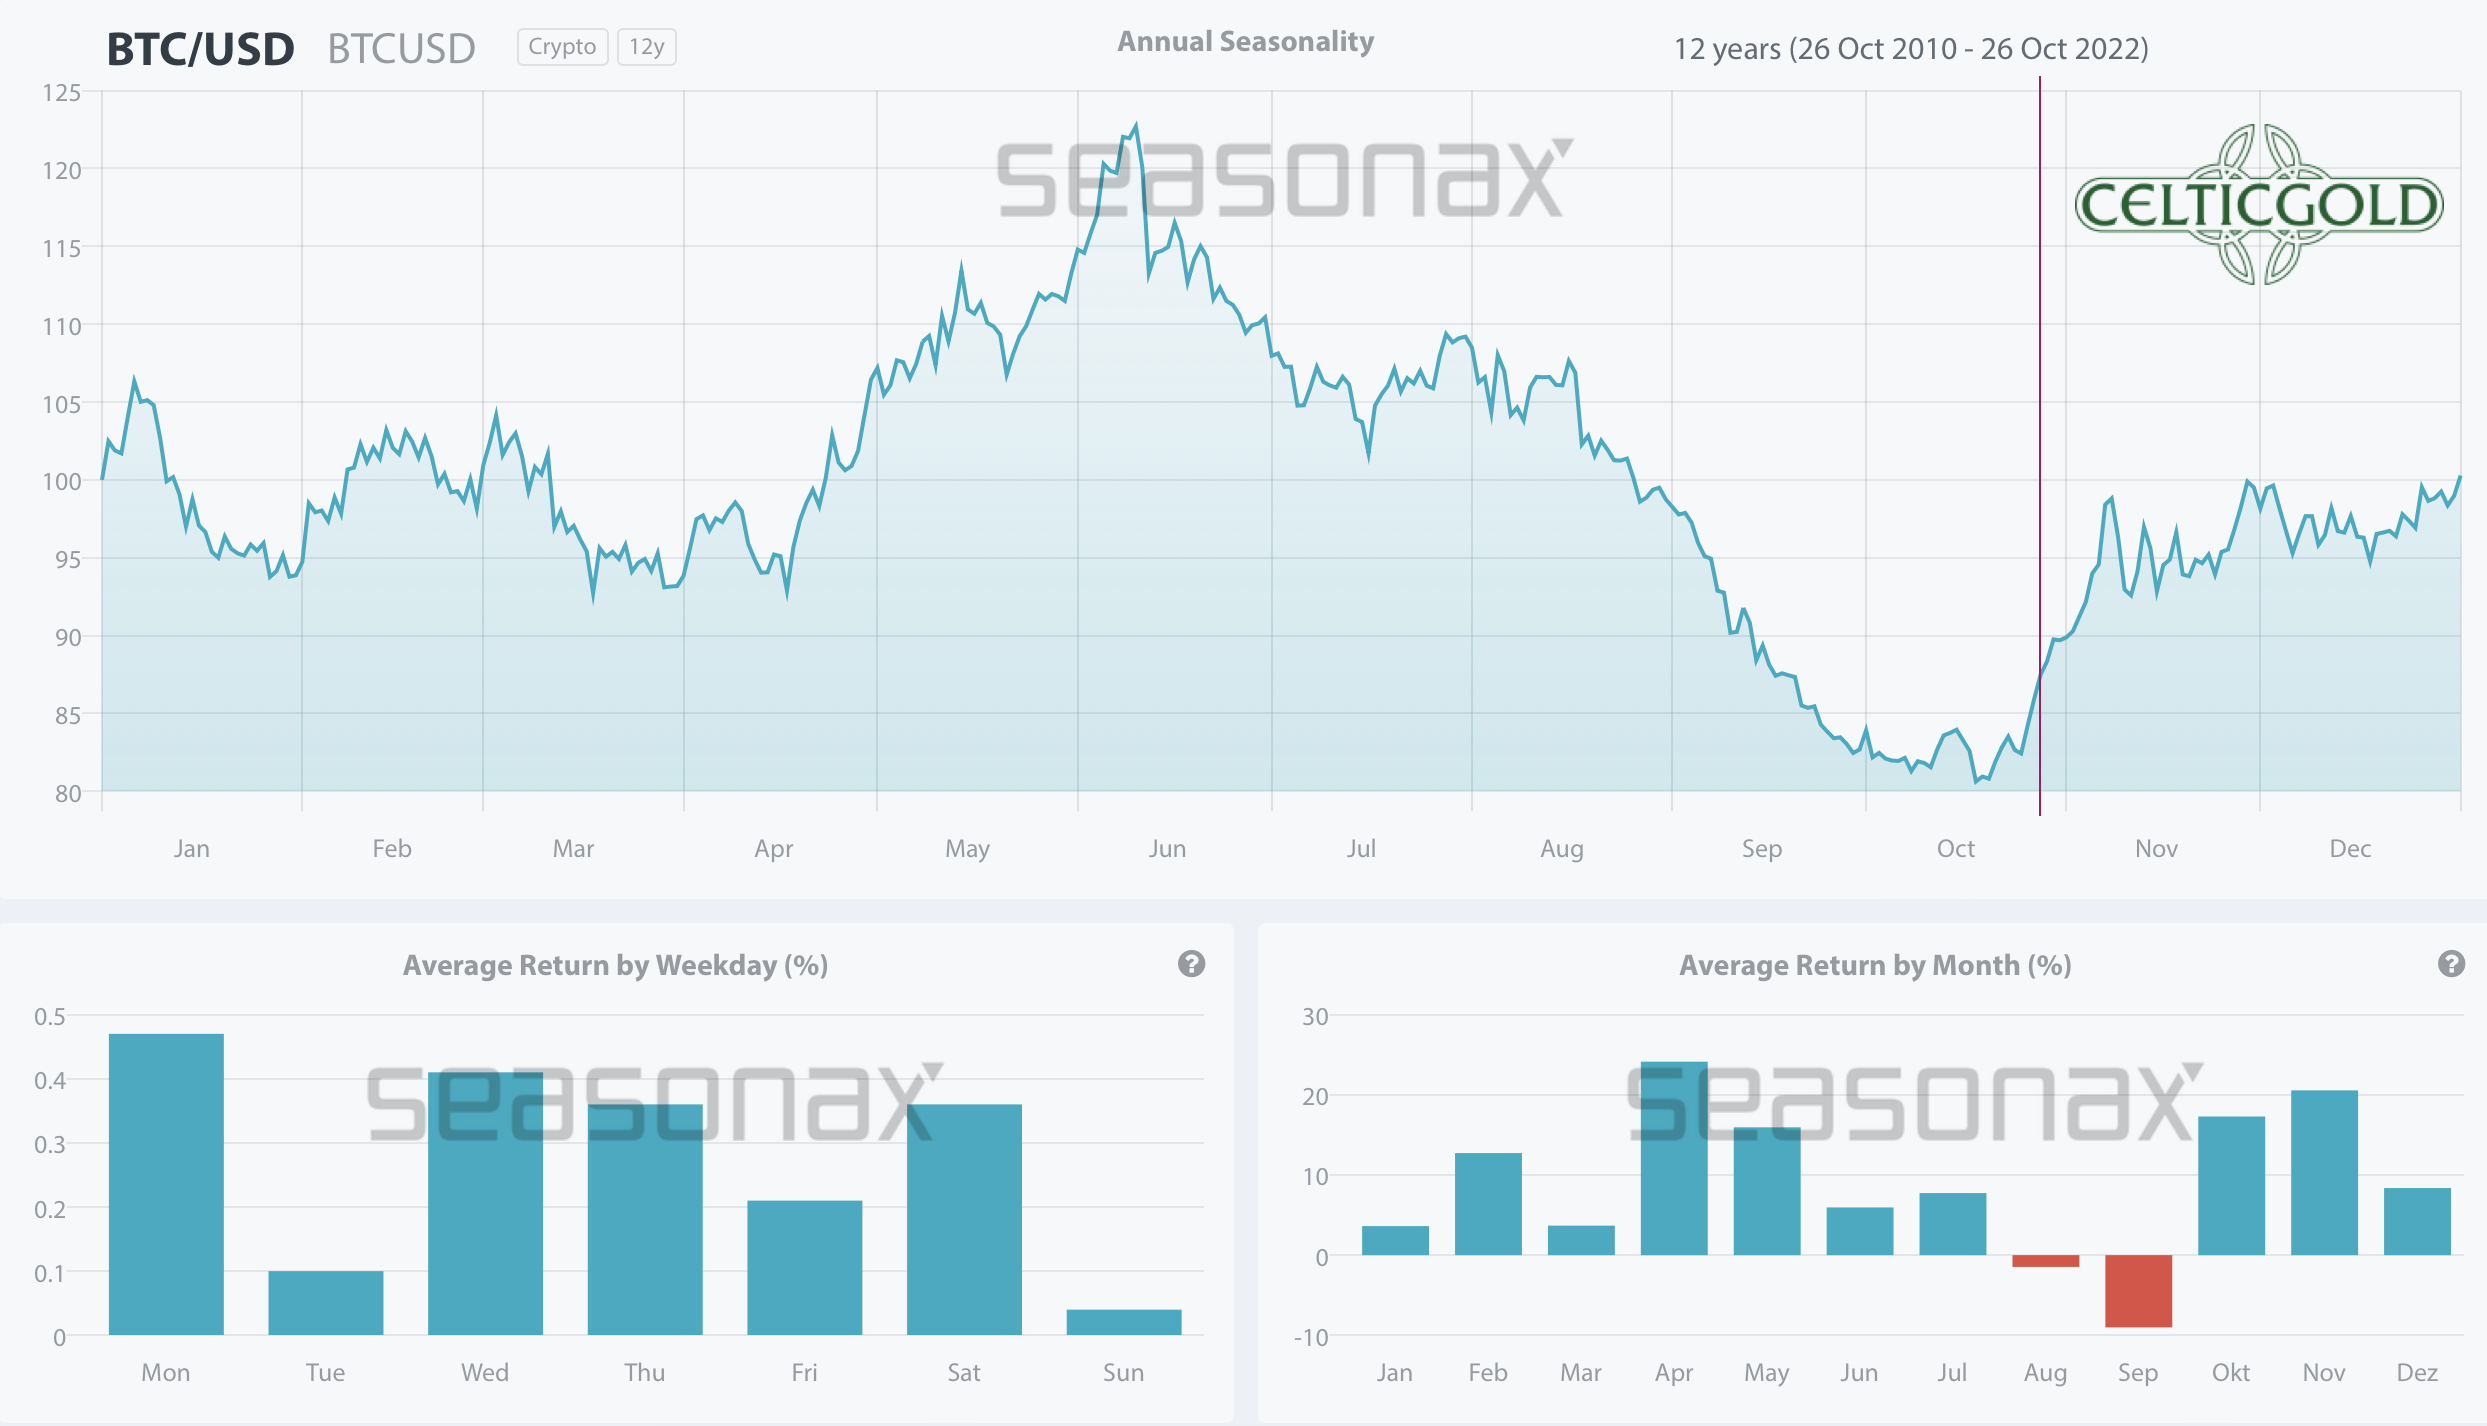
Seasonality for bitcoin, as of October 28th, 2022. Source: Seasonax
Statistically, Bitcoin had a strong 4th quarter over the past 12 years. Of course, seasonal statistics cannot guarantee future price movements.
Nevertheless, the probability of a recovery towards the end of the year is significantly higher from a seasonal perspective.
Sound Money: Bitcoin vs. Gold
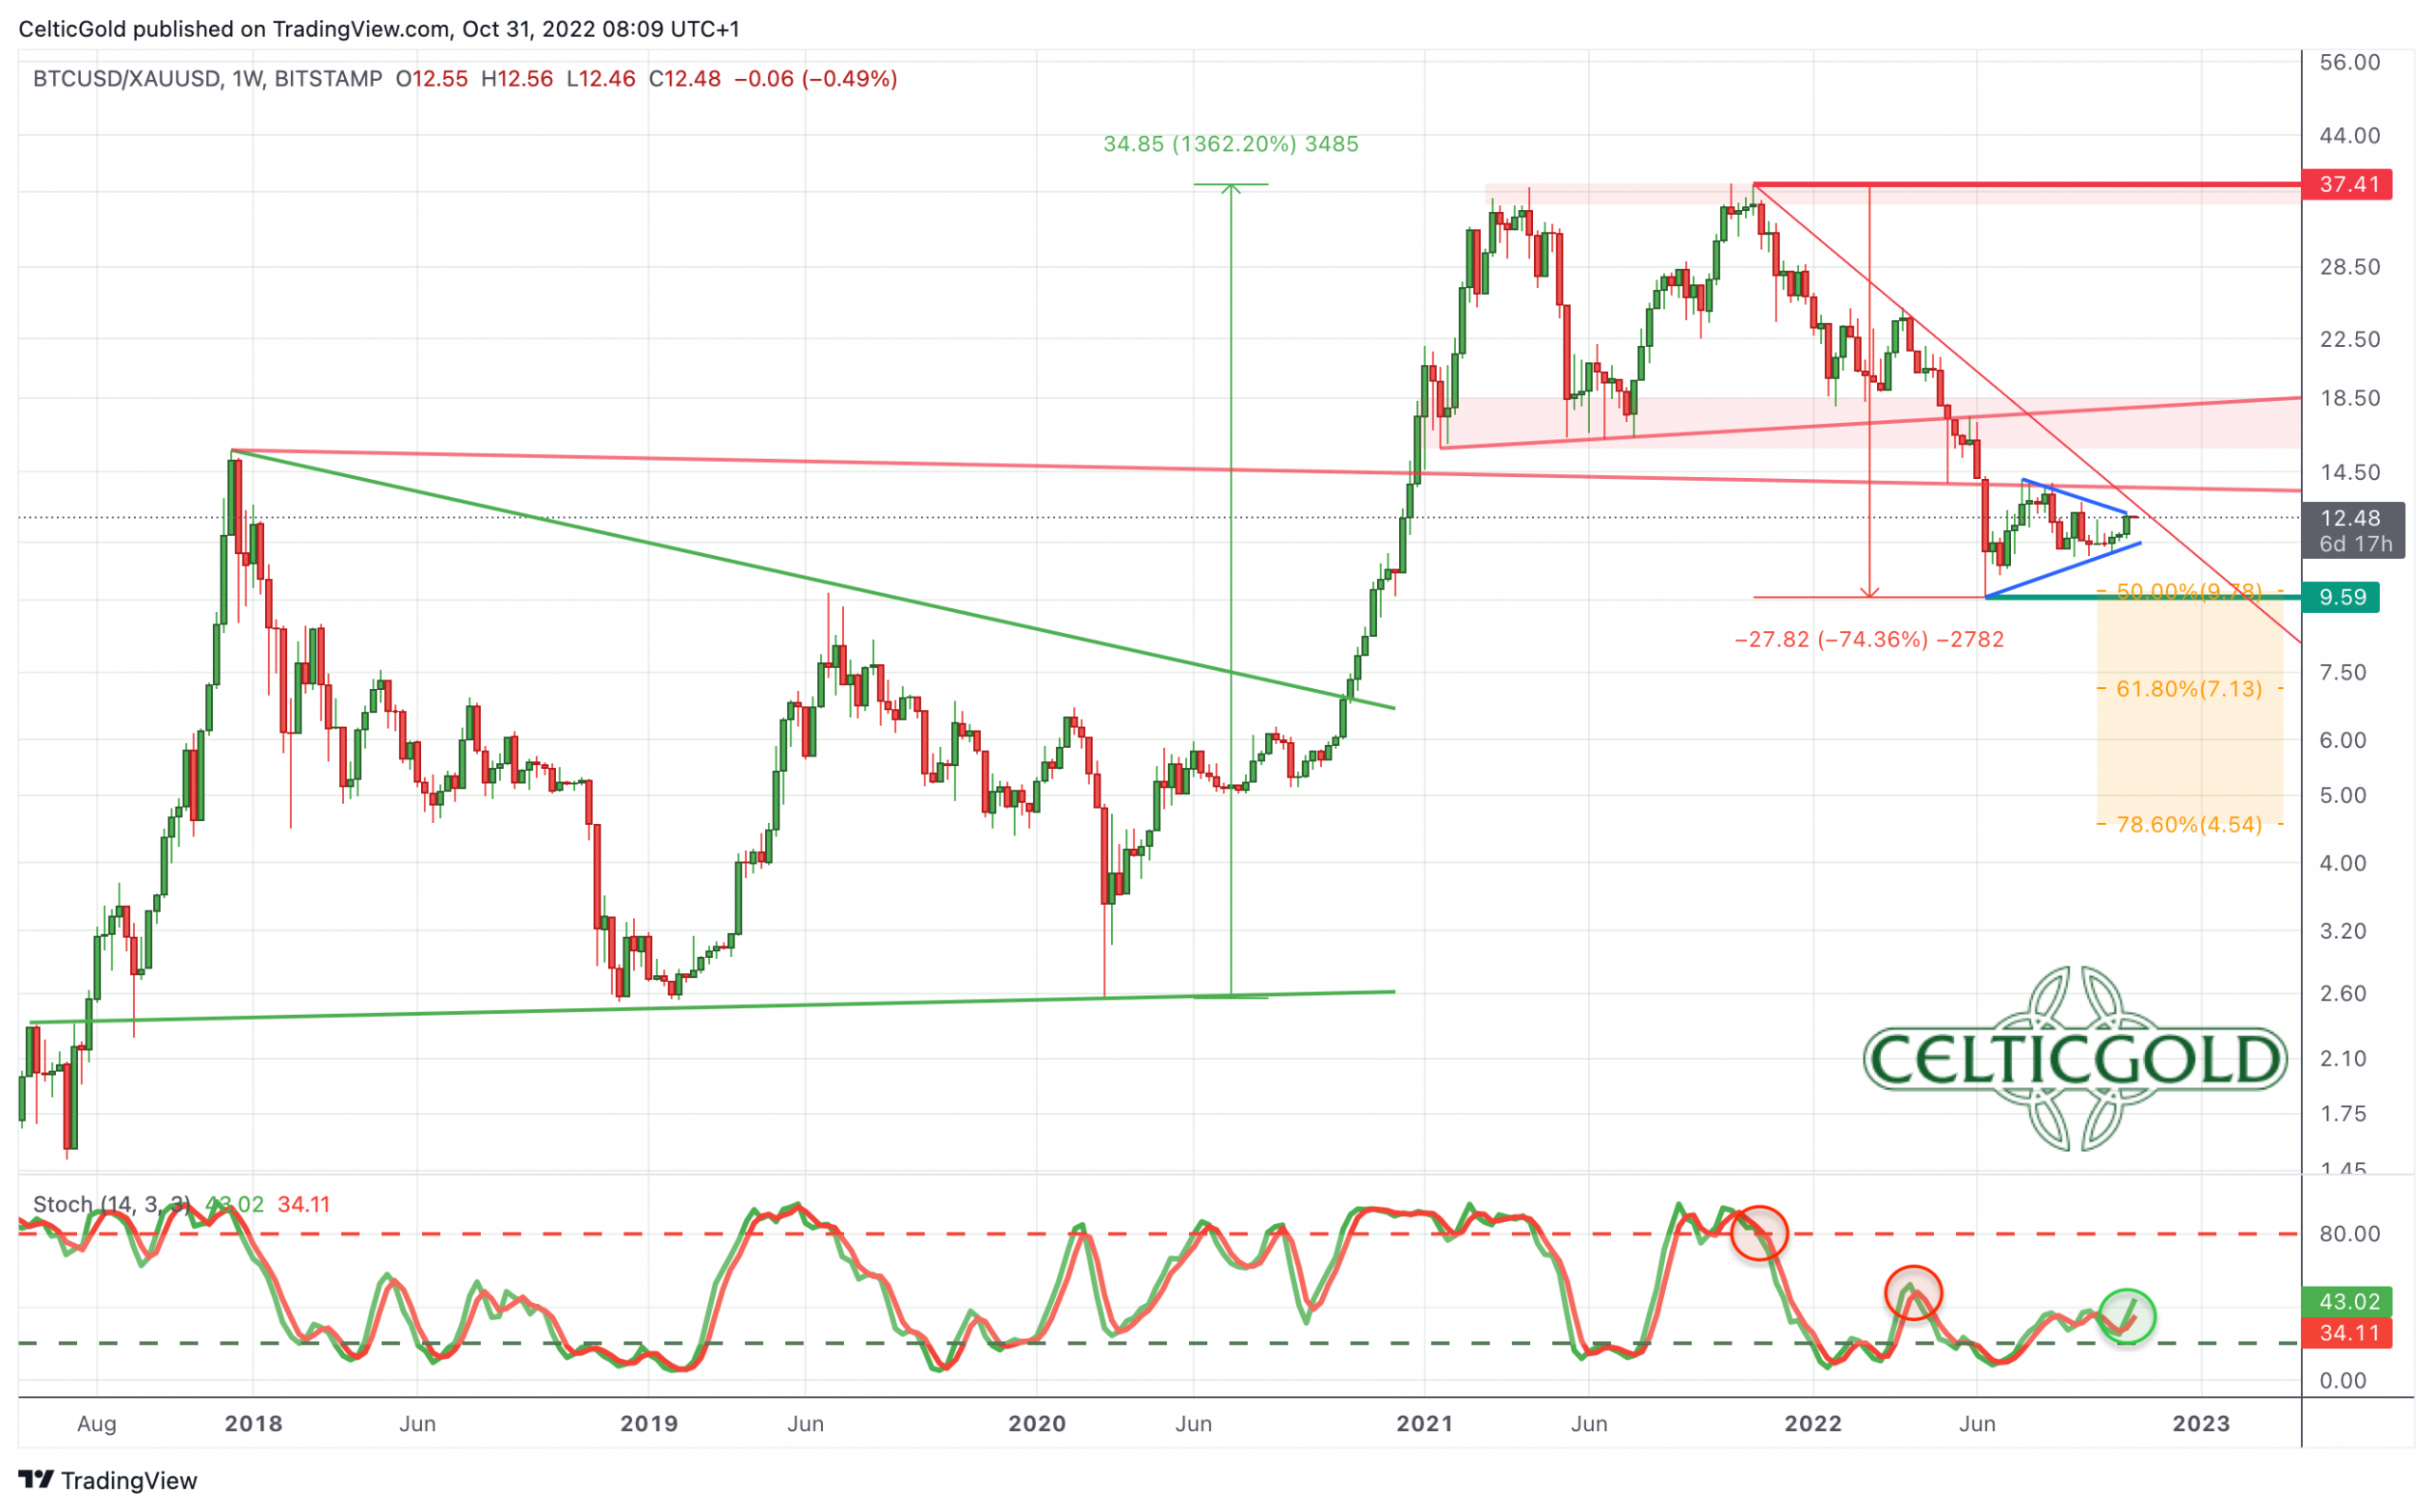
Bitcoin/Gold-Ratio, weekly chart as of October 31st, 2022. Source: Tradingview
At current prices of around 20,500 USD for one bitcoin and around 1,640 USD for one ounce of gold, you have to pay 12.5 ounces of gold for one bitcoin. In other words, an ounce of gold currently costs 0.08 Bitcoin. Just like Bitcoin prices, the Bitcoin/Gold-Ratio has been running sideways for a good four and a half months. A recovery in favor of bitcoin has not yet succeeded. The overarching trend is therefore pointing further south, and the Bitcoin/Gold-Ratio would have to rise above 14 at least to clearly and sustainably break the downtrend.
In summary, the Bitcoin/Gold-Ratio remains in a downtrend, and continues to consolidate the last major slide in prices with a sideways chop.
Macro Update – A breather until the congressional elections
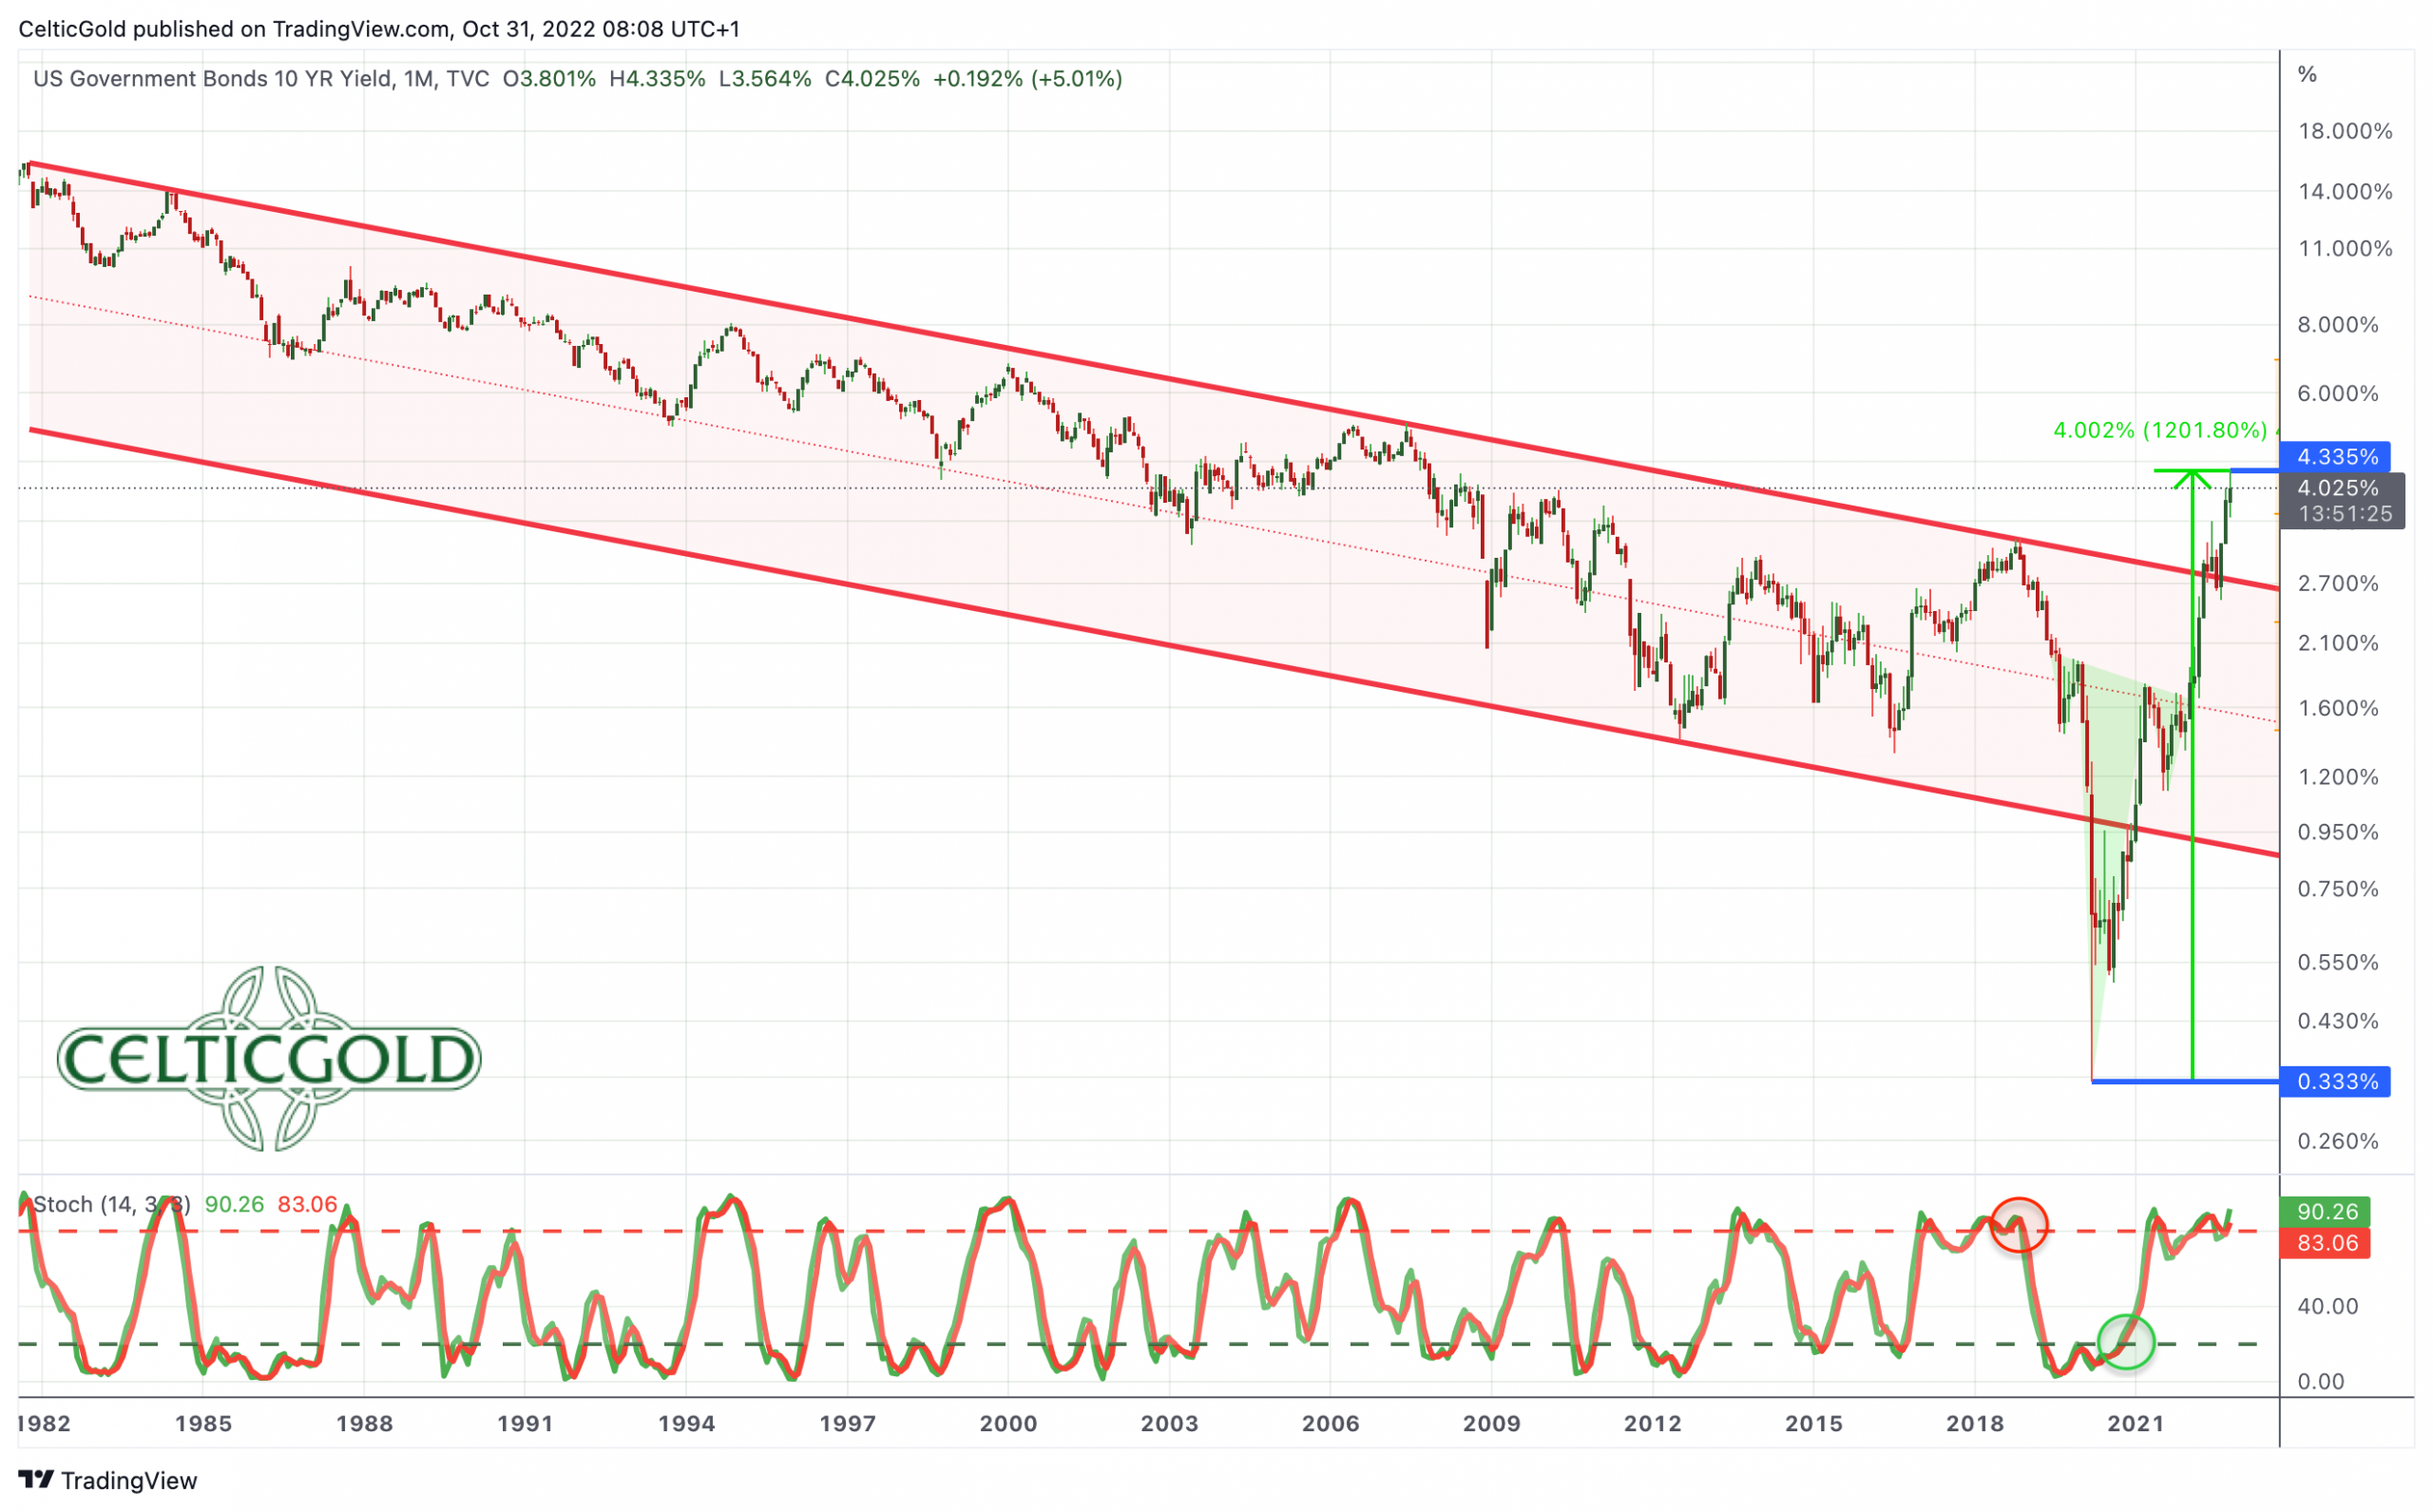
US Treasury 10-year bond, monthly chart as of October 31st, 2022. Source: Tradingview
The 10-year US Treasury bond yields rose further over the past four weeks, reaching 4.33% before falling back to 3.97% in the last few trading days.
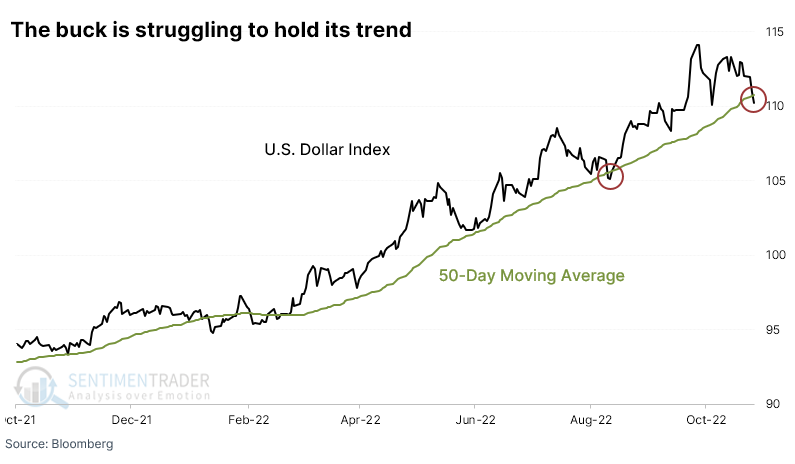
US Dollar Index as of October 27th, 2022. Source: Sentimenttrader
For the first time since the beginning of the year, the US Dollar also seems to be faltering, as the greenback fell below its 50-day moving average for the first time. Both, the constellation in the futures markets and the sentiment actually speak for a correction in the US Dollar.
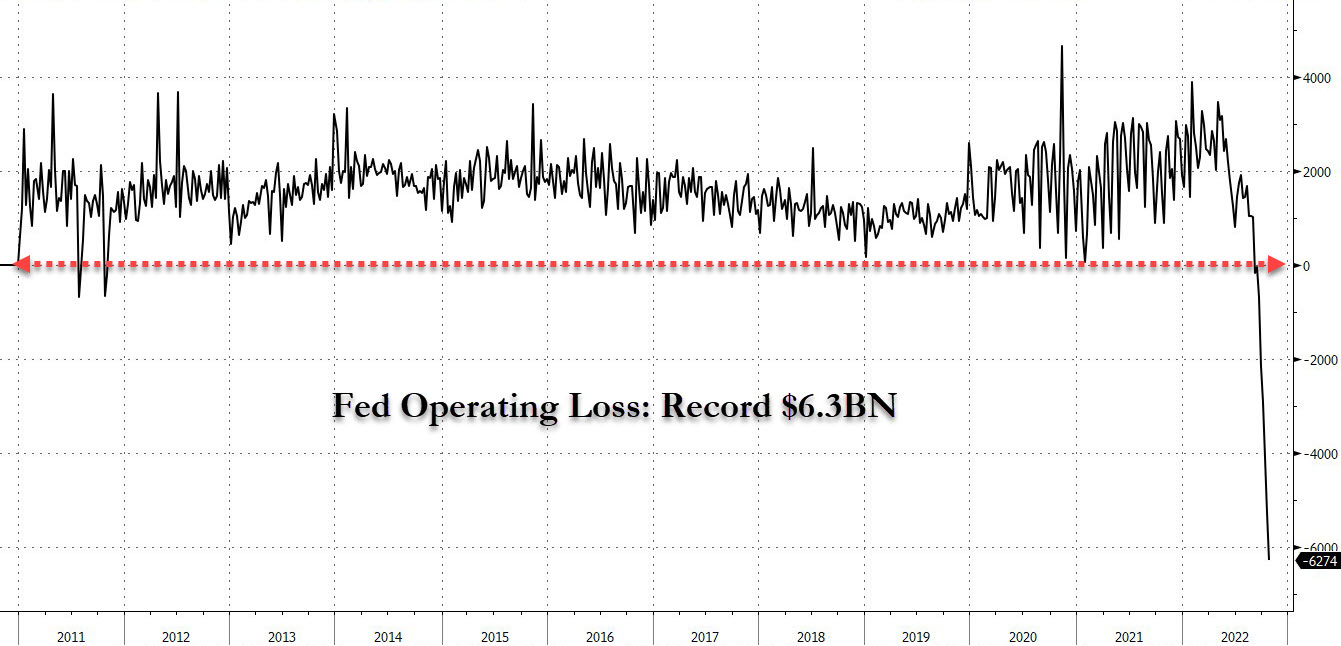
Federal Reserve Bank Operating Profit or Loss, as of October 28th, 2022. © ZeroHedge
At the same time, the significantly higher interest rates are costing the American central bank a lot of money, because the Fed has to pay over half a billion USD in interest to American and foreign banks every day. The Fed’s operating loss rose to a record 6.3 billion USD last week!
Overall, the two major stress factors in financial markets (rising interest rates and a strong US dollar) have calmed down somewhat recently. Signs of a major recovery in the stock markets immediately materialized, but so far this has not been very sustainable for other market sectors. Bitcoin was also able to shoot up to 21,000 USD for a short time. Nevertheless, the situation remains tense and the corrective movement in the US Dollar, which is actually overdue, has not yet been confirmed.
However, a recovery around the US congressional elections on November 8th would be overdue in all sectors. It could even turn into a year-end rally. Due to the fragile overall situation, the FED could at least soften its tone a little in this week’s FOMC announcement and thus further fuel a relief rally. Nevertheless, it is still far too early to call the end of the bear market in financial markets.
Conclusion: Bitcoin – Some chance for a recovery
At 20,500 USD, Bitcoin is currently trading around 70% below its all-time high. The last 11 months have been characterized by a brutal downturn, and so far there are no signs of a change in trend. On the contrary, in view of the desolate macro situation, the correction in the crypto sector could be significantly longer, especially in terms of time. Nevertheless, two months before year-end there is at least some chance for a (small) recovery towards around 25,000 USD. Hence, a new attack on the support at around 18,000 USD would not be expected until 2023.
Analysis sponsored and initially published on October 28th, 2022, by www.celticgold.eu. Translated into English and partially updated on October 31st, 2022.
Feel free to join us in our free Telegram channel for daily real time data and a great community. If you like to get regular updates on our gold model, precious metals, commodities, and cryptocurrencies, you can also subscribe to our free newsletter.
Disclosure:
This article and the content are for informational purposes only and do not contain investment advice or recommendations. Every investment and trading move involves risk, and readers should conduct their own research when making a decision. The views, thoughts, and opinions expressed here are the author’s alone. They do not necessarily reflect or represent the views and opinions of Midas Touch Consulting.

