


Gold – Breaking Out Towards US$1,800 And US$1,900
Gold closed the week at US$1,770 almost US$20 higher than at the closing price on June 19th. The bulls not only pushed prices to a new eight-year high at US$1,780 but have once again responded with great strength to a bearish attack on Friday. Every dip, no matter how small, is bought immediately. Gold – Breaking Out Towards US$1,800 And US$1,900.
Review
Since their highs at US$1,747 and US$164.42, spot Gold price and the SPDR Gold Trust ETF (GLD) have been consolidating sideways for two months. During this period, bulls and bears were regularly taken for a ride, as there was a new high at US$1,765 as well as repeated pullbacks well below US$1,700.
All in all, however, the gold market has never lost its bullish tone despite the tenacious confusion. Time and again the bulls were able to quickly recover and reclaim lost ground. Therefore, in the last four weeks I have gradually completely abandoned my rather skeptical stance, which I had been taking since the end of February. I am now fully focused again on the opportunities on the upper side.
The last pullback catapulted gold to new to a new eight-year high
Most recently the price of gold slipped back down to US$1,670 on June 5th. However, here too, a strong countermovement up to US$1,745 quickly followed. And the subsequent pullback already ended above the psychological mark at US$1,704. Since then the price of gold has risen considerably and reached a new 8-year high at almost US$1,780 on Wednesday June 24th.
However, the bulls have not (yet) been able to maintain this level in the last few days, but prices closed the trading-week only slightly lower at USD 1,770. The breakout above the resistance zone at US$1,750-1,765 has thus been more for less accomplished and the end of the ten-week consolidation is probably sealed. Prices around US$1,800 are within reach.
Technical Analysis: Gold in US Dollars
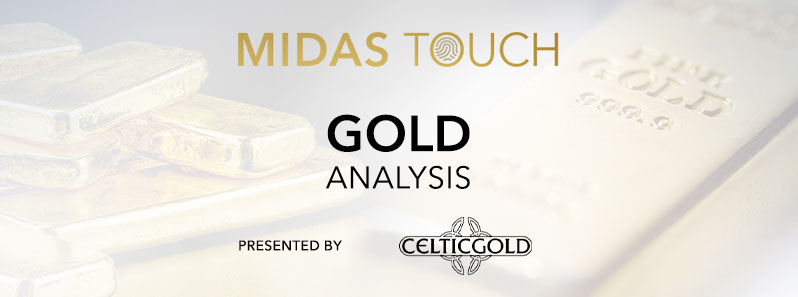
Gold in US dollars, weekly chart as of June 26th, 2020. Source: Tradingview
Since December 2015 the big picture in the gold market is based on a bullish trend. According to the dark green uptrend channel in place since December 2015, the bears would need to push gold back towards and below US$1,300 to change the overall bullish trend!
And despite the recent multi-week consolidation, the bulls were effortlessly able to hold prices above the light green uptrend channel that began in August 2018. Together with the new eight-year high at US$ 1,780, the door to higher prices is now wide open. The first immediate price target is the zone around US$1,800. The bulls failed at this round mark three times in 2012 and 2013. The round psychological mark should therefore not be underestimated as potential resistance.
Gold – Breaking Out Towards US$1,800 And US$1,900
Even more important, however, is the all-time high around US$1,920. With a very high probability, prices will be magnetically attracted by the round number of US$1,900 as an overriding price target. However, a direct breakout above US$1,900/1,920 is not likely. Rather, larger profit taking is to be expected at this level. Despite the overbought situation on the weekly chart, the bulls could thus continue to fight their way up to around $1,900 before a larger and healthy pullback could occur in the gold market towards the fall.
All in all, the gold price seems to have moved out of the week-long sideways range. The weekly closing above US$1,750/1,765 confirms this. The next two price targets are thus activated at US$1,800 and around US$1,900. In terms of timing, the US$1,900 mark should be reached in the next one to two and a half months.
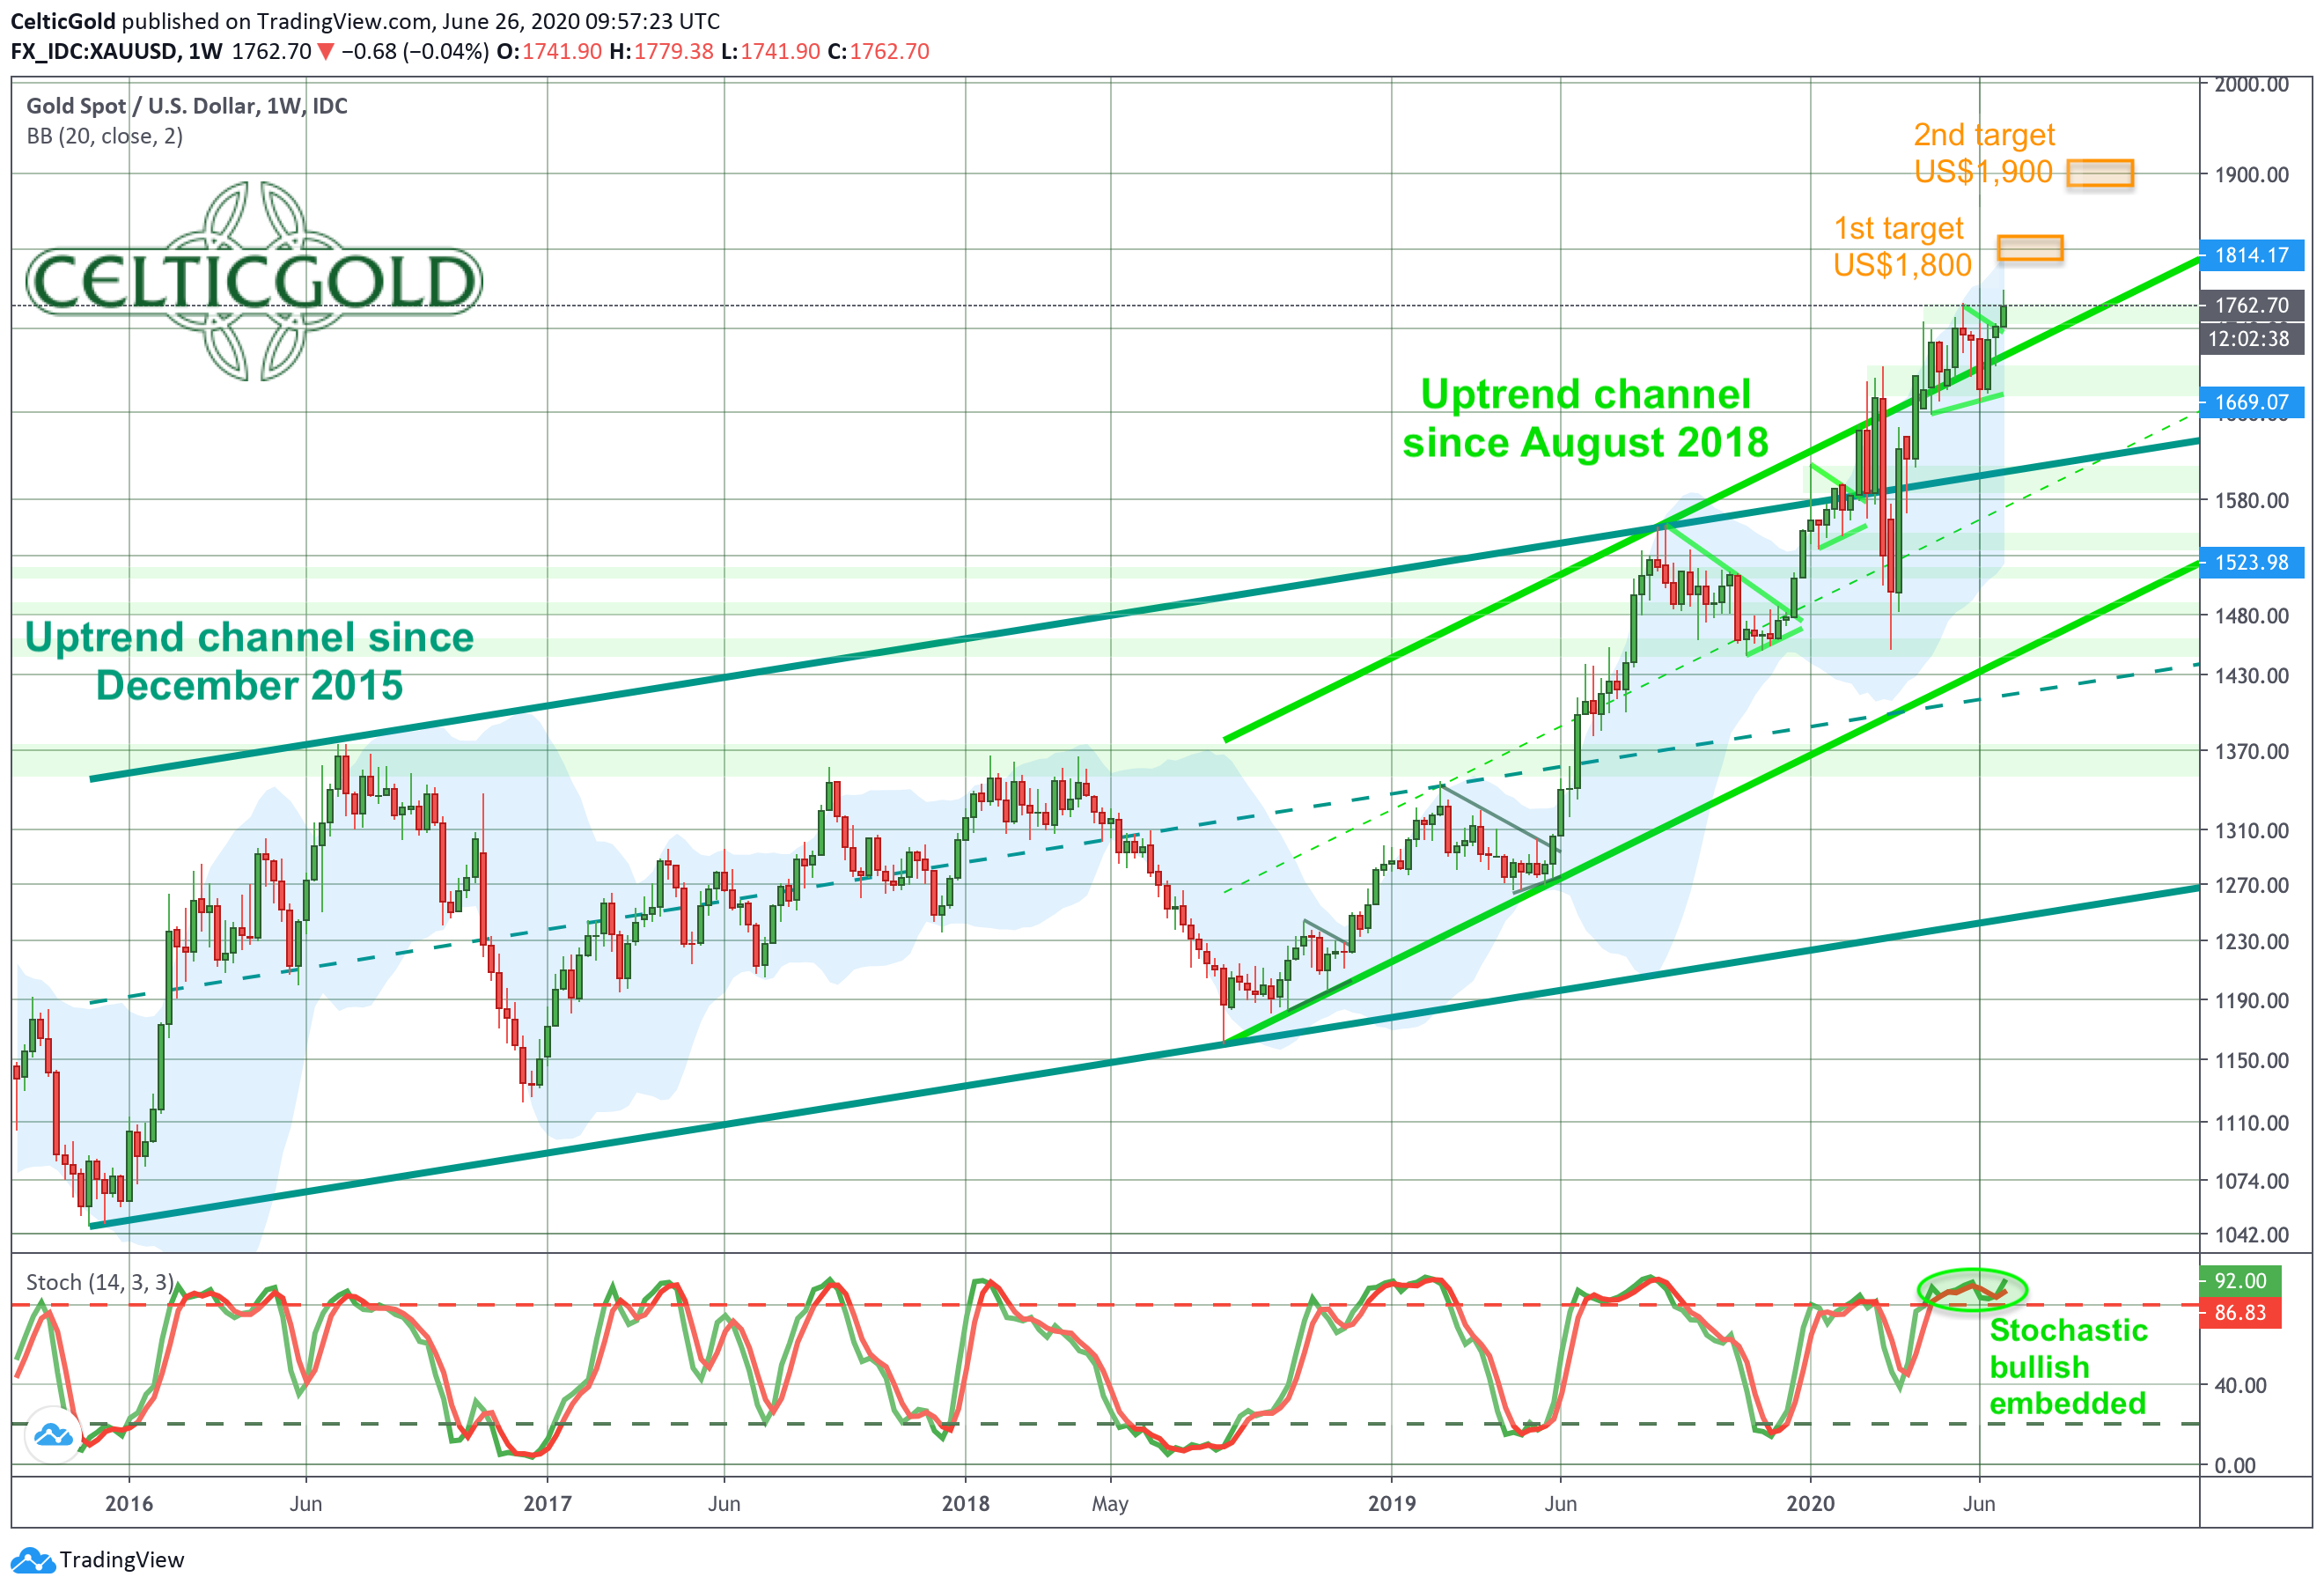
Gold in US dollars, daily chart as of June 26th, 2020. Source: Tradingview
On the daily chart, the bulls began the last week by bending up the sideways running Bollinger Band. Ideally, they will continue this process in the coming week. Otherwise, the likelihood of a prolonged consolidation is gradually increasing.
At the same time, the overbought momentum in particular not only on the monthly and weekly charts, but also on the daily chart reminds us to remain careful. Even though being bullish, a good risk/reward ratio for gold is not present. Silver, on the other hand, looks much better. Buying at prices between US$17.40 and US$18.00 is still more than justified. Nevertheless, the market characteristics also speak for further price increases in gold, as the stochastic has changed to an embedded bullish state last Thursday. This means that the uptrend has been locked in for the time being.
In summary, the daily chart is bullish after weeks of consolidation. The bulls are rehearsing the breakout to the upside. The weekly closing at US$1,770 could spark new momentum in the days and weeks to come. Looking ahead over the next two and a half months prices around US$1,900 are realistic! Only a daily closing price below US$1,745 would feed the bears and strongly question the breakout.
Commitments of Traders: Gold – Breaking Out Towards US$1,800 And US$1,900
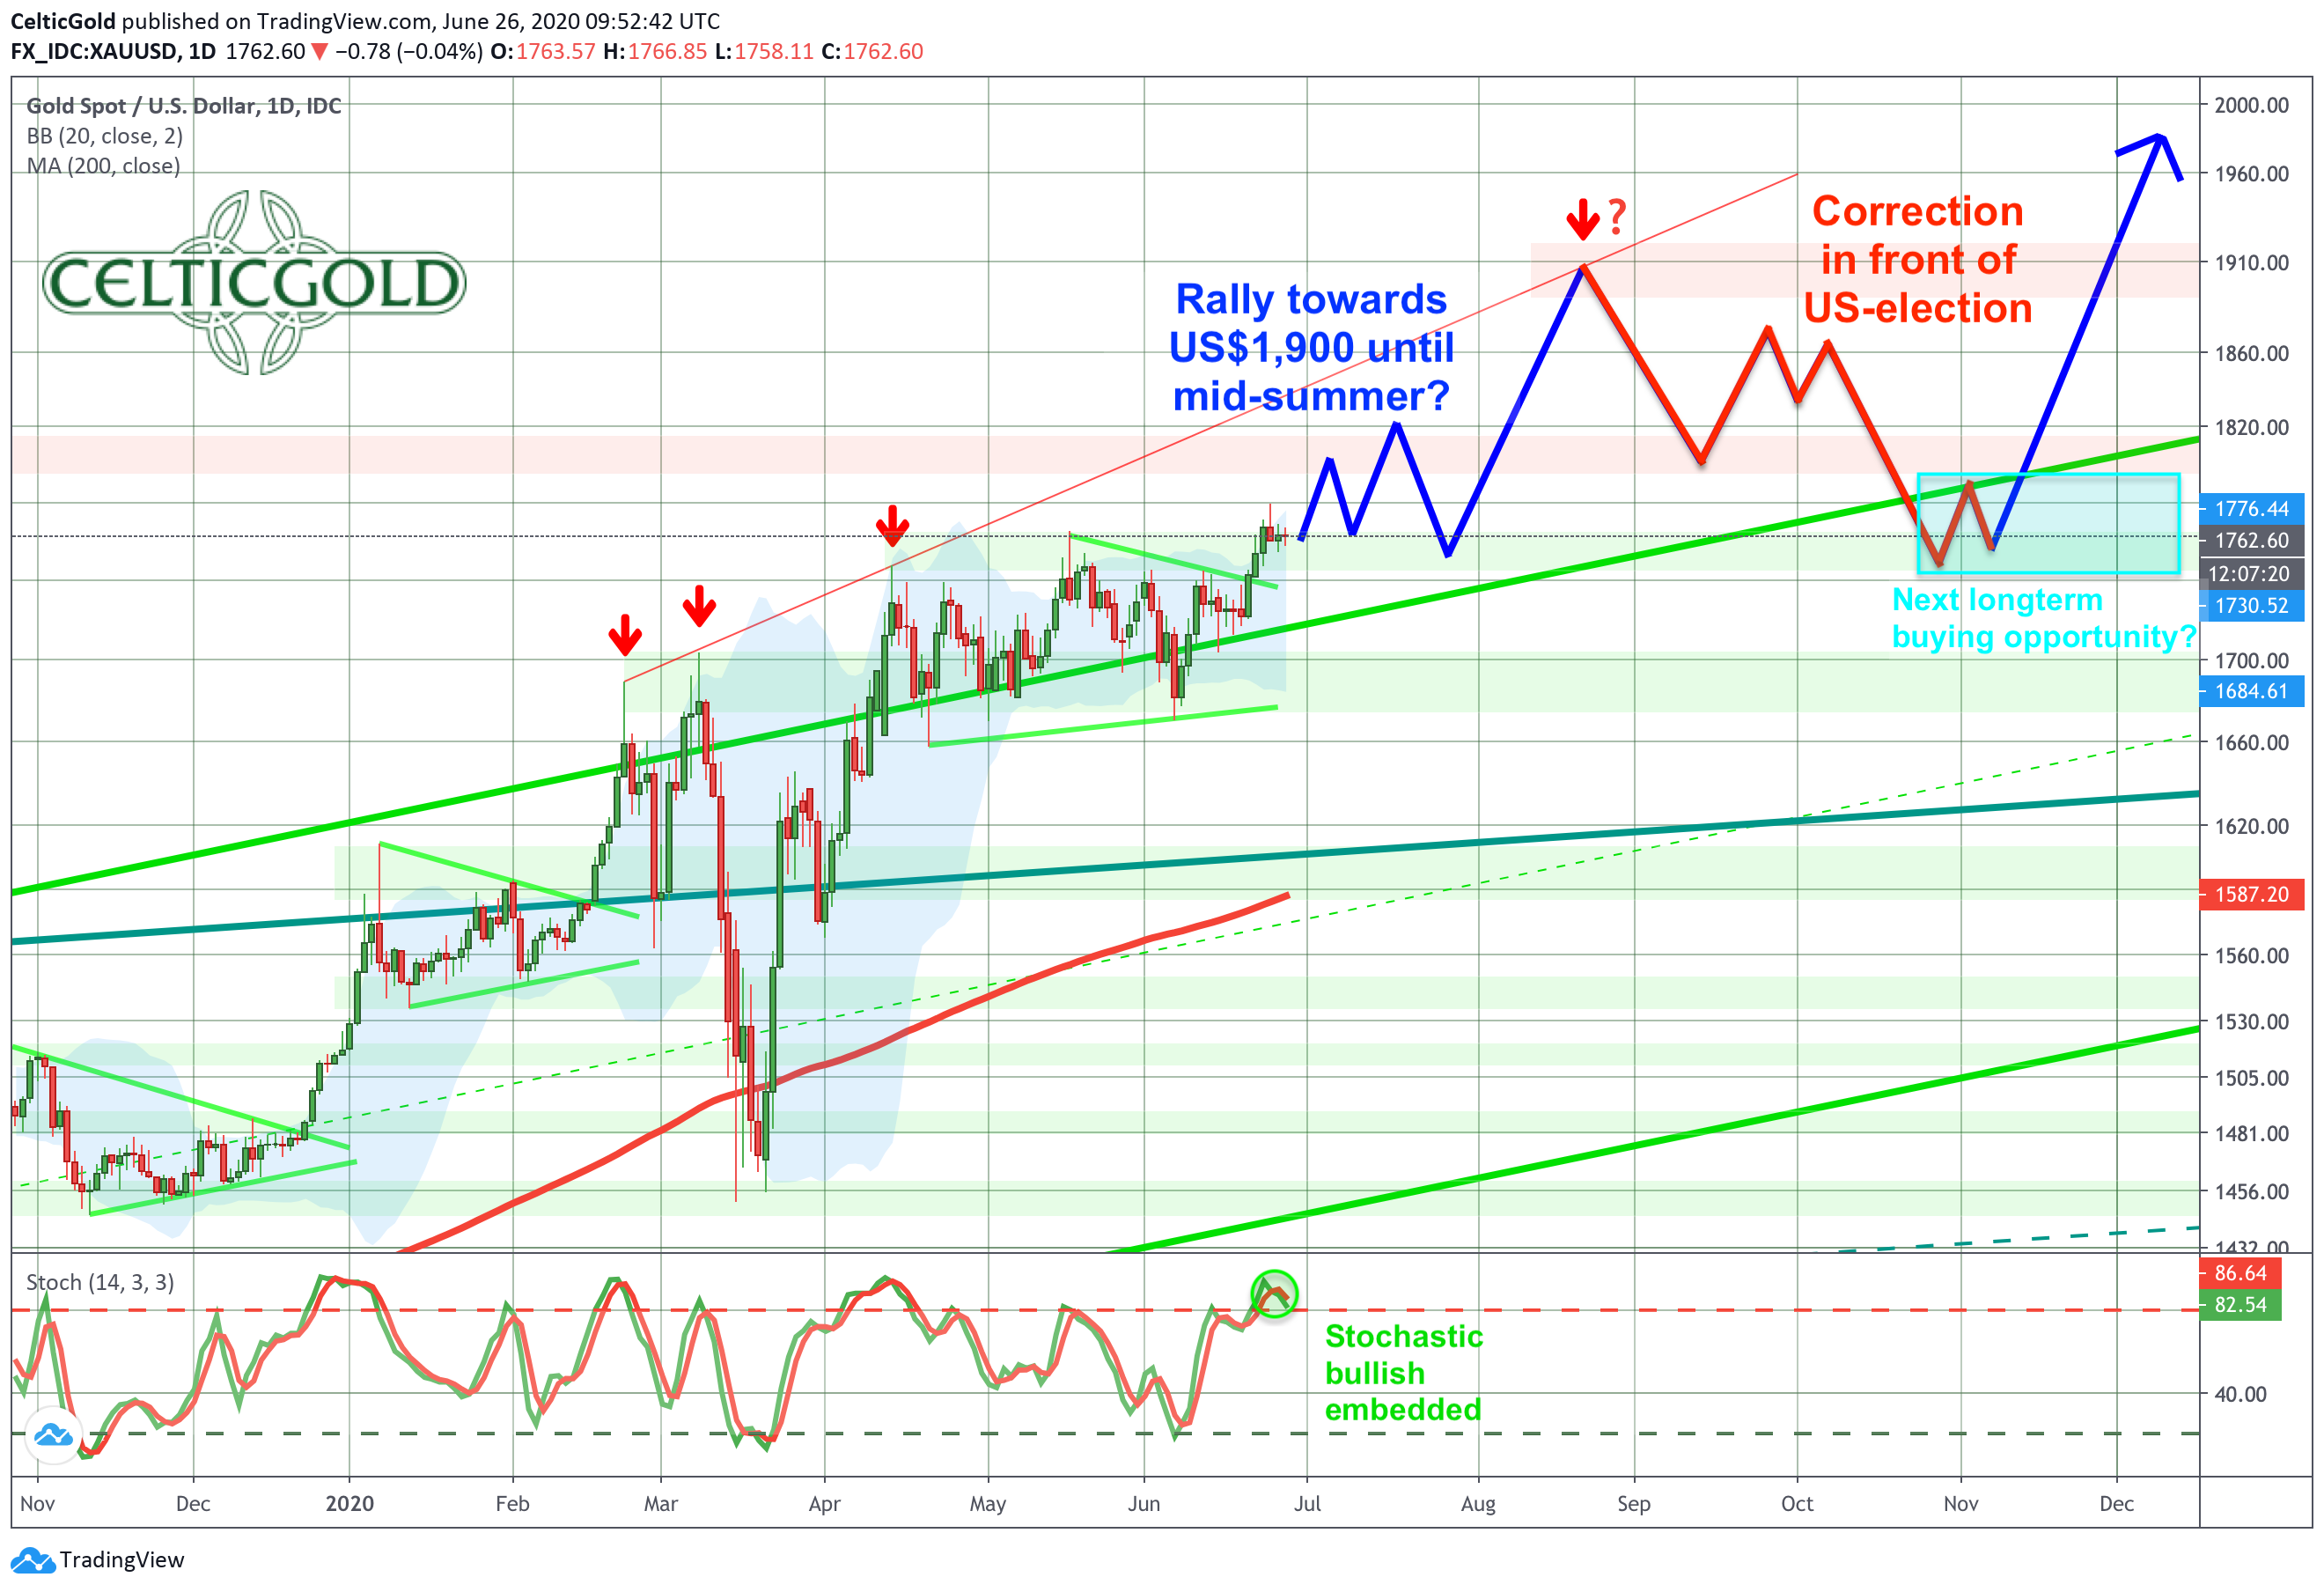
Commitments of Traders for Gold as of June 22nd, 2020. Source: CoT Price Charts
The Commitment of Traders report for the Gold futures market has gradually improved since mid-February. On February 18th, commercial traders held a gigantic short position of 385,612 futures contracts at a gold price of around US$1,601. And one contract at COMEX moves 100 paper ounces! Just shortly before the “corona crash”, this professional group of traders had thus sold short 1,200 tonnes of gold, or more than a third of the total gold annual production, without directly owning the physical material.
With the corona crash and the enormous rescue packages and especially the worldwide lockdown, this short position, which was already under water since the summer of 2019 anyway, came under even more pressure. In Switzerland, all major precious metal refineries were closed. Likewise, numerous gold and silver mines had to temporarily reduce or completely suspend production. This supply and demand shock quickly led to an enormous shortage and sharply rising premiums on the physical metals still available.
At COMEX, the spread between the futures contract and the spot price climbed to record levels between US$70 and 90. As there was not enough physical material available for delivery, the exchange supervisory authority CFTC was only able to save the futures market with a dramatic change in the rules. Since then, the gold futures market has been on the brink of collapse, as the paper charades of the past decades have now become openly visible to everyone. Some banks like Scotiabank have obviously gambled themselves into huge losses and are now withdrawing from precious metals trading.
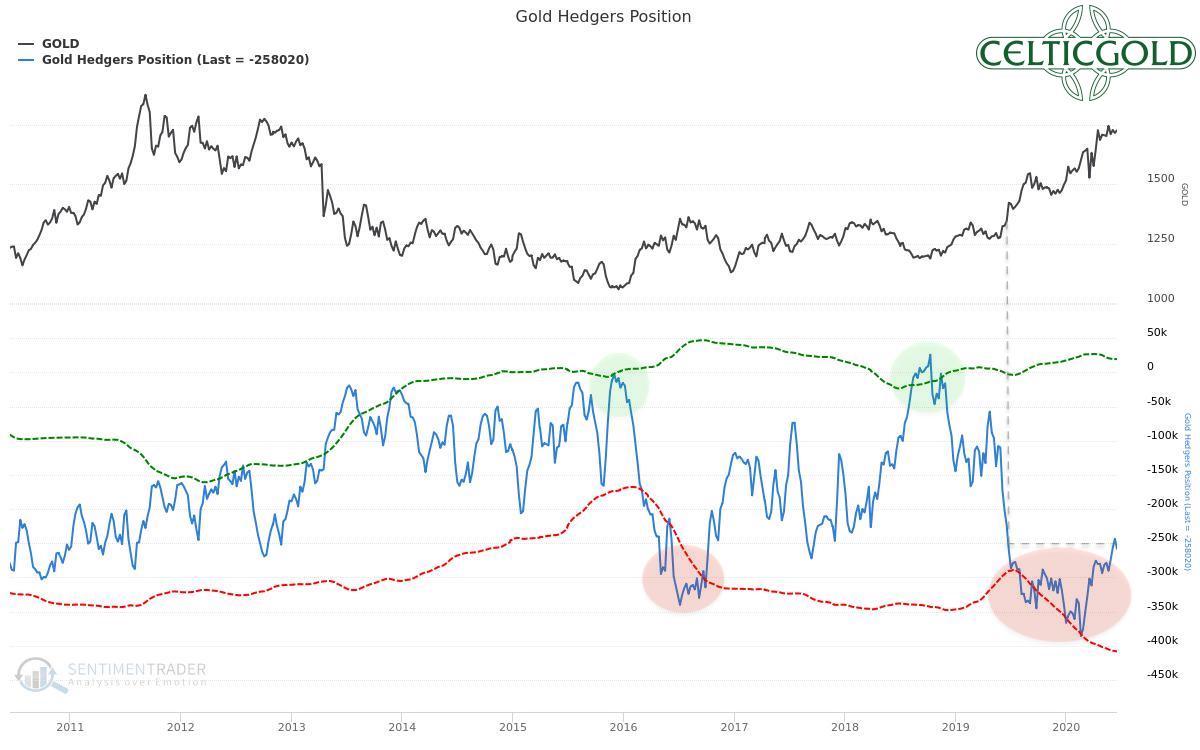
Commitments of Traders for Gold as of June 22nd, 2020. Source: Sentimentrader
It is therefore not surprising that the commercial short position has gradually decreased over the past two months despite the sideways moving price. With currently 258,020 contracts sold short, the commercial short position is still high by long-term comparison. The last time such orders of magnitude were seen was in mid-June 2019. At that time, the price of gold was trading almost 400 US$ lower! In this respect, the futures market probably no longer poses the danger we saw, especially in the bear market years 2011 to 2015.
All in all, however, the CoT report still provides a sell signal for the gold price. A promising contrarian bottleneck is not present by any means. This would take at least a commercial short position below 100,000 contracts.
Sentiment: Gold
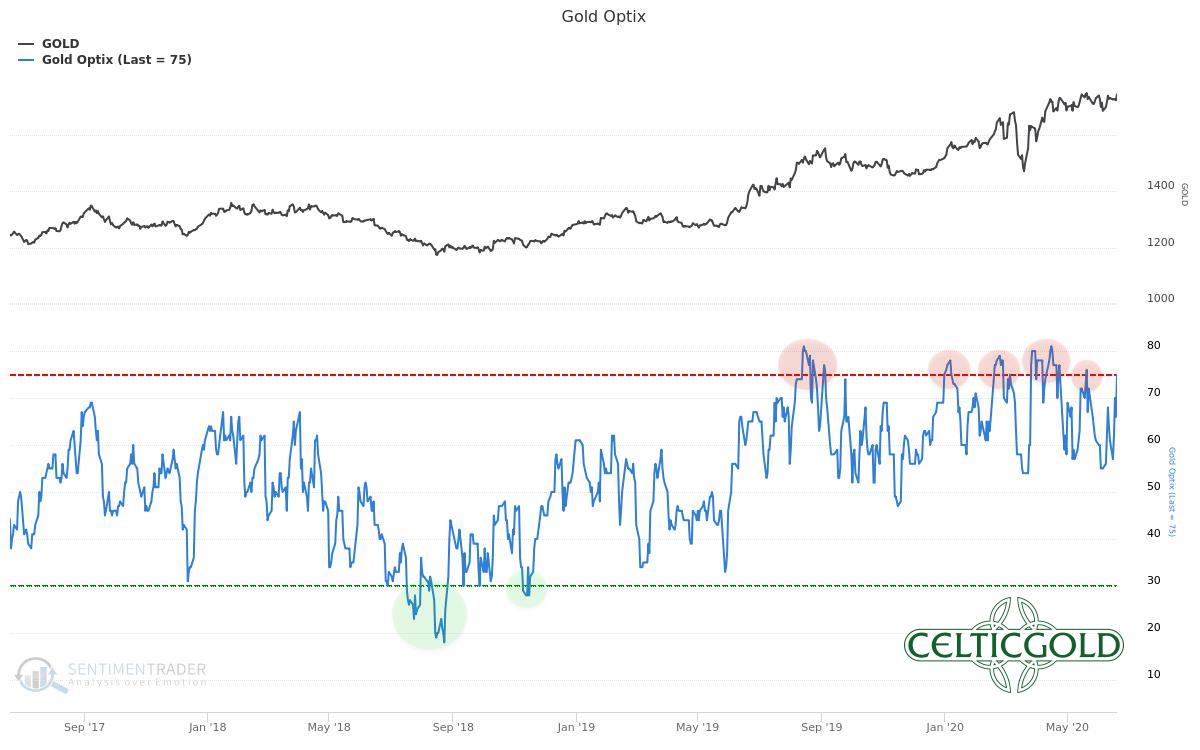
Sentiment Optix for Gold as of June 22nd, 2020. Source: Sentimentrader
Thanks to the efforts to break out above the resistance zone between US$1,750 and US$1,765 USD, optimism in the gold market has also risen again. The sentiment barometer Optix currently measures a value of 75%. However, this also means that sentiment is not yet too euphoric and further price increases are still possible.
Overall, sentiment analysis indicates that there is currently not a good risk/reward ratio. At the same time, the sentiment is not (yet) overly bullish. Further price increases are therefore likely.
Seasonality: Gold – Breaking Out Towards US$1,800 And US$1,900

Seasonality for Gold in US Election Years as of June 26th, 2020. Source: Seasonax
Usually, gold prices find an important low in June or July and then move into an uptrend towards September. This year, gold seems to have found this early summer reversal point on June 5th at US$1,670. However, the presidential elections are due in the USA on 3rd November. Statistically speaking, in US election years gold often has a hard time from mid-September at the latest, but from the beginning/mid-July as well.
Therefore, from a seasonal perspective gold appears to be well supported into August this year. However, should there be a significant peak either in mid/end July or then in August, e.g. around US$1,900, a significant price correction would be realistic for September and October.
Bitcoin/Gold Ratio
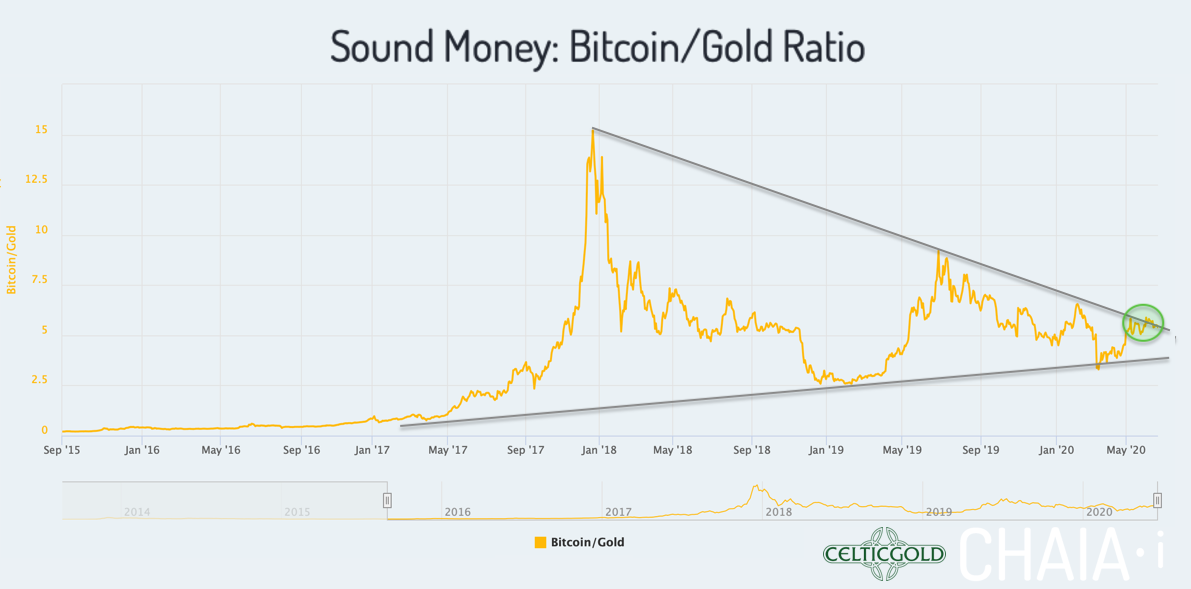
Sound Money Bitcoin/Gold-Ratio as of June 23rd, 2020. Source: Chaia
Currently, you have to pay 5.23 ounces of gold for one Bitcoin. In other words, a troy ounce of gold currently costs only 0.19 Bitcoin. Since the low point of the corona crash, Bitcoin has been able to outperform gold significantly. Since the beginning of May, the ratio has been consolidating sideways. At the same time, the breakout to the upside in favour of Bitcoin is slowly but surely materializing.
Looking ahead over the next three to six months, such a successful and sustained breakout should logically result in a sharp rise in Bitcoin’s price against gold.
Sound Money Asset Allocation
Generally, buying and selling Bitcoin against gold only makes sense to the extent that one balances the allocation in the two asset classes! At least 10% but better 25% of one’s total assets should be invested in precious metals (preferably physically), while in cryptos and especially in Bitcoin, one should hold at least 1% up to 5%. Paul Tudor Jones holds a little less than 2% of his assets in Bitcoin. If you are very familiar with cryptocurrencies and Bitcoin, you can certainly allocate higher percentages to Bitcoin and maybe other Alt-coins on an individual basis. For the average investor, who usually is primarily invested in equities and real estate, 5% in the highly speculative and highly volatile bitcoin is already a lot!
Opposites compliment. In our dualistic world of Yin and Yang, body and mind, up and down, warm and cold, we are bound by the necessary attraction of opposites. In this sense you can view gold and bitcoin as such a pair of strength. With the physical component of gold and the digital aspect of Bitcoin you have a complimentary unit of a true safe haven in the 21st century. You want to own both!”– Florian Grummes
Conclusion and Recommendation
Since its last low at US$1,670 gold unwaveringly has been moving higher over the last three weeks. Last Wednesday a fresh 8-year high at US$1,780 has been the reward. Despite the overbought overall setup this price behavior is clearly bullish!
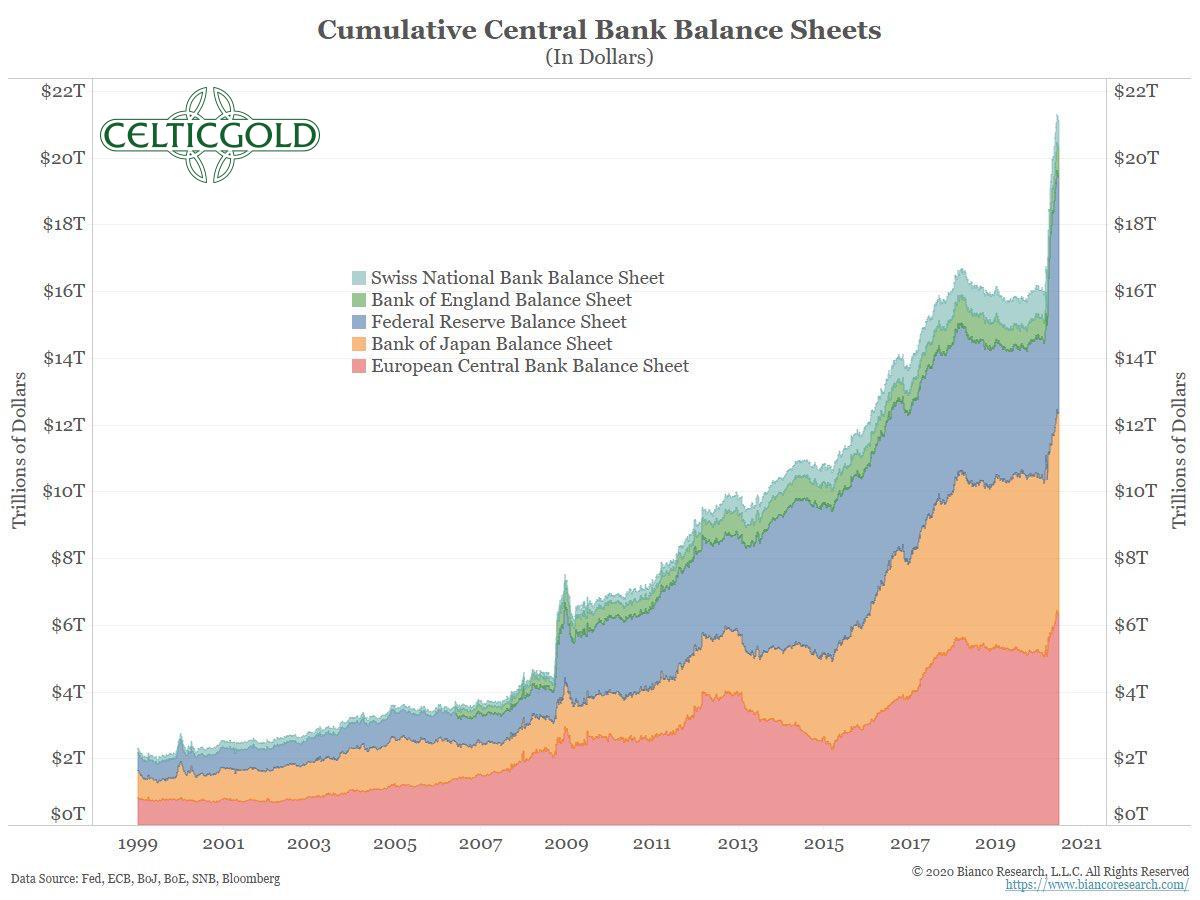
Ultimately, the main reason for the rising gold price is quite simply to be found in the extreme balance sheet expansions of all central banks on this planet. These ever-increasing money supply expansions already caused the bull market in precious metals to begin in 2001, but since the financial crisis of 2008, the exponential thrust has been followed by a further increase in the rising trend. This year, the corona crisis has again provided an even greater exponential thrust. Hence, it is quite obvious to expect a further intensification of this trend and thus a further exploding money supply in the coming years.
Only Gold is money – everything else is credit
Gold is and remains the antidote to the worldwide uncovered credit and paper madness. Gold is money – everything else is credit. This is a truth proven over thousands of years. In view of the worldwide monetary disruptions, there can be no more talk of a free market. Rather, it is a never-ending chain of miserably failing interventions by politicians and central bankers. The end result is already clear and unambiguous. The only question is when, or how quickly, a reset or a currency reform will be carried out in the individual countries or on a worldwide basis.
Unfortunately, humanity is always dragging and delaying the inevitable to infinity, rather than bringing forward an end with horror. That is why we must prepare ourselves for a huge crack-up boom in the coming years, in which nominal prices will rise significantly thanks to the constant expansion of the money supply, while the real economy will barely or only partially get back on its feet.
Historical examples are the years 1920 to 1923 of the Weimar Republic in particular. The accelerating intervention spiral may therefore take at least three years to reach its peak. Since it is a worldwide phenomenon, however, five years or more are also conceivable. Gold and especially silver, but of course also Bitcoin, all being assets outside the faltering financial system, will see huge nominal increases and offer the desired safe haven. Larger pullbacks from current price levels are probably no longer to be expected. Too big is already the crowd of those who buy every little dip.
Gold – Breaking Out Towards US$1,800 And US$1,900
Even though I certainly have no crystal ball, here is my outlook for the next two and a half months. I now expect gold to rise to around US$1,900. Thereafter, the approaching US election in autumn could cause a healthy and deep pullback. A correction of several weeks, e.g. from US$1,900 down to US$1,750 or even US$1,700, could create a heavily oversold gold market and a panicking sentiment. Only afterwards, that is, from December 2020, the next wave up towards the all-time highs at around US$1,920 should then set in. This should then cause the breakout in 2021 and would quickly bring prices above US$ 2,000.
Source: www.celticgold.eu
We post real time entries and exits for the silver market in our free Telegram channel.
If you like to get regular updates on our gold model, precious metals and cryptocurrencies you can subscribe to our free newsletter.

