


Gold – Summer doldrums for several weeks would be ideal
Gold had a strong start into the year but has corrected significantly since early March. Many gold bugs feel disappointed by gold basically going nowhere over the last two years. But compared to most other markets, gold has actually done rather well over the last six months. Gold – Summer doldrums for several weeks would be ideal.
Review
On May 16th, with a low at around 1,787 USD, gold prices fell back to its lowest level since the end of January. Since then, prices initially managed to modestly recover towards 1,869 USD. Subsequently, however, gold failed to overcome the resistance zone between 1,865 USD and 1,875 USD. Yet, at the same time, stock markets slid significantly deeper into a bear market.
Hence, on the one hand, the panic in the markets together with the high inflation data repeatedly caused a reflex flight into the safe haven of gold. On the other hand, however, the gold market also repeatedly came under pressure due to the increasing lack of liquidity in the markets. Overall, gold prices therefore traded sideways in a rather volatile fashion between 1,815 USD and 1,875 USD over the course of the last four weeks. The danger of a more significant slide below 1,800 USD has not yet been averted, though.
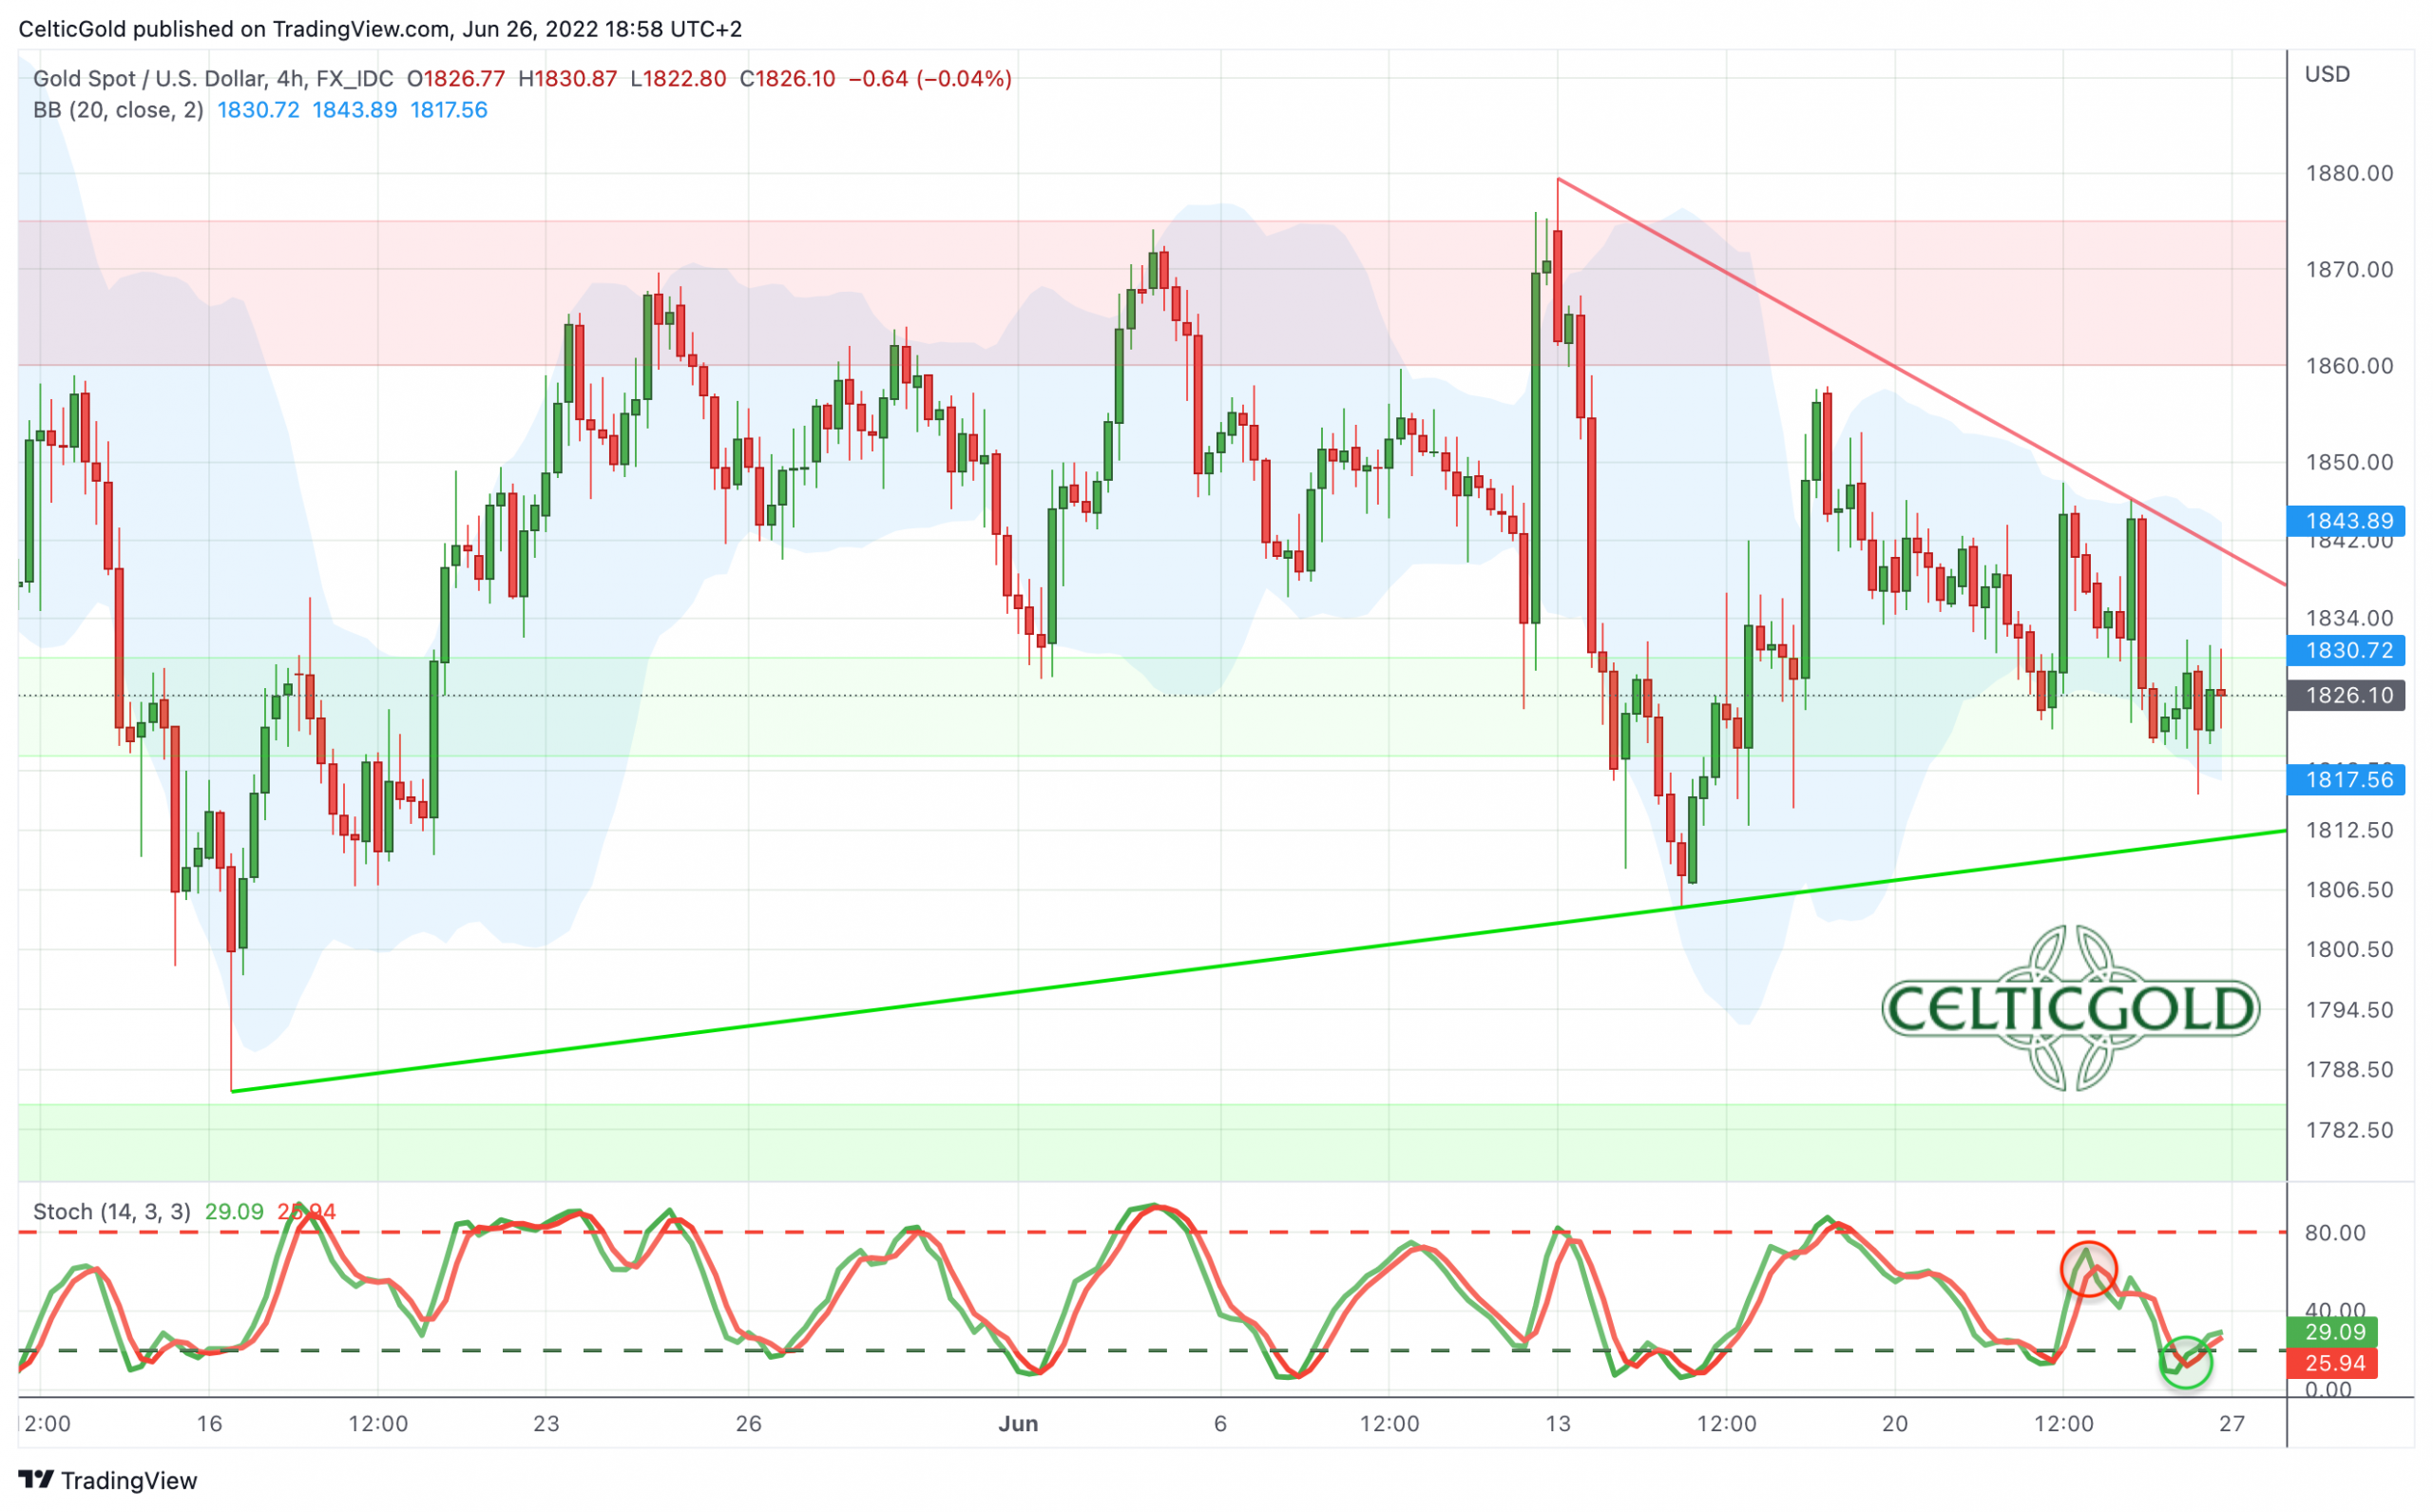
Gold in US-Dollars, 4-hour chart as of June 26th, 2022. Source: Tradingview
Only in the last few days the gold market seems to be calming down a bit as the daily fluctuations are starting to narrow. This behavior is typical for the summer months of June and July. Ideally, the price action will therefore continue to calm down in the coming weeks, while gold prices can maintain eye contact with the 200-day moving average line (currently around 1,843 USD).
Technical Analysis: Gold in US-Dollar
Weekly Chart – The correction of the last three months is running into a bullish wedge
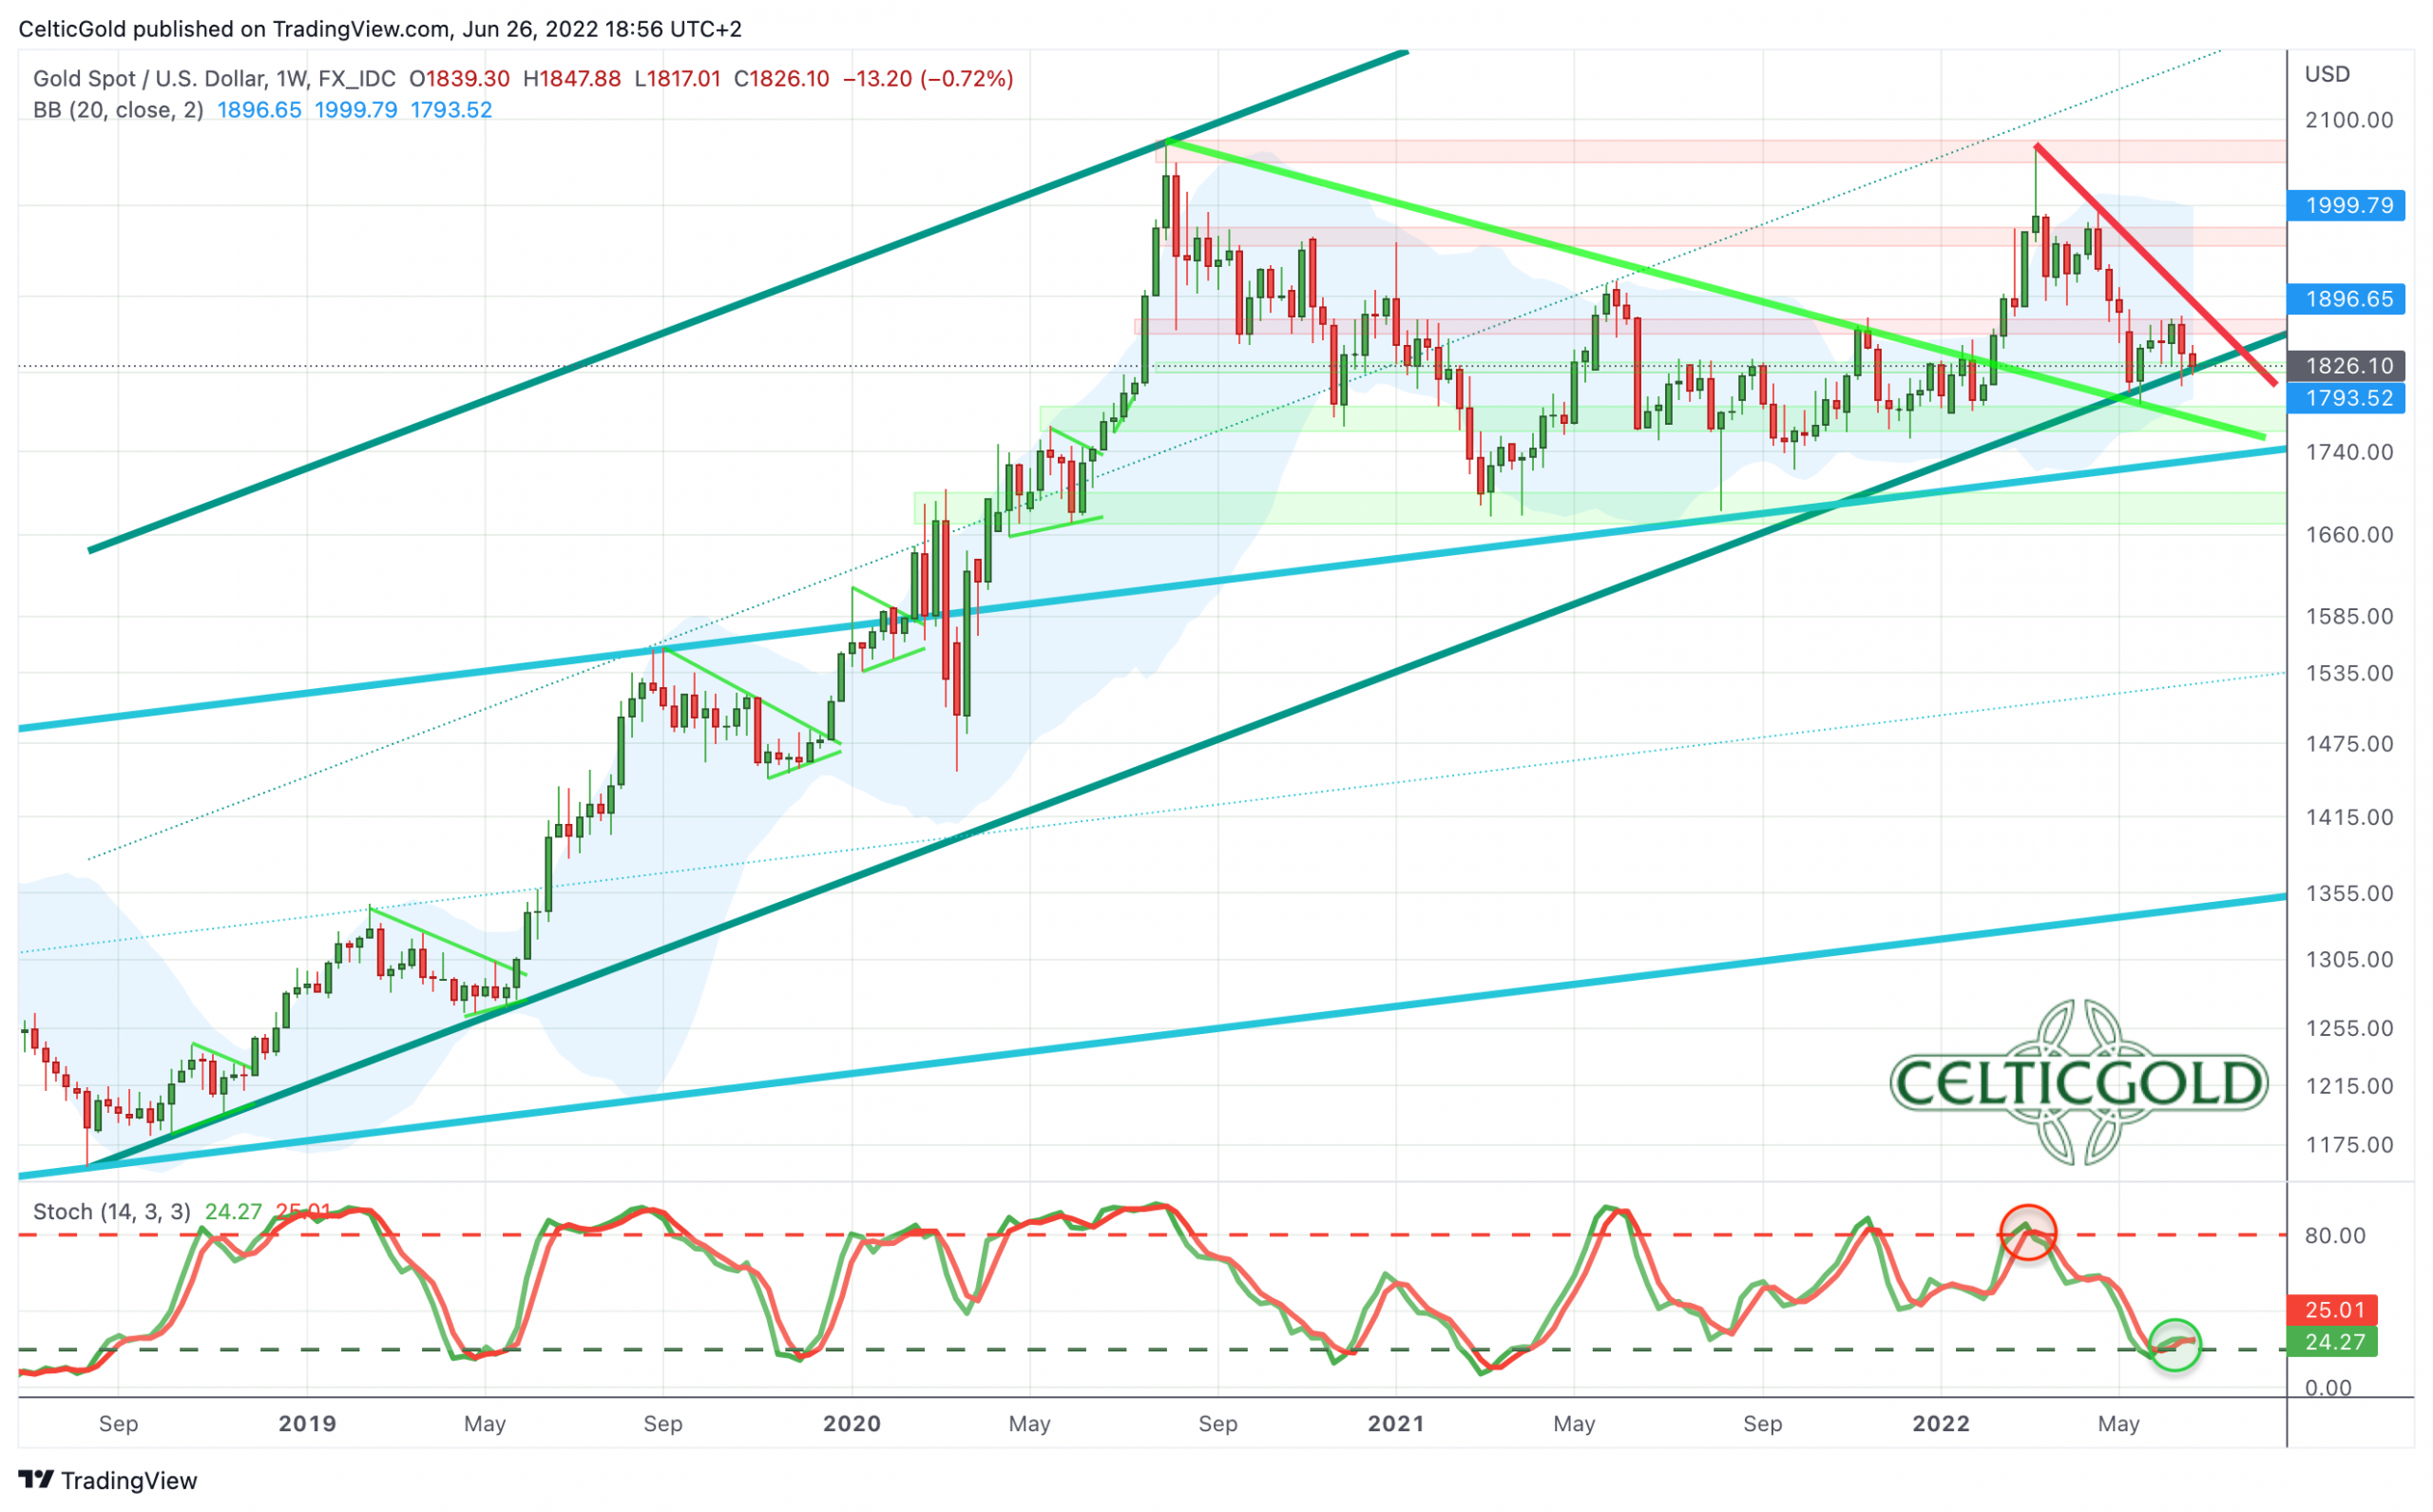
Gold in US-Dollars, weekly chart as of June 26th, 2022. Source: Tradingview
On the weekly chart, gold has been in a correction since the early March high at 2,070 USD. Since mid-May, gold bulls have been struggling to stabilize around or above the dark green uptrend line (currently around 1,820 USD). However, gold prices have been consolidating in a broad range between 1,680 USD and 2,075 USD for the last two years already. If the dark green uptrend-line can be defended on a weekly closing price basis in the coming weeks, the chances for a breakout to the upside and subsequently also for the typical summer rally are very good. A possible target on the upside in this case would be the upper Bollinger Band on the weekly chart (currently 1,998 USD) until fall.
Alternatively, and this scenario has a somewhat increased probability in the current highly depressed market environment, the dark green uptrend-line cannot be defended. In that case, the emerging bullish wedge takes hold, which could initially lead to another shake out of all weak hands with prices plunging towards the next support around 1,765 USD to 1,750 USD first. This “worst case” would also mean a pullback to the upper edge of the turquoise uptrend channel, which has driven gold higher since December 2015 when gold hit an eight-year low at 1,045 USD.
The weekly stochastic is getting oversold
On the positive side, the weekly stochastic is getting oversold. Although the oscillator has not yet succeeded in igniting momentum to the upside, the downside risk seems limited. A few more weeks of bland sideways trading could put the stochastic in an ideal starting position for the sooner or later expected summer rally.
All in all, the weekly chart is neutral. Gold may simply continue to meander sideways through the chart between roughly speaking 1,800 USD and 1,870 USD in the coming weeks. Alternatively, there will one more wave down, whereby a bulwark of support around and above 1,750 USD at the latest should initiate the summer rally.
Daily Chart – Consolidation around the 200-day moving average line
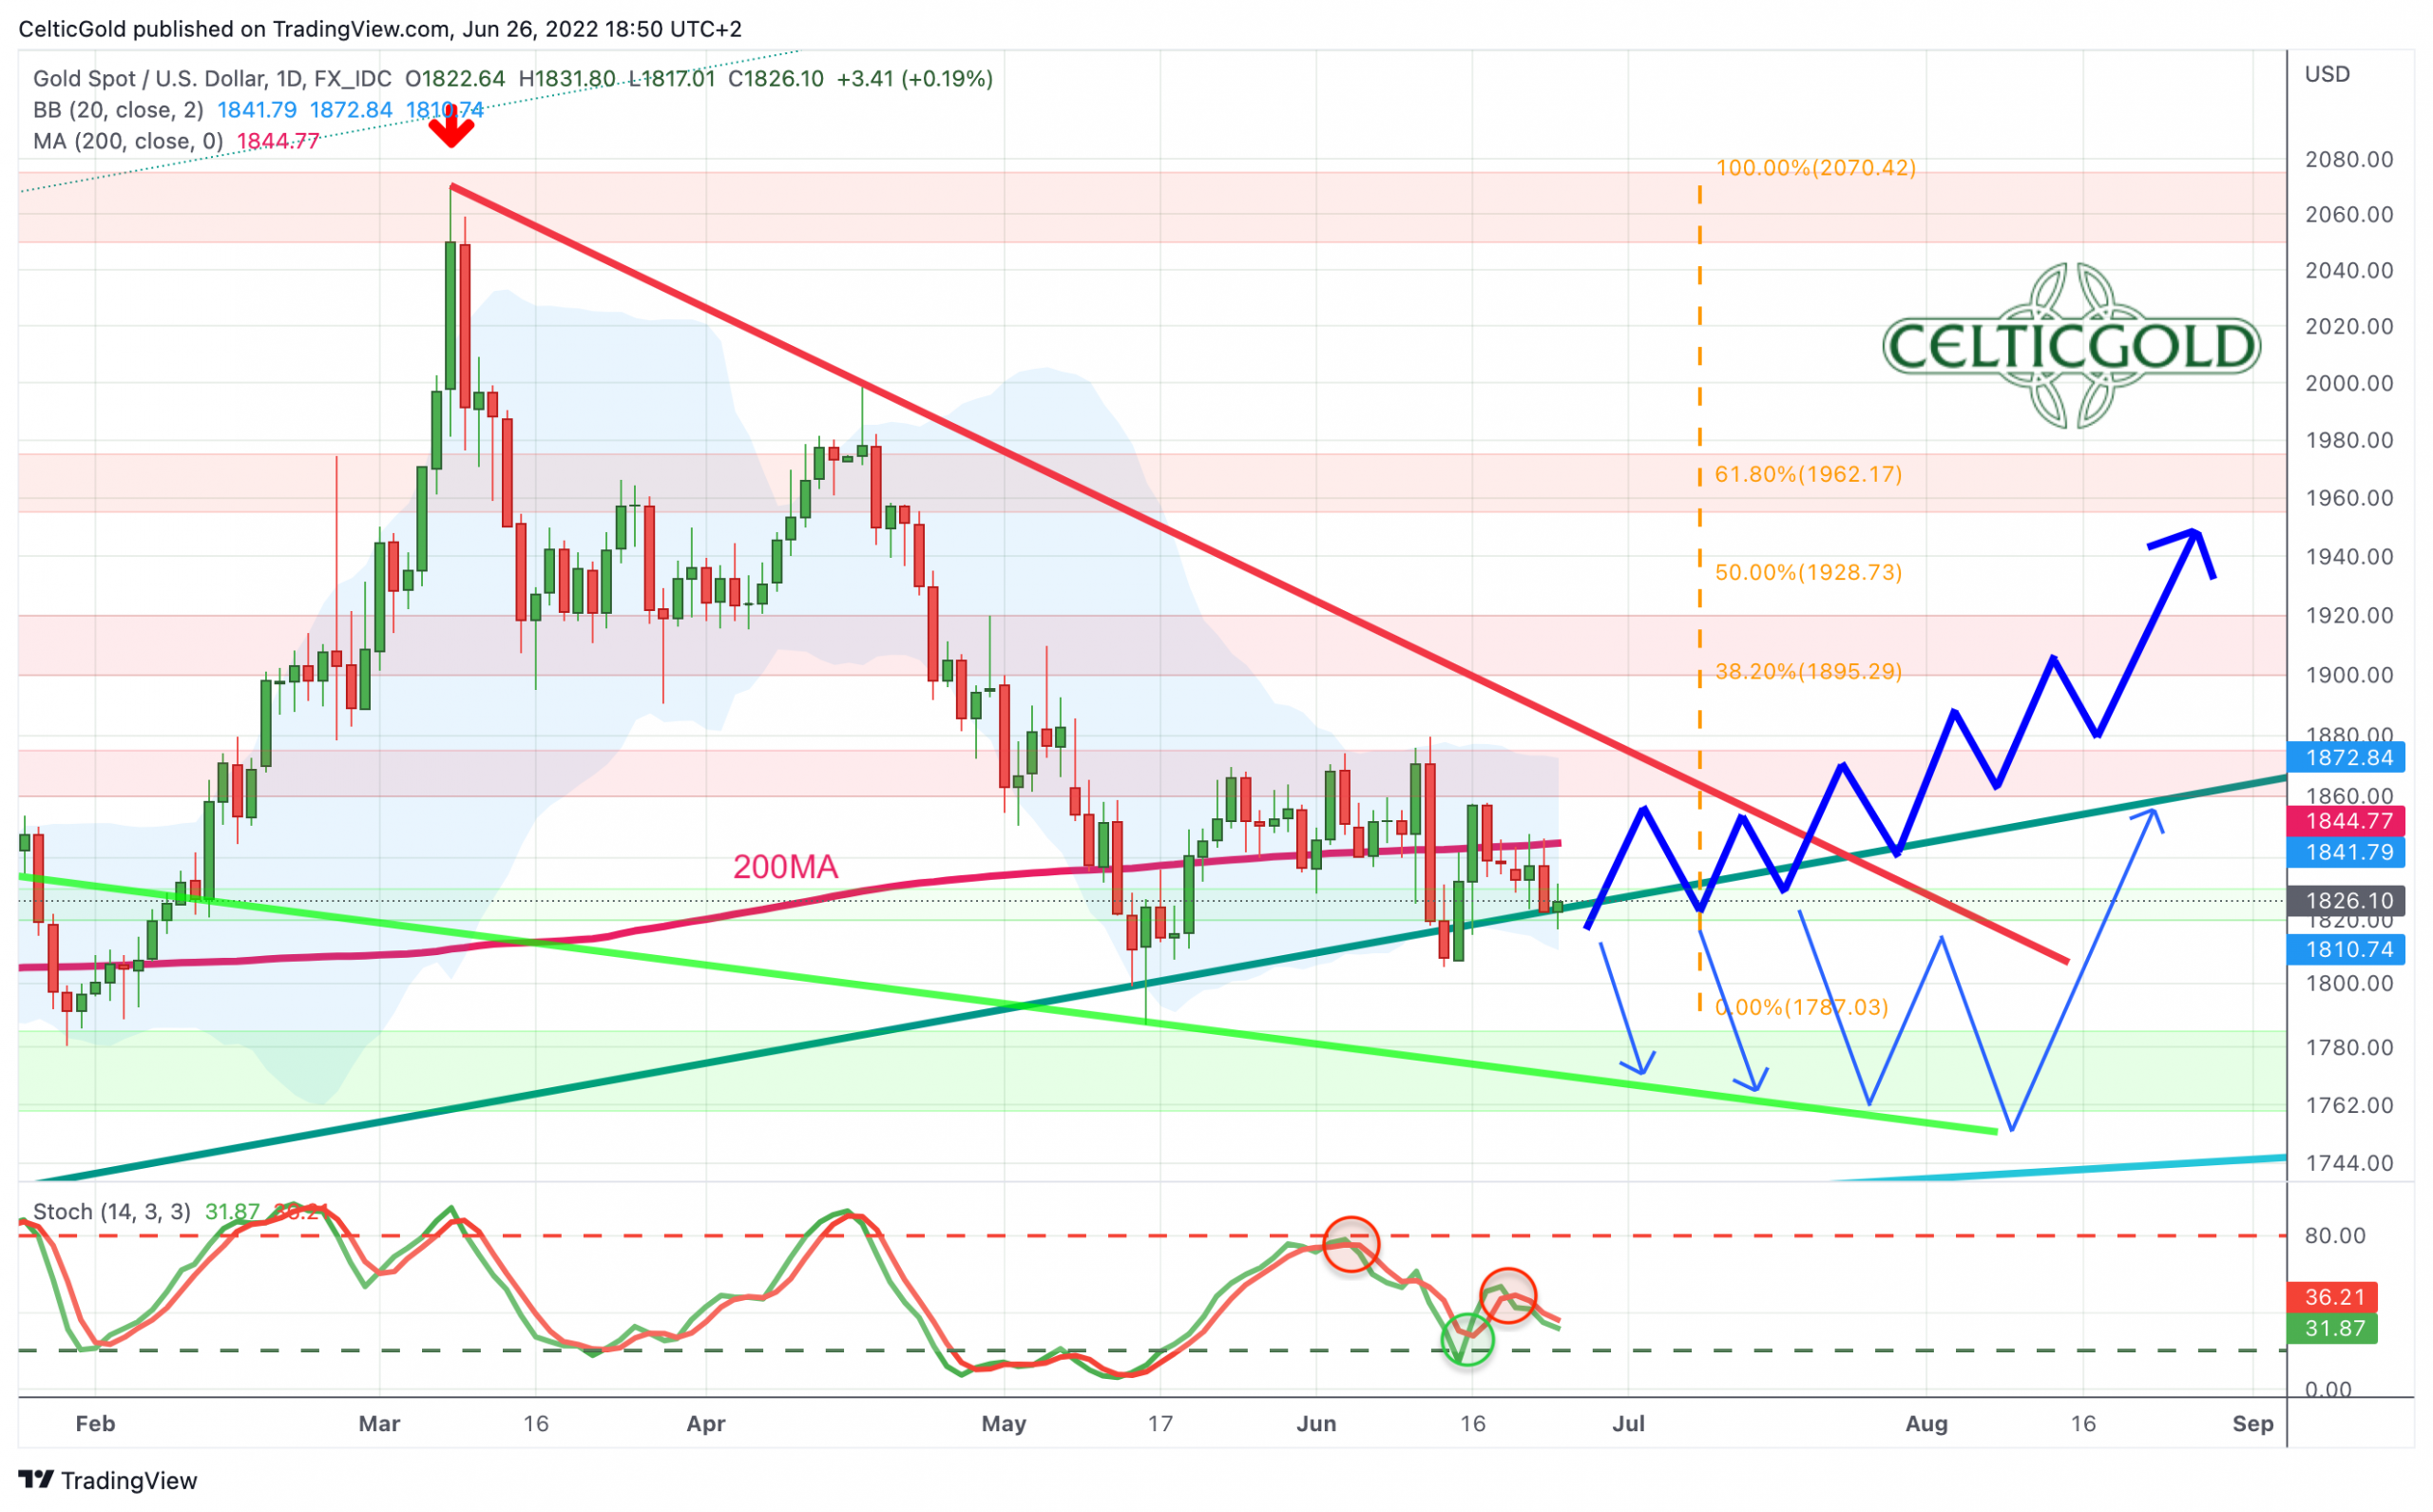
Gold in US-Dollars, daily chart as of June 26th, 2022. Source: Tradingview
On the daily chart, gold has been consolidating around its flat-lining 200-day moving average ($1,844) for weeks. Meanwhile, the Bollinger Bands are also moving sideways between 1,873 USD and 1,814 USD. Ideally, the two bands will contract and narrow further in the coming weeks. Then there would be the ideal condition for a so-called “Bollinger Band Squeeze”, which could deliver a strong breakout move in July or latest by August. The Stochastic is also running sideways without momentum and should still reach the oversold zone in the coming days or weeks.
However, if the dark green support line does not hold, further downside potential to the light green support line (currently around 1,770 USD) is activated. In this case, the correction since March would have taken the form of a bullish wedge. Until August or even September, the bears would then probably be busy exploring the downside as much as possible. Only afterwards, however, the wedge formation should then bring a bullish price explosion.
Overall, the daily chart is neutral to bearish and indicates at least further need for consolidation. Ideally, the gold market will fall asleep in the coming weeks. However, if the bulls can still defend the dark green uptrend line as well as the 200-day moving average, the summer rally could start between mid-July and mid-August. However, below 1,800 USD at the latest, the wedge scenario would be activated, which should initially push prices towards 1,775 USD and 1,750 USD again, before a delayed start of the summer rally from lower levels should then occur.
Commitments of Traders for Gold
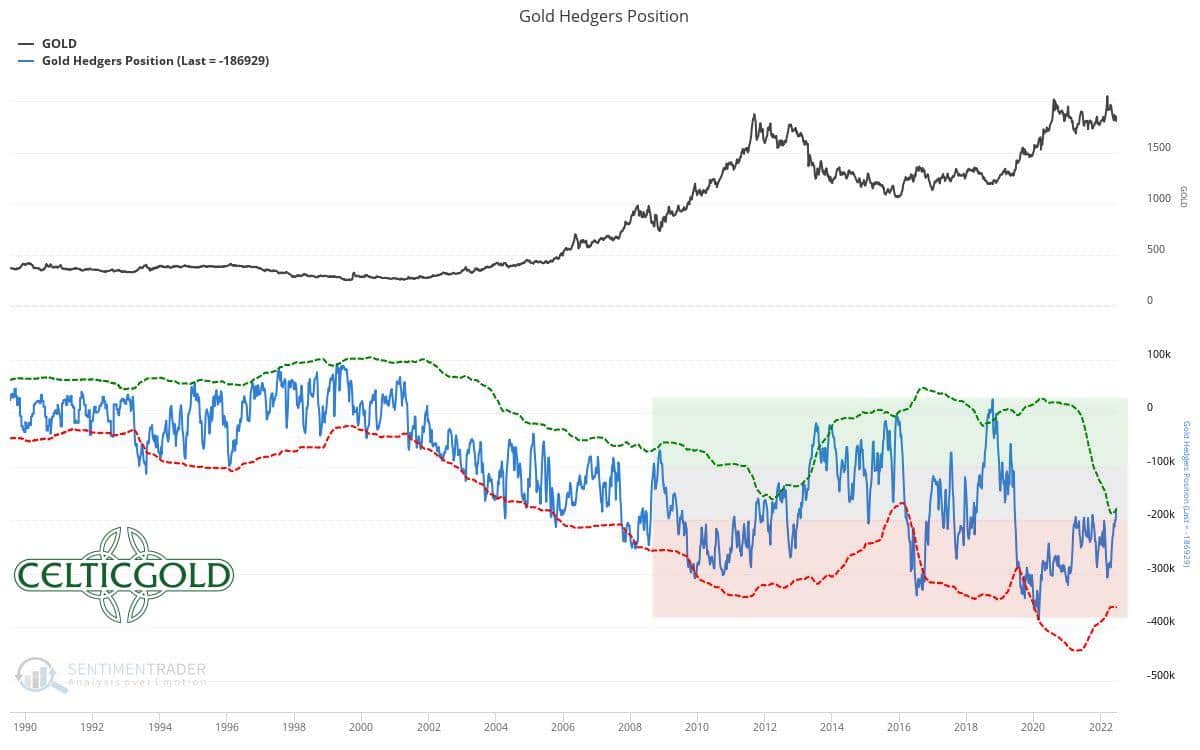
Commitments of Traders for Gold as of June 26th, 2022. Source: Sentimentrader
The cumulative net short position of the commercial market participants has further decreased in recent weeks. Currently, the commercials “only” hold 186,929 COMEX gold future contracts sold short. This is the first time since nearly three years that the futures market has finally given a neutral signal. This neutral signal exists for a cumulative net short position between approx. 100,000 and 200,000 contracts. Since the breakout to above 1,500 USD in the summer of 2019, this is one of the best CoT reports the gold market has seen since then.
In a long-term comparison, however, this constellation still does not provide a contrarian buy signal. Until an ideal contrarian setup would be reached, the commercial short position would still have to shrink to below 100,000 contracts.
In summary, the CoT report currently provides a neutral signal.
Sentiment for Gold – Summer doldrums for several weeks would be ideal
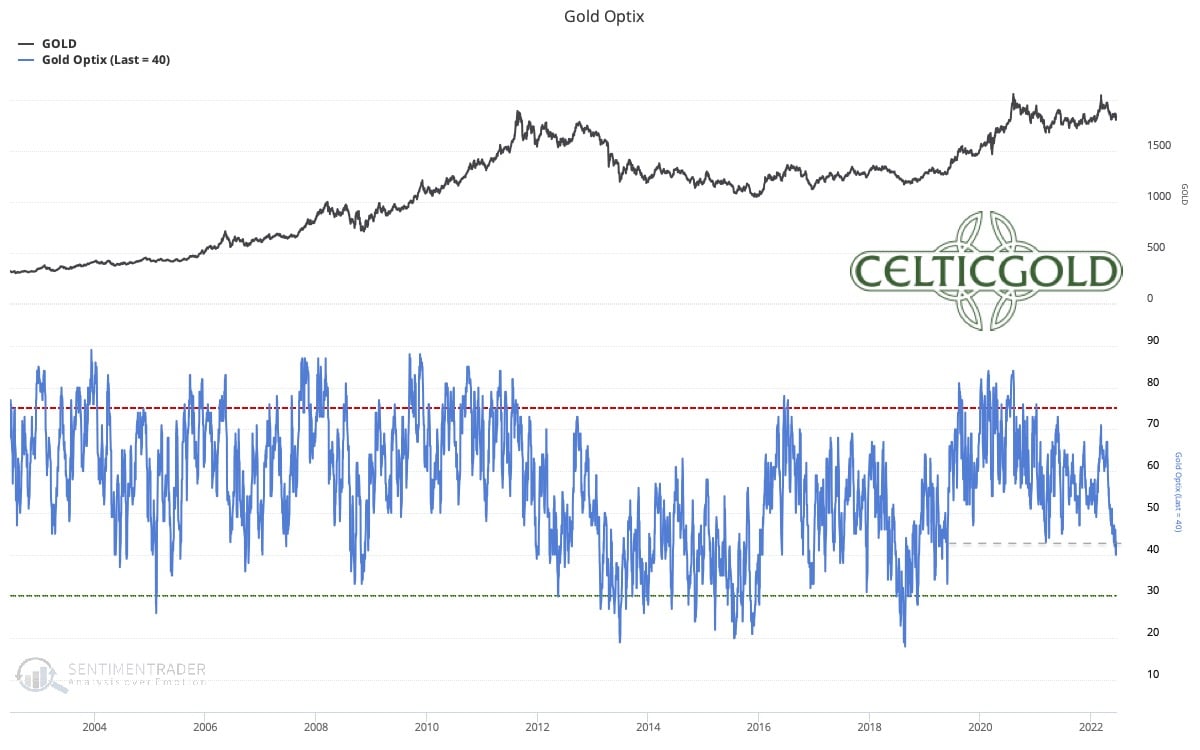
Sentiment Optix for Gold as of June 22nd, 2022. Source: Sentimentrader
After the crash-like sell-offs in the stock markets in recent weeks and months, sentiment has sunk to a new panic low. In the gold market, the sentiment has fallen to the lowest optimism level since the spring of 2019, too. In a long-term comparison, however, the current level of the Sentiment Optix for gold with a value of 40 is not yet sufficient for an contrarian buy signal. There would still be room until the panic zone below 30.
The sentiment traffic light therefore remains neutral, but a contrarian buy signal is getting closer.
Seasonality for Gold – Summer doldrums for several weeks would be ideal
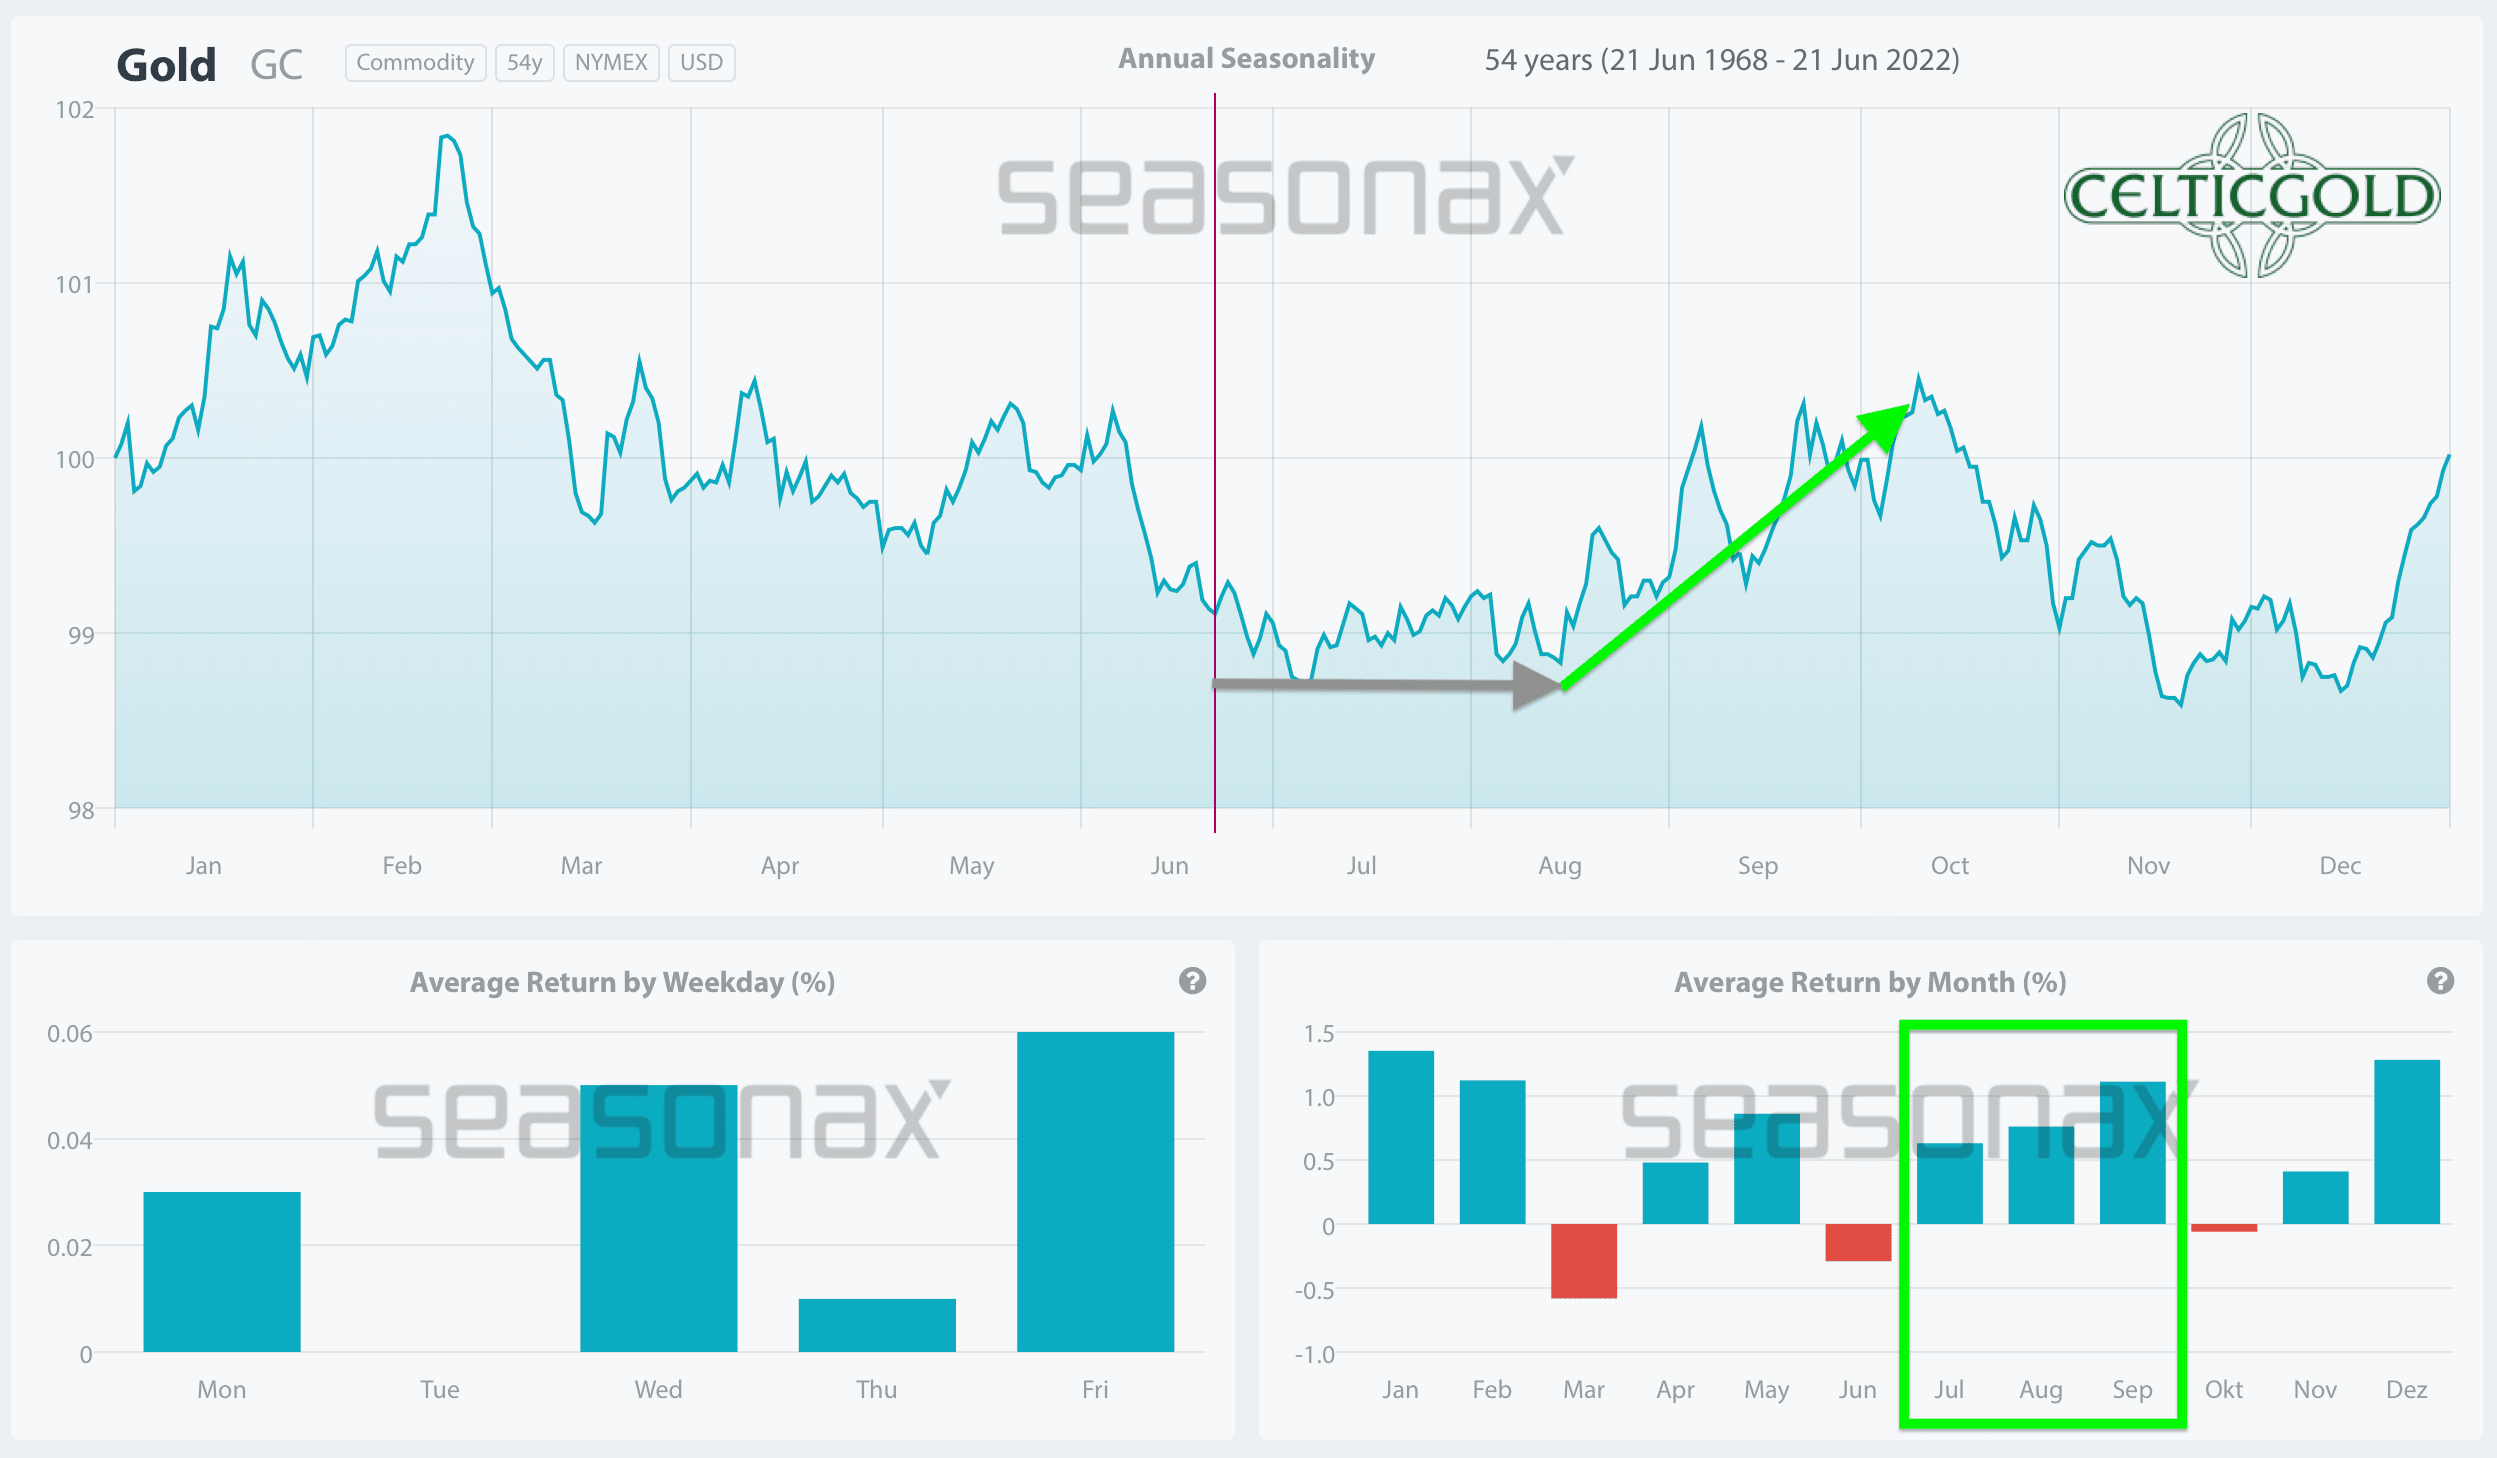
Seasonality for Gold over the last 53-years as of June 22nd, 2022. Source: Seasonax
From a seasonal perspective, the gold market has reached its classic bottoming window since mid-June. In the past, this usually brought a sideways summer lull. Starting from end of July or latest by mid-August a new and trending move should come into the gold market again. With a rather high probability, such a rally should last into September, at least. Until then, however, patience, caution and restraint are still recommended.
In total, gold could still run sideways or correct further in the coming four to about six weeks. According to the seasonal pattern, however, from the beginning or mid of August one should then be fully positioned again.
Macro update:
For more than 50 years now, the central banks, and especially the U.S. Federal Reserve, have gradually expanded the fiat money supply. Since the 2008 financial crisis and especially since the Covid crash in March 2020, the markets have been flooded with liquidity on a gigantic scale. The artificially low and negative interest rates have been in place since 2008, and together with the supply constraints created by the global lockdowns which are responsible for the dysfunctional supply chains, a huge wave of inflation has now been unleashed over the last year and a half. We had accurately forecasted this in time back in the spring of 2020.
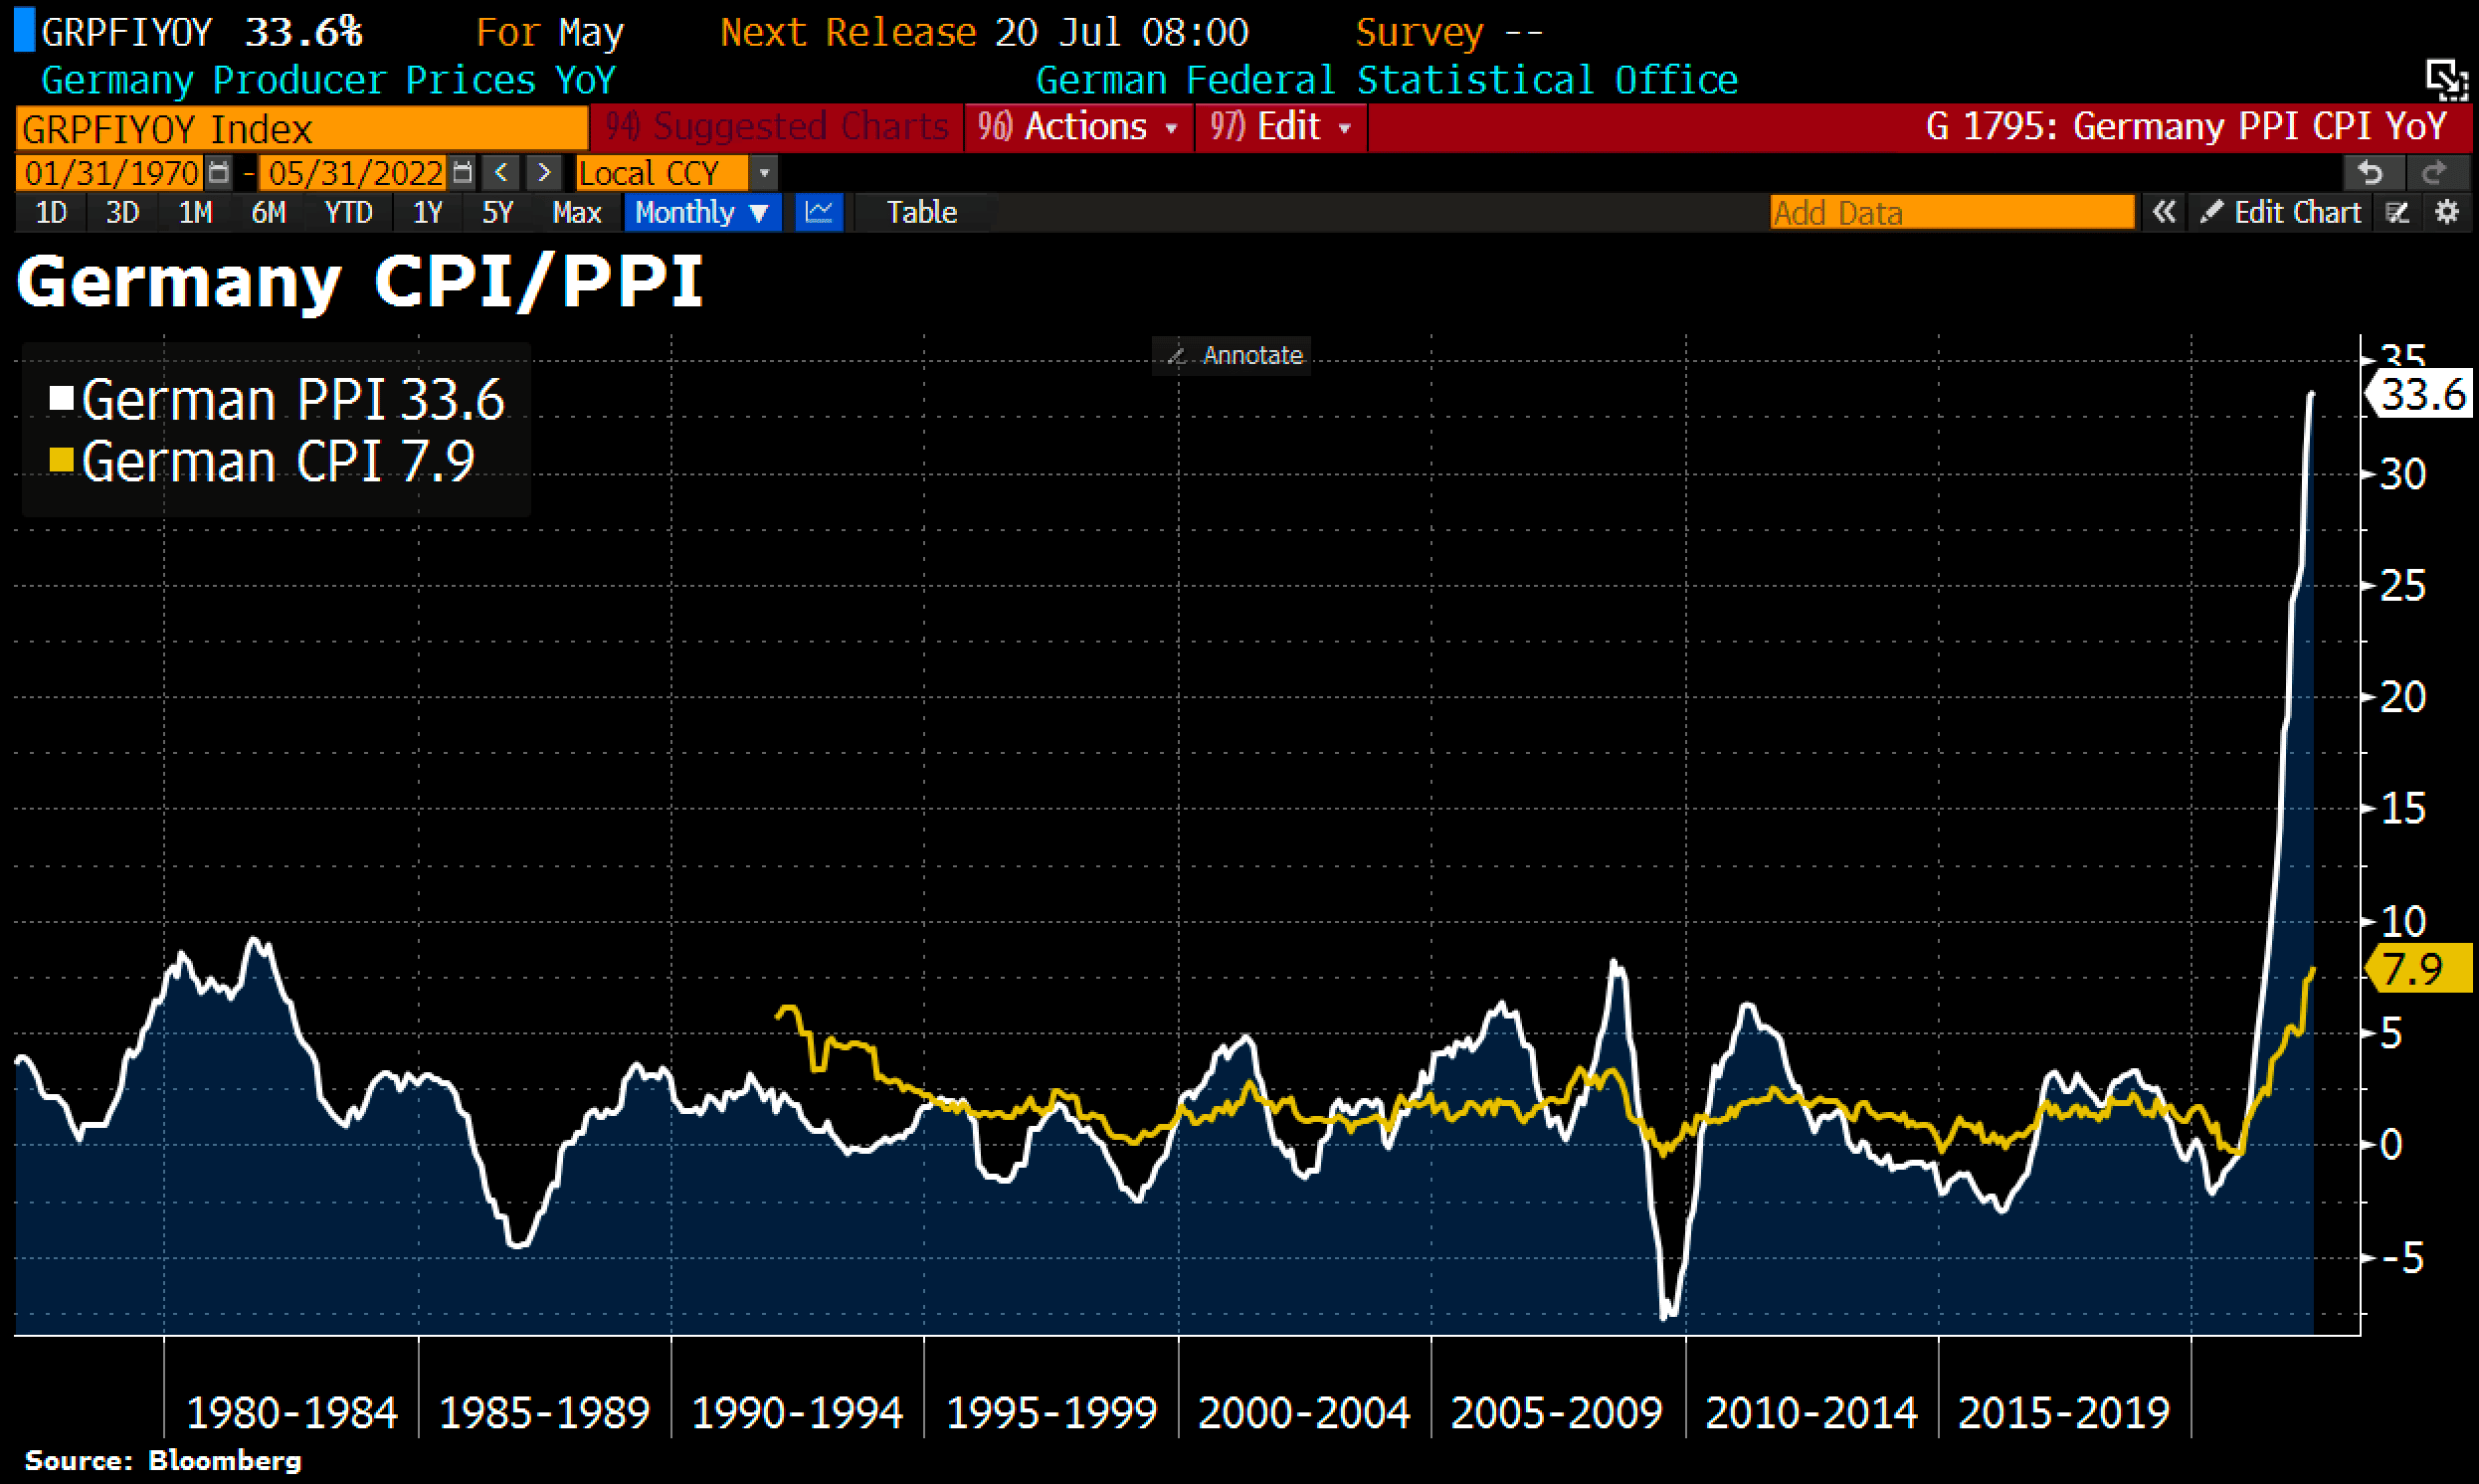
German producer prices vs. German consumer prices as of June 20th, 2022, ©Holger Zschaepitz
While consumer prices in Germany have recently risen by a whopping 7.9%, German producer prices are still exploding vertically higher, currently reaching a new record high of 33.6%. Yet after all, 10-year inflation expectations as measured by inflation-linked bonds have fallen sharply recently due to the falling markets and are now at 2.18%, almost 72 basis points below the all-time high of March.
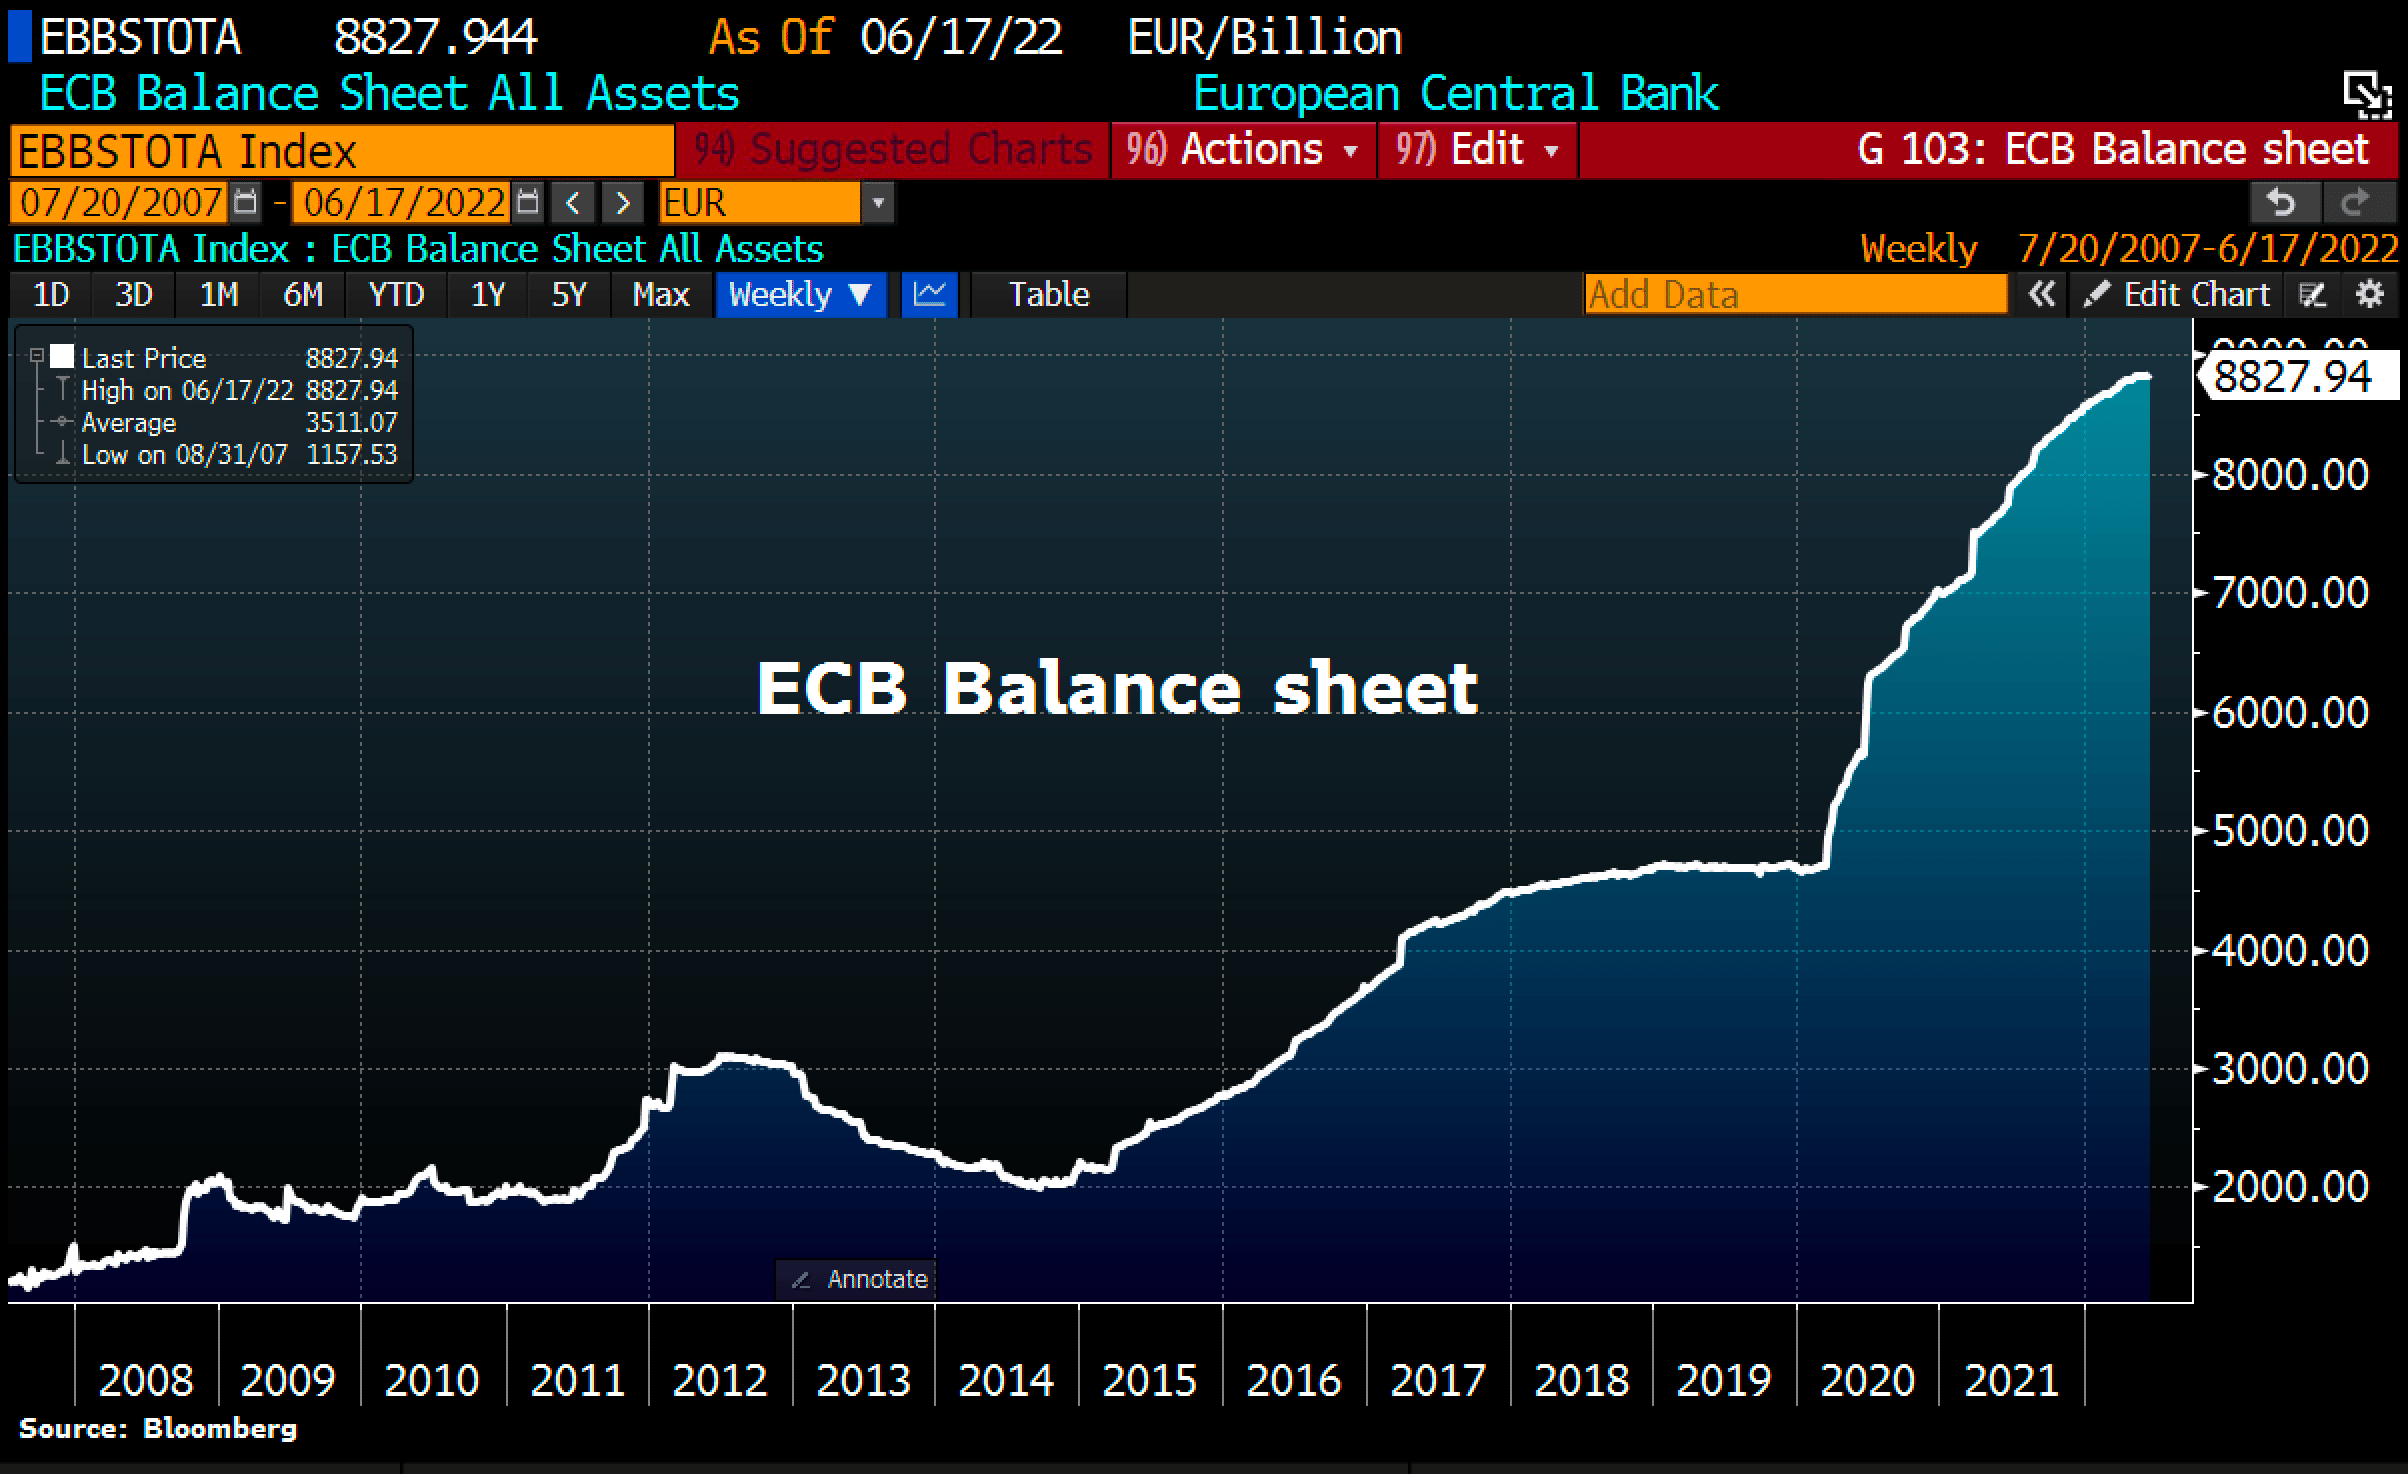
ECB Balance Sheet Total as of June 17th , 2022, ©Holger Zschaepitz
Despite record-high inflation, however, the ECB continues to keep its printing presses running, with the result that the ECB’s balance sheet total recently rose by another 7 billion EUR to its current level of 8,827.9 billion EUR. This means that the ECB’s balance sheet is now equivalent to 82.41% of eurozone GDP. In America, the Fed’s balance sheet total is “only” 36.63% of U.S. GDP.
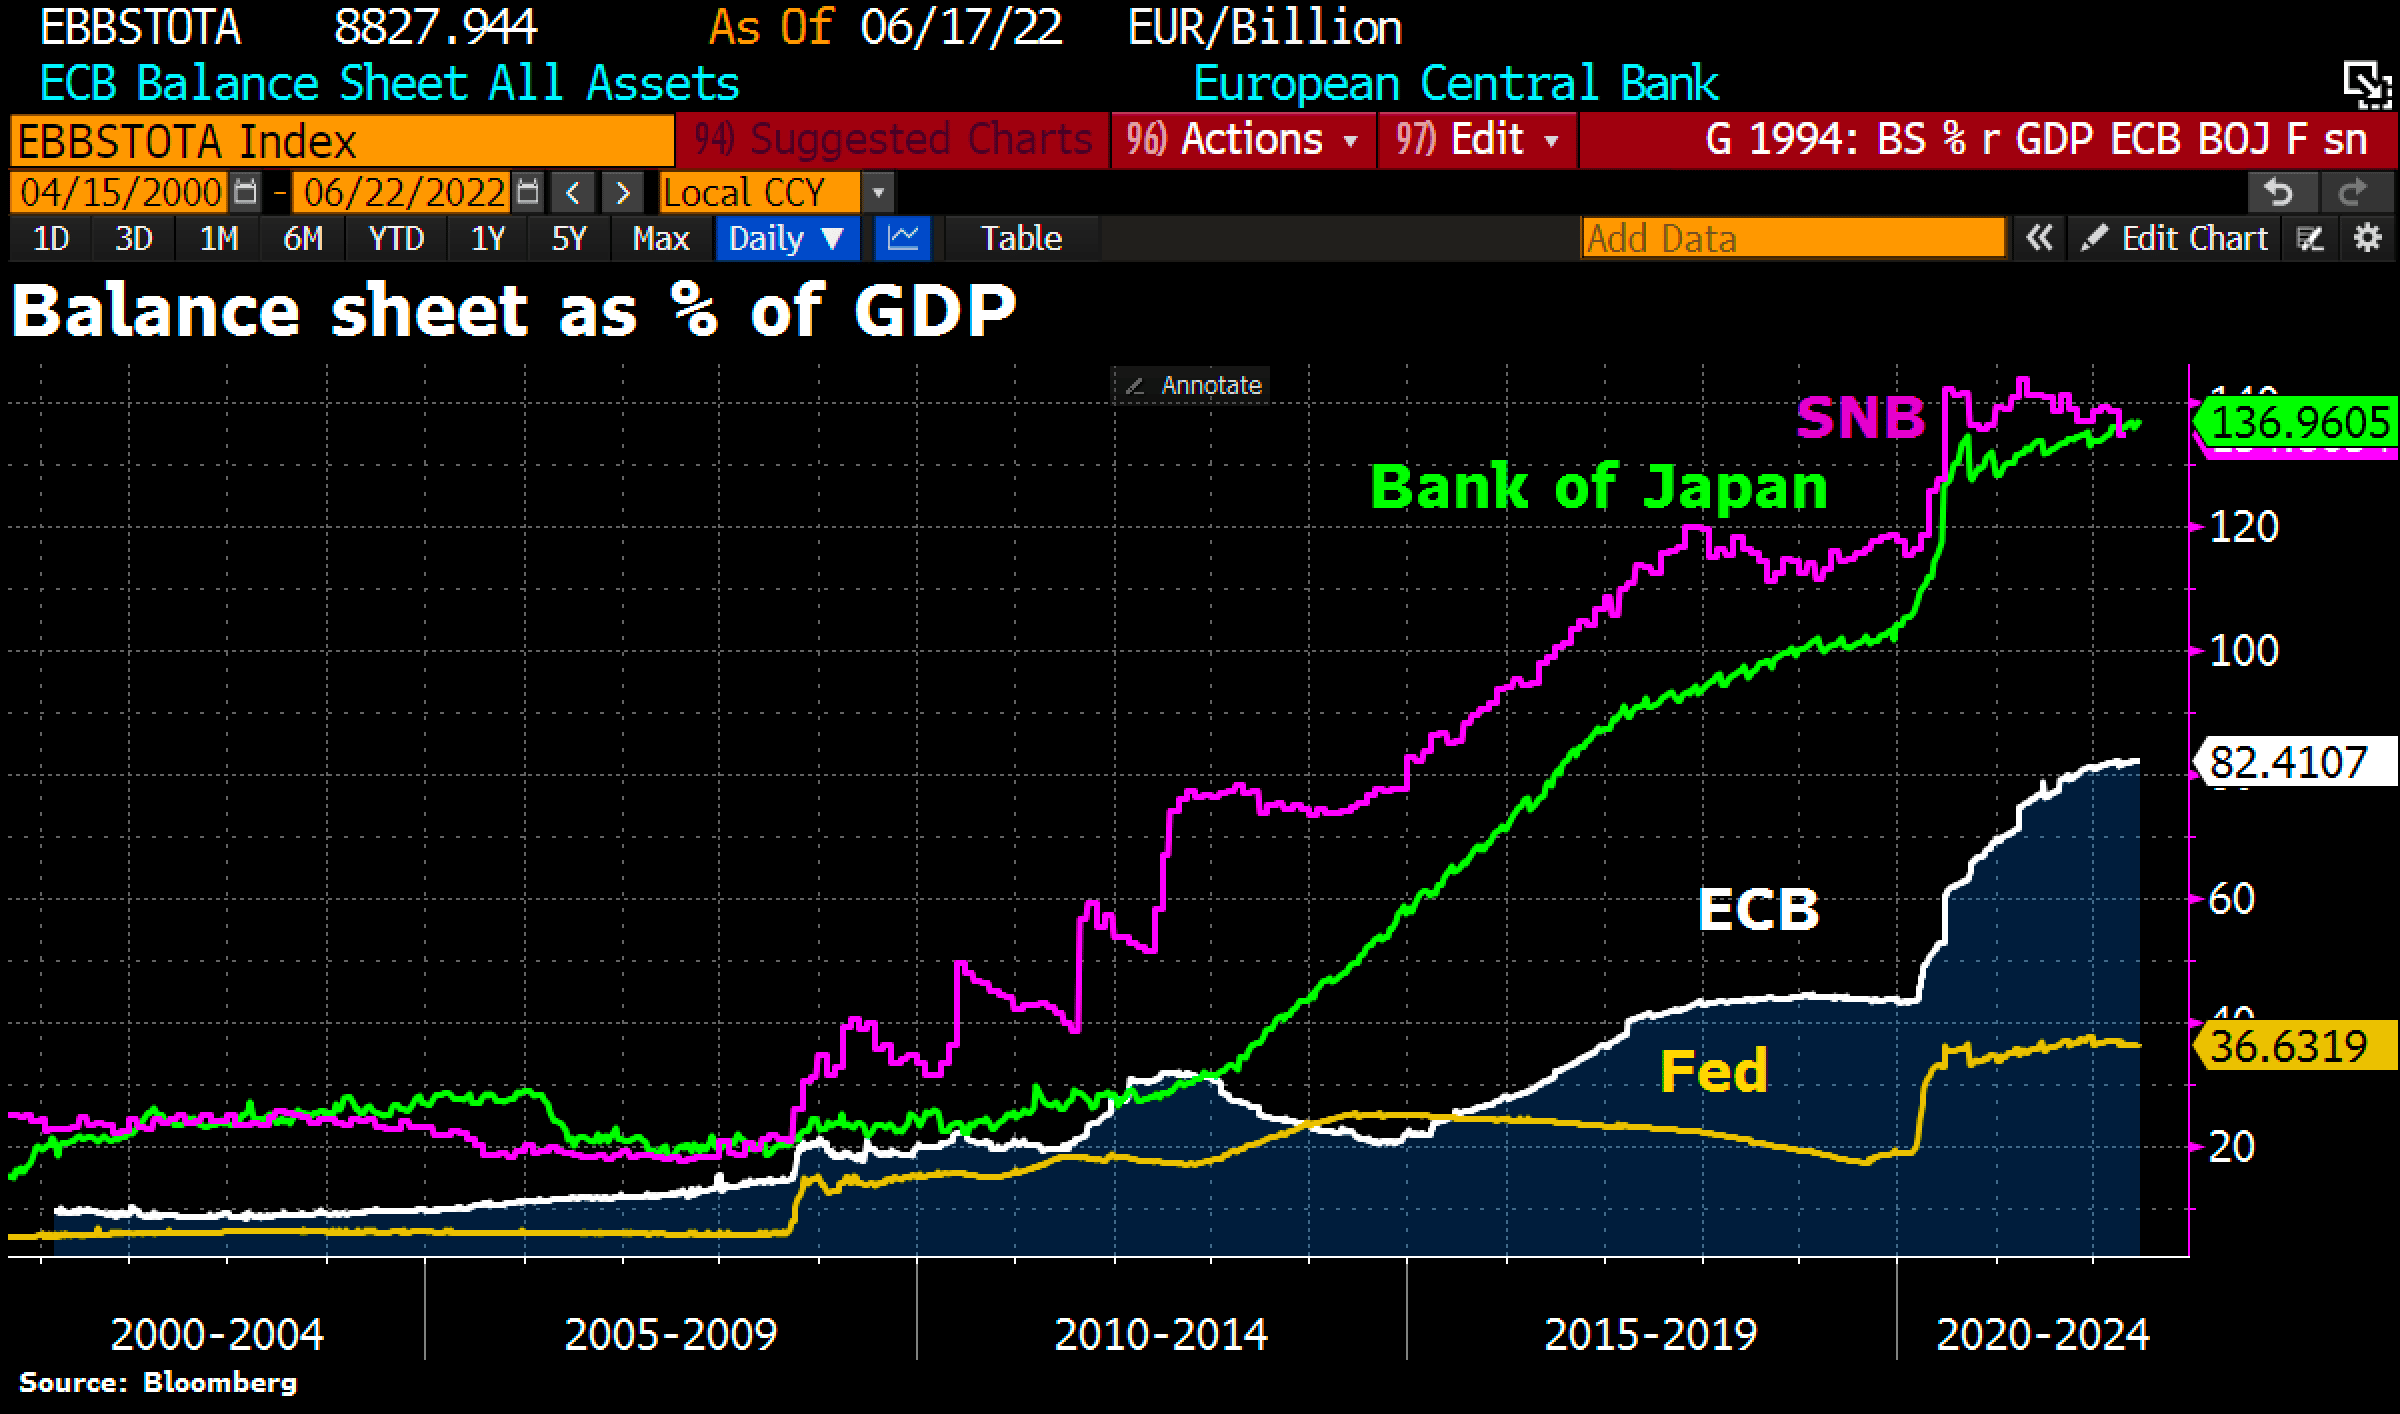
The global devaluation race As of June 22nd, 2022, ©Holger Zschaepitz
Obviously, the ECB headquarter in Frankfurt believes that there is still a lot of room to go up compared to the Bank of Japan’s 136.96% total assets/GDP. However, the dramatic losses in the Japanese yen clearly show where the euro is headed. The term “liraization of the euro” has already become established among experts in recent years and is now gaining momentum in reality.
Logically, and in view of rising inflation, the interest rates demanded by the credit markets also shot up. For example, the yield on 10-year U.S. Treasury bonds has exploded by a factor of 9.6 since the summer of 2020, from 0.33% to 3.495%! The U.S. Federal Reserve is lagging behind this development and has started to raise key interest rates much too late. At the same time, “quantitative easing” (QE) was terminated and on July 1st, the so-called “quantitative tightening” begins, with which liquidity is withdrawn from the markets. Now the Fed will probably have to raise interest rates into a recession, putting all asset classes under enormous pressure.
Meme: Real estate is next…
The consequences have already been eating their way through the financial markets at an accelerating pace since November 2021. And hence, the picture is currently turning towards a price collapse caused by a toxic mix of interest rate hikes, liquidity shortages and, in addition, excess inventories combined with a potential collapse in demand. All stock markets are therefore already in a bear market. The sell-off, especially in tech stocks, has been brutal. Bond markets are under tremendous pressure as well. On top of that, the crypto markets have been completely torn apart. The stress within the financial system is higher than it has been at any point since 2008.

Monthly real estate loan rate in the U.S., as of June 22nd, 2022, ©Michael McDonough.
Real estate prices are likely next, as monthly loan rates have already nearly doubled since the Corona Crash in March 2020.
This means that it is already foreseeable that central banks will have to take a massive U-turn again in the next three to twelve months and start supporting the markets once again with interest rate cuts and liquidity measurements. In the short-term to medium-term, however, the markets are most likely heading into a recession, and could quickly slide into a depression too.
Meme: Great Depression 2.0 vs. Weimar 2.0
In the medium and above all longer-term, central bankers will very likely take the path of lesser pain and once again use their printing presses. Unemployment will rise abruptly, at the latest, as markets crash further into fall when companies will likely start to cut jobs on a large scale in the second half of the year. Since the markets, like a junkie, have become totally dependent on stimulation by the FED & Co. and easy money through artifically low-interest rates over the past two decades, there will be no other way out than to lower interest rates again. After all, the FED will have built up a small toolbox by then, while the ECB has not even started its rate hike cycle yet. We continue to suspect that gold will be one of the first to start pricing in a monetary policy change in the next three to twelve months. However, we are not there yet.
Conclusion: Gold – Summer doldrums for several weeks would be ideal.
At the start of the summer and just before the end of the first half of the year, the gold market has entered a traditionally rather quiet phase of the year. Although no stone has been left unturned during this trading year so far, the probability that gold will once again allow itself an early summer nap is quite high. After the three-and-a-half-month correction since the beginning of March, the setup is already quite promising. At least the weekly chart is halfway oversold and would deliver the launching pad for a trending wave into the fall.
Whether this wave up would then only run to just under 2,000 USD or could perhaps have what it takes to break out to new all-time highs, cannot be seriously forecasted at the moment. However, the next few weeks should provide information on how strong the traditional summer rally in the gold market could be. With a bit of luck, every few years a bull market starts at the height of the summer, lasting well into spring of the next year and bringing a complete revaluation of the gold price. In this case, gold would have to break out above 2,050 USD in fall.
Gold – Summer doldrums for several weeks would be ideal
Given the current environment, this very bullish scenario comes with major question marks, of course. The ongoing contraction in the financial markets is likely to affect gold prices too. But a “gold – summer doldrums for several weeks would be ideal” as a launching pad for the typical summer rally. The alternative scenario would see a further drop towards and below 1,800 USD first. The summer rally should then start late and from lower levels at around 1,750 USD or slightly higher. In this case, a breakout above 2,000 USD in the further course of the year would be rather very unlikely.
The G7´s latest decision to ban Russian gold imports might actually contribute to gold’s next leg higher. Most of Russia’s gold has either stayed within the country or had been shipped and processed via Switzerland. From where the vast majority then went to the Middle East and Asia. Banning these imports will give China and India the opportunity to buy more gold directly from Russia at a discount and will deprive western markets of 19 billion USD worth of gold per year. Once again, the west has shot itself in the knee.
Analysis initially published on June 23rd, 2022, by www.celticgold.de. Translated into English and partially updated on June 26th, 2022.
Feel free to join us in our free Telegram channel for daily real time data and a great community. If you like to get regular updates on our gold model, precious metals and cryptocurrencies you can also subscribe to our free newsletter.
Disclosure: This article and the content are for informational purposes only and do not contain investment advice or recommendations. Every investment and trading move involves risk, and readers should conduct their own research when making a decision. The views, thoughts and opinions expressed here are the author’s alone. They do not necessarily reflect or represent the views and opinions of Midas Touch Consulting.

